Contents lists available atScienceDirect
Engineering Structures
journal homepage:www.elsevier.com/locate/engstruct
Experimental study of repaired RC columns subjected to uniaxial and biaxial
horizontal loading and variable axial load with longitudinal reinforcement
welded steel bars solutions
Hugo Rodrigues
a,⁎, André Furtado
b, António Arêde
b, Nelson Vila-Pouca
b, Humberto Varum
b aRISCO, School of Technology and Management, Polytechnic Institute of Leiria, Leiria, PortugalbCONSTRUCT-LESE, Faculty of Engineering (FEUP), University of Porto, Porto, Portugal
A R T I C L E I N F O
Keywords:Repaired RC columns Cyclic behaviour Biaxial testing Variable axial load Stiffness degradation Ductility
A B S T R A C T
The study of the reinforced concrete (RC) columns’ response to horizontal cyclic loads is of full importance to understand how earthquakes affect the integrity of structures. Essentially those already built and especially vulnerable to this type of action, as is the case of many existing buildings on significant seismic activity zones which are not adequately prepared for that eventuality. Consequently, there is also the need to perform a sig-nificant number of studies of repairing procedures of structural elements, so as to restore its function and possibly achieve an improvement in relation to its original seismic resistance. The present experimental work is focused in the study of welding joints for steel bars used in building columns, supported by tensile tests on specimens according to the actual welding regulations. The experimental results are analyzed and discussed with particular attention to the specimens’ behaviour in terms of strength and ductility compared to the results obtained for original steel bars. After the definition of the proper welding solution, six RC columns previously tested were repaired and retrofitted with this solution tested under uniaxial and biaxial horizontal loading and variable axial load in order to compare the global result with the original tested columns and the effects in-troduced by the repair process.
1. Introduction
The study of the reinforced concrete (RC) columns’ response to horizontal cyclic loads is essential to understand how earthquakes af-fect the integrity of structures, essentially those already built and especially vulnerable to this type of action, as is the case with many existing buildings on significant seismic activity zones which are not adequately prepared for that eventuality[1–3].
The importance of this topic is justified by several points, namely the biaxial cyclic bending demand applied to a RC column tends to reduce its capacity and to increase the stiffness and strength degrada-tion during cyclic loads. In RC buildings this effect is objective due to the random biaxial earthquake actions is strongly related and due to the three-dimensional building behaviour that can lead to important biaxial demands due to the effects of the structural irregularities[4–7]. Due to these effects the corner columns tends to be the most prone to biaxial bending demands, and also subjected to higher levels of axial load variation. Bearing in mind these aspects and considering the lack of experimental results on columns tested with repaired system, highlights the importance of the present study.
The variation in the axial load during an earthquake can change the strength, stiffness, and ultimate displacement, as well as all the hys-teretic properties of an RC element[4]. Such variations can occur due to the vertical component of the seismic load, or in the external col-umns of the bottom storeys of RC frames, due to the overturning mo-ments[5,8]. In fact, different authors have concluded that the variation in the axial load combined with the horizontal cycle actions affect significantly the inelastic response of the columns[9–11]. Only a lim-ited number of RC columns were tested under bi-directional horizontal forces, due to testing difficulties. These columns are mainly tested under constant axial load. The lack of results do not allow researcher to take strong conclusions to be drawn about coupling behaviour between biaxial bending and the varying axial force[11–13].
Past and Recent earthquakes as the L’Aquila (Italy) in 2009[14], Lorca (Spain) in 2011[15], Ghorka (Nepal) in 2015[16,17], Cental Italy in 2016[18]revealed some problems related with the insufficient capacity of these RC elements, especially in the corner columns. Many structures exhibit deficient confinement due to inadequate transversal reinforcement, leading to brittle collapses of the compressed columns. Adequate detailing can improve the structure seismic behaviour by
https://doi.org/10.1016/j.engstruct.2017.11.043
Received 11 May 2017; Received in revised form 27 October 2017; Accepted 20 November 2017 ⁎Corresponding author.
E-mail address:[email protected](H. Rodrigues).
0141-0296/ © 2017 Elsevier Ltd. All rights reserved.
increasing their strength and ductility. Many of this structures can be repaired and retrofitted after the earthquake.
Consequently, there is the need to perform experimental studies concerning the repair of damaged RC elements after an earthquake in order to restore its capacity and possibly to achieve an improved seismic behaviour [19–22]. One possible repair strategy is the re-establishment of the longitudinal reinforcement through the execution of welded joints. However, the cyclic behaviour of welded steel bars, to be applied in RC columns, was not studied in detail according to the literature. In this way, thefirst part of the present work is focused on the study of welding joints steel bars solutions that can be adopted for repair or rehabilitation of building’s columns. An experimental cam-paign of tensile strength tests (monotonic and cyclic) of four different solutions designed according to BS EN ISO 17660-1:2006 [23]. The experimental results are presented and discussed with particular at-tention on the specimens’ behaviour and in terms of strength and ductility.
The second part of the present work is devoted to the study of the repair of previously damaged RC columns with the defined welding solution and compare the results with the original columns. Finally, the effects introduced by the repair process are analysed and discussed, through the observation of damage evolution, hysteretic behaviour, stiffness degradation and dissipated energy.
2. Welding of steel rods for repairing procedures of RC columns previously damaged
2.1. Introduction and objectives
Due to the reduced number of experimental data available in the literature for validation of repair procedures for damaged RC columns through the welding of steel rods, the existing codes such as the Eurocode 8[24]do not consider this type of procedure for repairing RC structural elements in seismic zones.
Thus, the present study aims to evaluate the efficiency of different strategies for execution of welding of steel rods destined for repair of damaged RC columns. To accomplish this objective, it was conducted an experimental campaign of monotonic and cyclic tensile tests of four different welding of steel rods solutions, designed according to BS EN ISO 17660-1:2006[23]. The main test results, specifications and con-clusions will be presented along the present section.
2.2. Design and definition of the welding solutions
For the present study it was intended to apply the recommendations given by BS EN ISO 17660-1:2006 [23] for the design of different welded steel rods samples configurations and compare their perfor-mance under (monotonic and cyclic) tensile strength tests with those of simple steel rods.
BS EN ISO 17660-1:2006[23]proposes four different welded steel rods configurations, namely: (a) butt joint welding (b) unilateral lap joint welding (ST1) (c) unilateral lap joint welding (ST2) and (d) Bi-lateral strap joint welding, which are illustrated inFig. 1. Where E re-presents the existing steel rods that are connected to the emended P (but joint) and to the unilateral and bilateral steel rods welded.
According to Riva et al.[25]the tensile cyclic behaviour of the butt joint (Fig. 1a) configuration is not satisfactory, and this solution can be applicable only simultaneously applied with the unilateral lap joint welding (Fig. 1b) or the strap bilateral welding (Fig. 1d) configurations. The strap bilateral welding configuration (Fig. 1d) was also not con-sidered in the present study since it is leads to an unnecessary increase of the reinforcement steel area, when compared with the initial one.
For the present study it was decided to evaluate the performance of the two remaining configurations ST1 and ST2 under tensile monotonic and cyclic tests. The main difference between these two configurations is the ensure of the continuity of the alignment of the existing steel rods
with the elements E1 and E2 in the configuration ST1. It was intended also to observe the effects of the force deviation associated to the ec-centricity observed in the ST2 samples under tensile tests. For both configurations it was created two different variants (A and B), namely variation A which corresponds to a central span length between the splicing’s of 5∅ and 10∅ for variation B. The main purpose of con-sidering these two different variations was to achieve larger height distribution for the plastic hinge in existing RC columns.
The execution of the samples were realized according the re-commendations indicated in ISO 17660-1:2006[23], such for the butt welding execution as illustrated inFig. 2a, such for the unilateral lap joint welding execution, where the ISO 17660-1:2006 [23] re-commends for the overlap of two steel rods of diameter ∅, the minimum welding length 4∅ that could be reduced for 2.5∅, for case of the welding is performed in both two sides. Where 1 (Fig. 2b) re-presents weld, a the throat thickness, ∅ nominal diameter of the thinner of the two welded bars, looverall lap length and w the weld width.
2.3. Steel and electrodes mechanical properties
Forty-five samples were built for the present experimental campaign and it was selected a steel class S500 and the nominal mechanical va-lues are summarized inTable 1, according to the Eurocode 2[26]. It was used an electrode model OK 46.00 from the brand ESAB, which corresponds to the class 38 0 RC 11 according to BS EN ISO 2560:2005 [27]. The mechanical properties are summarized inTable 2, and the Fig. 1. Tensile test specimen configuration for (a) butt joint welding; (b) unilateral lap joint welding (type 1); (c) unilateral lap joint welding (type 2) and (d) bilateral strap joint welding.
welding process adopted was shield metal arc welding. 2.4. Experimental campaign of tensile strength tests 2.4.1. General overview
The tensile strength tests campaign was composed by 45 samples (9 simple steel rods“REF”; 9 ST1A; 9 ST1B; 9 ST2A and 9 ST2B) tested along 3 different phases: Phase 1: 21 monotonic tests of all the samples types; Phase 2: monotonic tensile tests of samples REF, ST2A and ST2B; andfinally Phase 3: cyclic charge and discharge tests of all the types of samples. The cyclic test loading history is illustrated inFig. 3, and all the experimental campaign is summarized inTable 3. The diameter of the bars under study is∅12 mm. Along the present section the per-formance of each of the four welded steel rods samples designed for the present study will be evaluated in terms of observed damage and stress-strain curves. The results of the designed samples will be also con-fronted to the results obtained by the reference simples steel rods (Reference group).
2.4.2. Tensile strength test results
As mentioned earlier the possible curvature of the samples during the tensile tests was one of the most important concerns that were taken Fig. 2. Recommendation for the execution for (a) single V butt weld and (b) lap joints using single-sided intermittent lap welds disposition according to ISO 17660-1:2006[23].
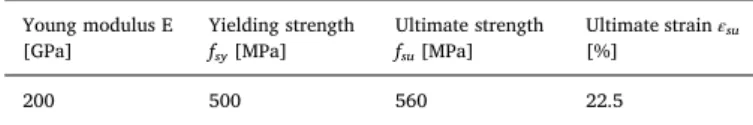
Table 1
Nominal mechanical properties of steel S500[32]. Young modulus E [GPa] Yielding strength fsy[MPa] Ultimate strength fsu[MPa] Ultimate strainεsu [%] 200 500 560 22.5 Table 2
Mechanical properties of electrode 38 0 RC 11. Yielding strength fsy[MPa] Ultimate strength fsu
[MPa]
Ultimate strainεsu[%]
400 510 28
Step
Force (kN)
Fig. 3. Loading pattern adopted for cyclic tensile strength tests.
Table 3
Experimental campaign of tensile strength tests of welding steel rods solutions.
Samples Type of Test
Monotonic Cyclic
Phase 1 Phase 2 Phase 3
0 3 3 3
ST1A 6 0 3
ST1B 6 0 3
ST2A 3 3 3
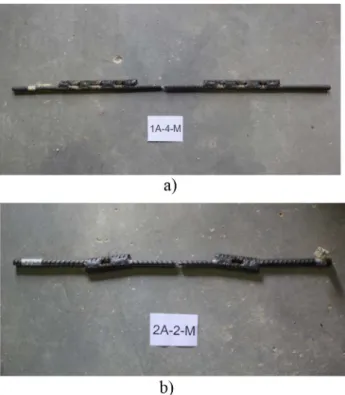
into account in their design. As expected, this effect was more notorious in the ST2 samples, justified by the eccentricity between the tensile force alignment and the welding steel rod. In the case of the ST1 samples this effect was prevented by the butt weld, being much less visible during the tests (Fig. 4). It should be noted that none of the samples suffer weld rupture, since the rupture occurs always in the central zone of the simple steel rod between the splices.
The results obtained for the monotonic tensile strength tests are summarized inTables 4 and 5. From the monotonic tensile strength tests summarized inTable 4the following observations can be drawn:
•
During the tests of specimens from the ST2A and ST2B Groups it was Fig. 4. Final damage observed in samples (a) ST1 and (b) ST2.Table 4
Experimental test results for the monotonic tensile strength tests– Phase 1. Group Samples Elasticity
Modulus [GPa] Yielding strength [MPa] Yielding extension [%] Ultimate strength [MPa] Ultimate extension [%] O Average 212.6 433.7 0.2% 540.8 17.0% S.D 21.4 5.1 0.02% 2.1 1.4% C.O.V. 10.1% 1.2% 9.1% 0.4% 8.3% ST2A Average 132.7 445.1 0.3% 577.3 12.2% S.D 9.6 7.2 0.02% 13.6 0.4% C.O.V. 7.3% 1.6% 5.3% 2.4% 2.9% ST2B Average 113.5 450.0 0.4% 575.7 11.0% S.D 11.8 14.1 0.05% 16.8 0.6% C.O.V. 10.4% 3.1% 12.4% 2.9% 5.7% Table 5
Experimental test results for the monotonic tensile strength tests– Phase 2. Group Samples Elasticity
Modulus [GPa] Yielding strength [MPa] Yielding extension [%] Ultimate strength [MPa] Ultimate extension [%] O Average 209.5 431.7 0.24% 548.7 15.2% S.D 33.4 9.6 0.03% 1.49 0.47% C.O.V. 15.9% 2.22% 13.5% 0.27% 3.1% ST1A Average 195.1 430.0 0.23% 555.6 16.5% S.D 19.3 4.8 0.05% 2.9 0.88% C.O.V. 9.9% 1.1% 22.5% 0.52% 5.4% ST1B Average 139.4 421.8 0.34% 547.9 14.9% S.D 2.8 0.3 0.03% 2.9 0.24% C.O.V. 2.0% 0.06% 8.8% 0.52% 1.6% ST2A Average – – – 553.4 – S.D – – – 1.7 – C.O.V. – – – 0.31% – ST2B Average – – – 552.3 – S.D – – – 1.0 – C.O.V. – – – 0.19% –
a)
b)
0 100 200 300 400 500 600 700 0 5 10 15 20 25 30 Str ess (MP a) Apparent strain (%0) 0-1-M 0-2-M 0-3-M 0 100 200 300 400 500 600 700 0 5 10 15 20 25 30 Str e ss (MP a) Apparent strain (%0) 2A-1-M 2A-2-M 2A-3-Mc)
0 100 200 300 400 500 600 700 0 5 10 15 20 25 30 Str e ss (MP a) Apparent strain (%0) 2B-1-M 2B-2-M 2B-3-MFig. 5. Stress-strain results for the monotonic strength tests (a) Group REF; (b) Group ST2A and (c) ST2B.
observed (as mentioned in Section 2.4.2) the curvature of the samples. The eccentricity between the tensile force applied and the welding steel rod introduced that failure mechanism. Due to this effect it was not possible to obtain some parameters under study such Elasticity modulus, yielding strength and yielding extension;
•
Decrease of the average elasticity modulus around 35% for the samples ST2A and 45% for ST2B when compared with the reference samples (Group REF), which can be related with: (i) the force de-viation, which appears to be higher for the ST2B samples, due to the shorter the length between splicing’s (5∅) and consequently stiffer, and forcing the curvature of the top and bottom; (ii) less tangential stiffness of the welding between rods, since G = E/(1 + υ);•
Slight increase of the yielding strength (around about 2.5%) and for the ultimate strength (around 7%) in ST2A and ST2B samples, which can be related with the possible steel hardening during the weldingprocess due to the higher temperatures;
•
Significant increase of the yielding extension about 40% and 70% for the ST2A and ST2B samples;•
Decrease of the extension for the maximum strength for the ST2Aa)
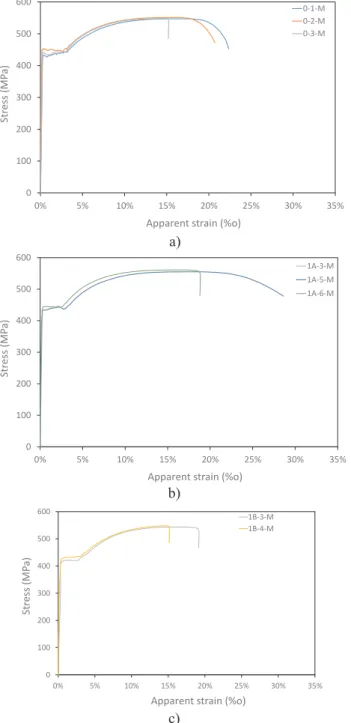
0 100 200 300 400 500 600 0% 5% 10% 15% 20% 25% 30% 35% Str ess (MP a)Apparent strain (%o)
0-1-M 0-2-M 0-3-M
b)
c)
0 100 200 300 400 500 600 0% 5% 10% 15% 20% 25% 30% 35% Str ess (MP a)Apparent strain (%o)
1A-3-M 1A-5-M 1A-6-M 0 100 200 300 400 500 600 0% 5% 10% 15% 20% 25% 30% 35% Str ess (MP a)
Apparent strain (%o) 1B-3-M 1B-4-M
Fig. 6. Stress-strain results for the monotonic strength tests (a) Group REF; (b) Group ST1A and (c) ST1B.
Table 6
Experimental test results for the cyclic tensile strength tests– Phase 3. Group Samples Elasticity
Modulus [GPa] Yielding strength [MPa] Yielding extension [%] Ultimate strength [MPa] Ultimate extension [%] O Average 160.5 434.3 0.35% 547.9 16.5% S.D 9.2 5.5 0.02% 3.4 2.6% C.O.V. 5.7% 1.3% 6.1% 0.62% 15.9% ST1A Average 130.6 433.8 0.35% 562.8 21.4% S.D 9.4 0.07 0.02% 2.1 2.1% C.O.V. 7.2% 0.02% 7.00% 0.37% 9.6% ST1B Average 125.1 416.8 0.39% 553.5 18.6% S.D 0.00 0.00 0.00% 6.7 0.00% C.O.V. 0.00% 0.00% 0.00% 1.2% 0.00% ST2A Average – – – 548.7 – S.D – – – 0.97 – C.O.V. – – – 0.18% – ST2B Average – – – 552.9 – S.D – – – 1.4 – C.O.V. – – – 0.25% –
a)
b)
Apparent strain (%o)
Apparent strain (%o)
Stress(MPa)
Stress(MPa)
Fig. 7. Stress-strain results for the cyclic strength tests (a) Group REF; (b) Group ST1A and ST1B.
solutions (about 40%) and for ST2B (50%). In theFig. 5 can be observed in the strain-stress results in that the ultimate extension is affected, due to the accumulated effects of the axial extension and the curvature observed during the tests, that leads to a combination of strains and result in an anticipation of the fracture.
Based on the results summarized inTable 5it can be observed (i) decrease of the average elasticity modulus (10% for ST1A and 33% for ST1B); (ii) slight decrease of the average yielding strength, about 2%; (iii) significant increase of the yielding extension for the samples ST1B (40%); Same range of results obtained for the ultimate strength. The stress-strain results are plotted inFig. 6.
From the cyclic test results, summarized inTable 6, it can be ob-served (i) decrease of the elasticity modulus, about 20%; (ii) similar values for the yielding strength; (iii) slight increase of the ultimate strength and (iv) similar values for extension at the maximum strength. The stress-strain results are illustrated inFig. 7.
The specimens from the group ST1A (monotonic) reached similar elasticity modulus as the Group 0 due to the welding configuration. The behaviour of the ST1A samples is governed by the central element P (Fig. 1b). In fact, it was always observed the rupture in this central element which justifies the similar results obtained when compared with Group 0 (reference specimens/group).
3. Experimental campaign of repaired RC columns subjected to biaxial loading and constant/variable axial load
3.1. Specimen description and experimental setup
The experimental tests on full scale RC elements, especially con-sidering the repair and retrofitting strategies are fundamental to un-derstand validate the proposed technics. However, the number of tests of RC columns subjected to biaxial bending with axial loading (constant and/or variable) is significantly less than the number of uniaxial bending tests, which make difficult to characterize the interaction be-tween the biaxial loading and the RC columns response. The present study aims to contribute to increase data regarding to this type of ex-perimental tests, particularly, the study of the behaviour of repaired RC columns. Six RC columns were tested with the same geometry and longitudinal reinforcement that were subjected to biaxial horizontal loading with different loading pattern combined with variable axial load[28].
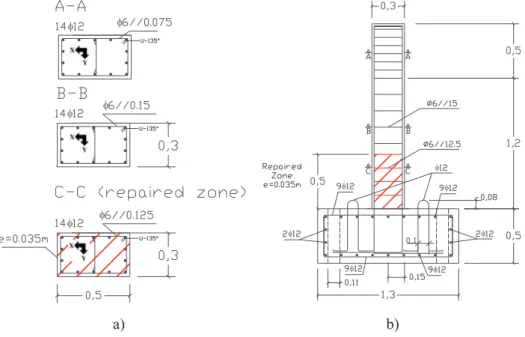
The six specimens were repaired with two different repairing stra-tegies, and were tested for different loading condition that will be de-scribed below. The column specimens are 1.70 m height, and are cast in strong square concrete foundation blocks with dimensions 1.30 × 1.30 m2in plan and 0.50 m high. The cross-section dimensions and the reinforcement detailing are presented inFig. 8. Four holes are
a)
b)
Fig. 8. RC column specimen dimensions and reinforce-ment detailing (units in meters): (a) Cross-sections de-tails, (b) specimen dimensions and general scheme of the reinforcement layout.
Table 7
Specimen specifications and loading characteristics. Group Specimen Repair
solution
Geometry [cm × cm]
fcm(MPa) fym(MPa) Test Loading condition Comparative column
Loading condition Of the comparative columns Axial Loading (kN) Horizontal Displacement path type
Axial Loading (kN) Horizontal Displacement path type
Original PC01NV19 Originaç 30 × 50 27.9 576 300
( ± 150 kN)
Type 1 N/A N/A N/A
PC12NV21 Type 2
Repaired PC12N1B ST1B 300 Type 2 PC12NV21
PC12NV1B
300 ( ± 150 kN) Type 2
PC12N1A ST1A Type 2 PC12NV21
PC12NV1A
Type 2
PC01NV1B ST1B 300
( ± 150 kN)
Type 1 PC01NV19 Type 1
PC12NV1A ST1A Type 2 PC12NV21 Type 2
PC12NV1B ST1B Type 2 PC12NV21 Type 2
drilled in the foundation block to fix the specimen to the laboratory strongfloor. With the cantilever model it is assumed that the inflection point of a 3.0 m height column is located at its mid-height (1.5 m), representing the behaviour of a column at the base of a typical building when subjected to lateral demands induced by earthquakes. An extra 0.20 m height is added for attaching the actuator devices. Details of the reinforcement and material properties are summarized and shown in Fig. 8andTable 7.
Fig. 9a shows the general view of the setup adopted for the ex-perimental testing. The system includes two independent horizontal actuators to apply the lateral loads on the column specimen (one with a capacity of 500 kN with ± 150 mm stroke and the other with a capacity of 200 kN and ± 100 mm stroke). A vertical actuator was used to apply the axial load. Two steel reaction frames and a concrete reaction wall form the reaction system for the three actuators (Fig. 9b). The column specimens and the reaction frames werefixed to the strong floor of the laboratory with prestressed steel bars to avoid sliding or overturning of the specimen during testing, or sliding of the reaction frame. Since the
axial load actuator remains in the same position during the test while the column specimen laterally deflects, a sliding device is used (placed between the top-column and the actuator), which was built to minimise spurious friction effects.
3.2. Repair strategy for previously damaged RC columns
Evaluated the test results regarding to the samples of welded steel rods, it was intended to choose the most efficient and suitable solution and then implementing them on the repaired RC columns. In the pre-vious section it was observed that no significant differences were ob-served in terms of strength and ductility between the solution type 1 (ST1) and 2 (ST2), and the choice was determined by the effect of the biasing force. The eccentricity associated with the geometry of ST2 specimens caused curvature in the splicing area, which could result in the crushing of the surrounding concrete, and thus it was decided by the ST1 to implement in the repaired RC columns. Thus, two different variations of the ST1 were tested with the main objective of control the
a)
b)
Actuator 500kN with +/-150mm Actuator 200kN with +/-100mmSteel reaction frame
Reaction wall
Specimen
Steel reaction fra me Vertical Actuator 700kN Direction X Direction Y Direction X Direction Y
Fig. 9. Testing setup: (a) general view, (b) schematic layout (plan view).
Fig. 10. Particularity of the welding procedure of the samples to the longitudinal steel rebars from the foundation.
plastic hinge position, transporting it to a higher position, and trying to reduce the bending force and consequently increase the maximum strength value for a resisting moment equal of the original structure. One of the objectives was also to reach the plastic phase of the re-inforcement steel in the area immediately upper to top splicing.
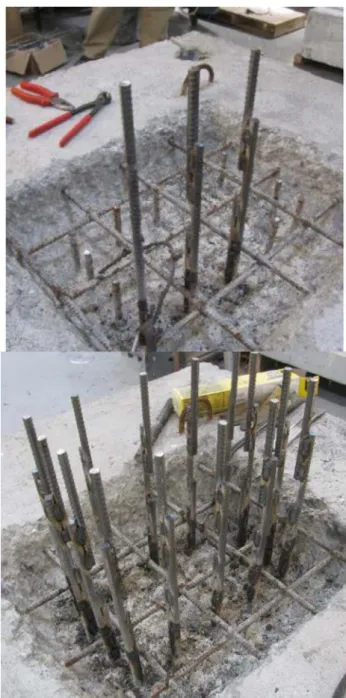
The repair process of the damaged RC columns is summarized in six steps:
(1) Delimitation of the repairing area (the critical section at the plastic hinge region), typically from the footing up to 50 cm along the column height) (seeFigs. 10 and 11);
(2) Removal and cleaning of the damaged concrete;
(3) The welding repair process of the longitudinal steel rebars started
by use discontinuous welding of the two sides, as had been per-formed in the tension tests of the welded samples described in the Section2, being the splicing of the interior steel rebars in a per-pendicular plane to the faces of the column. This splicing position is the most suitable for the solution composed by the welding of two sides. The 14 pieces required for the fourteen longitudinal steel rebars were prepared and were welded to the longitudinal rebars of the foundation;
(4) After, the column was lined up according to the welded steel rebars, followed by thefinal welding process with the columns rebars: starting from the lateral weld splicing followed by the opening of the chamfer for posterior realization of the butt welding. It should be noted that the sequence of alignments to welding most follow a symmetric logic from the previous alignment, also taking into ac-count some time waiting so as to enable the cooling and re-establishment of the initial length of the steel rebars, relieving the increase of stress caused by the dilation (temperature effects). At the end of this step it was observed that no significate curvature/ buckling was observed and thus can be concluded that this is the best option for similar works to be performed in the future. Note that the steel mechanical properties of the welding samples used to repair the columns has the same characteristics that the one that was used in the original RC columns, and described inTable 2; a) b) Repaired zone L=50cm L=50cm Repaired zone
Fig. 11. Particularity of thefinal layout of specimens repaired with (a) SP1A and (b) SP1B solutions.
Table 8
Mechanical properties from the compressive and tensile strength tests of the micro-con-crete.
Sample Age (days) Elastic modulus (MPa)
Mean Elastic Modulus (MPa) Fc (MPa) 1 6 N/A N/A 60.5 2 12 70.0 3 16 72.6 4 28 35,800 36,000 68.7 5 36,500 68.4 6 35,900 70.3
Uniaxial – Strong direction (Type 1)
Rhombus (Type 2)
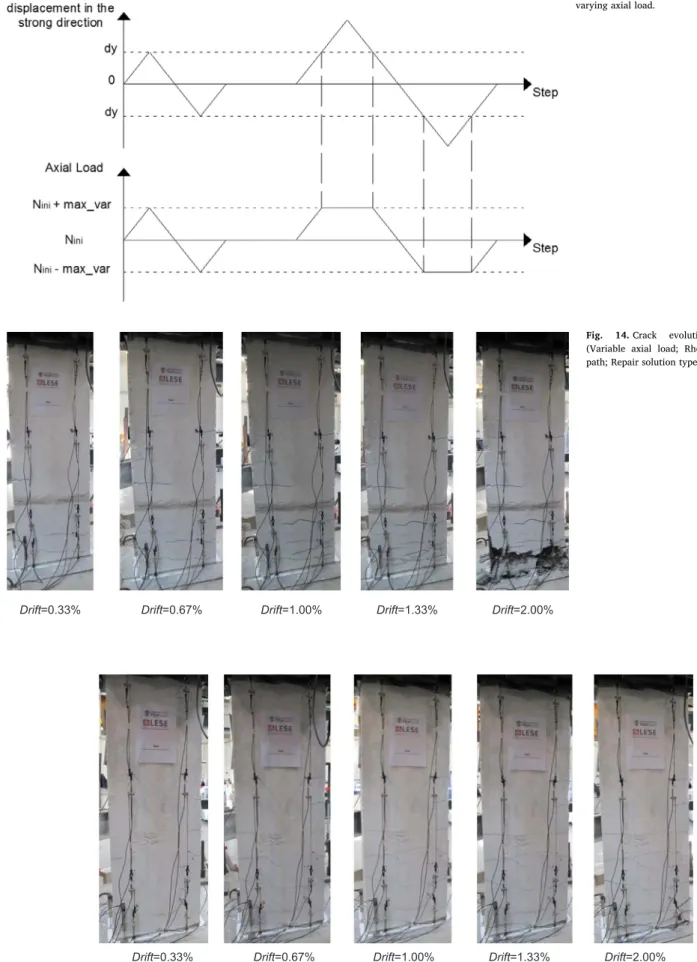
Fig. 13. Axial loading condition for tests under varying axial load.
Drift=0.33% Drift=0.67% Drift=1.00% Drift=1.33% Drift=2.00%
Fig. 14. Crack evolution – PC12NV1A (Variable axial load; Rhombus displacement path; Repair solution type 1A).
Drift=0.33% Drift=0.67% Drift=1.00% Drift=1.33% Drift=2.00%
(5) Replacement of the transversal reinforcement with the half of the initial space of 0.15 m;
(6) Application of formwork to cast with a micro-concrete to restore the previously clean area of the column. The micro-concrete is in a mixture of a structural repair mortar (commercial type “MasterEMaco S 5450 PG) with a gravel diameter of 4–16 mm following the technical recommendations. Material characteriza-tion tests were performed in order to obtain further informacharacteriza-tion of the micro concrete used to restore the RC columns. For this com-pressive strength tests (6 samples) and tensile elastic modulus test (3 samples) were performed and the main results are summarized in Table 8.
3.3. Axial load and displacement path
In order to characterise the response of the column specimens, cyclic lateral displacements were imposed at the top of the column with steadily increasing demand levels. Three cycles were repeated for each lateral deformation demand level. This procedure allows for the un-derstanding of the column’s behaviour, a comparison between different
tests and provides information for the development and calibration of numerical models. The adopted load paths are summarized inFig. 12, and the following nominal peak displacement levels (in mm) were considered: 3, 5, 10, 4, 12, 15, 7, 20, 25, 30, 35, 40, 45, 50, 55, 60, 65, 70, 75, 80.
Regarding the horizontal load path definition, many questions can be open in this topic, especially those associated with the response dependency of the load paths as observed by several authors[4,5,7], however in the present the research work the rhombus was selected, even considering that is very limited, it allows to compared the re-sponse of different columns under the same loading conditions. Con-sidering that the biaxial effect is more important in corner columns, the axial load applied in the tested elements was defined so as to convey current values for columns at the ground-storey of mid/low rise buildings (3–4 storeys). The different specimens’ characteristics, repair strategy and horizontal displacement path type are presented inTable 4 andFig. 12respectively.
Prior to the tests with varying axial loading, the peak capacities in terms of displacements and the strengths corresponding to thefirst yield were numerically evaluated based on numerical simulations of the uniaxial tests. With this information the columns axial load was con-sidered variable and proportional to the imposed lateral drift applied until the yielding drift. In the biaxial tests the axial load variation is relative to the displacement observed in the strong direction. Beyond the yielding point the axial load was kept constant. The initial axial load
a)
b)
0 1 2 3 4 5PC01_NV19
PC01_NV1A
PC01_NV1B
1st bar fracture Conv. Rupture Buckling Spalling Observed damage Drift (%) Cracking 0 1 2 3 4 5PC12_NV21
PC12_NV1A
PC12_NV1B
PC12_N1B
PC12_N1A
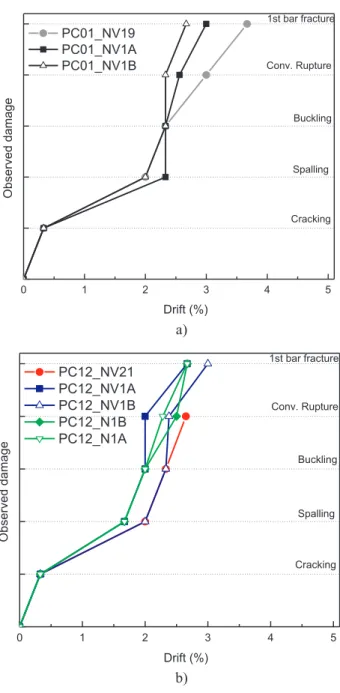
1st bar fracture Conv. Rupture Buckling Spalling Observed damage Drift (%) CrackingFig. 16. Observed damage evolution: (a) uniaxial tests and (b) biaxial tests.
a)
b)
-4 -3 -2 -1 0 1 2 3 4 -200 -150 -100 -50 0 50 100 150 200-60 -45 -30 -15 0 15 30 45 60 -45 -34 -22 -11 0 11 22 34 45 Y X X PC01_NVR1A PC01_NV19 Shear X (kips) Displacement X (mm) Shear X (kN) Drift X (%) 30x50 Y -4 -3 -2 -1 0 1 2 3 4 -200 -150 -100 -50 0 50 100 150 200-60 -45 -30 -15 0 15 30 45 60 -45 -34 -22 -11 0 11 22 34 45 PC01_NVR1B PC01_NV19 Shear X (kips) Displacement X (mm) Shear X (kN) Drift X (%) Y X X 30x50 YFig. 17. Shear-drift hysteretic response of uniaxial tests: (a) PC01-NV19vsPC01NVR1A and (b) PC01-NV19vsPC01NVR1B.
was set on 300 kN and variations of ± 150 kN were considered as can be observed inFig. 13.
4. Experimental results and discussion
This present section discusses the results of the testing campaign, resulting from the visual observations and from the measured para-meters. Based on the visual observation and on the test data, the da-mage evolution is analysed for each single specimen. Based on the shear-drift curves, global parameters of the response are analysed, namely the ultimate ductility, stiffness and strength degradation, as well as the coupling effect due to the biaxial loading. The differences between the original and the repaired RC columns were analysed by comparing the effect of the uniaxial and biaxial (with and without variable axial load) test results. The evolution of the dissipated energy during each test is analysed, and expressions for the equivalent viscous damping were derived.
4.1. Damage evolution
For all tests, a horizontal crack was observed at the base of the columns, associated with the maximum bending moment in this region. In all the tests (for uniaxial or biaxial loading), horizontal cracks dis-tributed along the column length (associated with the flexural domi-nant columns’ response) were observed for early demand stages (illu-strated in Figs. 14 and 15). For each drift demand level, the biaxial loading induces a higher level of damage in the column base than the
uniaxial loading. In the biaxial tests, after horizontal cracks form, larger lateral demands initiate concrete spalling in the column corners. For uniaxial tests, when concrete spalling is observed in the column cor-ners, it promptly expands along the whole section width of the column. For biaxial tests, a bar located at the corner of the column base is always thefirst to break. In all cases where the plastic hinge region comprised a stirrup, its failure was observed.
As observed in previous studies[7,28], it is observed higher level of damage in the base of the column for the biaxial tests when compared with the uniaxial tests with constant axial loading. For RC columns under biaxial loading combined with variable axial load, it is observed a non-uniform damage in the column, which is most evident in the north and south faces, since the maximum axial load matches with the maximum horizontal displacement according to the strong direction of the column. As expected, the buckling of the repaired bars was re-stricted to the section composed by a simple re-bar between the spli-cing’s, since the overlap of the re-bars in the splicing provided high stiffness to this sections. Consequently, the rupture of the re-bars oc-curred in this zones, and it is important to note that as observed in the Section2, no re-bar fractured in the welding sections. From the ob-servation of all tests damages five levels of damaged were reported (cracking, spalling, buckling, conventional rupture and 1st bar rupture) and plotted inFig. 16, and the following considerations can be per-formed:
•
It was not found a variation of the drift demand for which occurred the beginning of the cracking, according to the repair strategy, ora)
b)
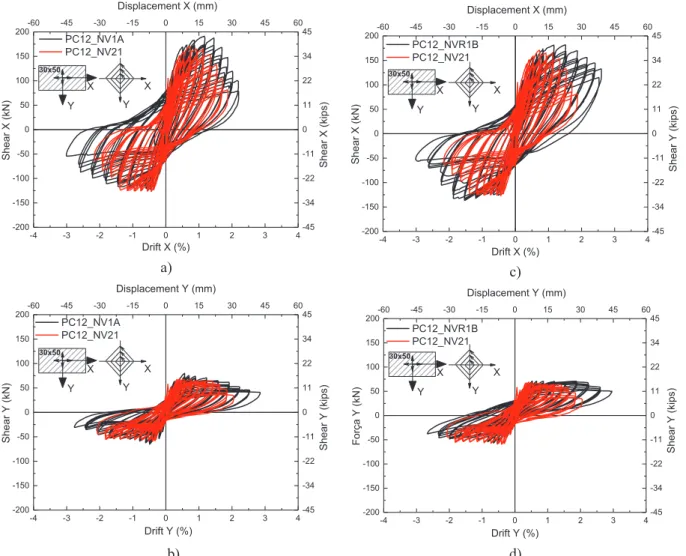
-4 -3 -2 -1 0 1 2 3 4 -200 -150 -100 -50 0 50 100 150 200-60 -45 -30 -15 0 15 30 45 60 -45 -34 -22 -11 0 11 22 34 45 PC12_NV1A PC12_NV21 Shear X (kips) Displacement X (mm) Shear X (kN) Drift X (%) Y X X 30x50 Y -4 -3 -2 -1 0 1 2 3 4 -200 -150 -100 -50 0 50 100 150 200-60 -45 -30 -15 0 15 30 45 60 -45 -34 -22 -11 0 11 22 34 45 PC12_NV1A PC12_NV21 Shear Y (kips) Displacement Y (mm) Shear Y (kN) Drift Y (%) Y X X 30x50 Yc)
d)
-4 -3 -2 -1 0 1 2 3 4 -200 -150 -100 -50 0 50 100 150 200-60 -45 -30 -15 0 15 30 45 60 -45 -34 -22 -11 0 11 22 34 45 PC12_NVR1B PC12_NV21 Shear Y (kips) Displacement X (mm) Shear X (kN) Drift X (%) Y X X 30x50 Y -4 -3 -2 -1 0 1 2 3 4 -200 -150 -100 -50 0 50 100 150 200-60 -45 -30 -15 0 15 30 45 60 -45 -34 -22 -11 0 11 22 34 45 PC12_NVR1B PC12_NV21 Shear Y (kips) Displacement Y (mm) Força Y (kN) Drift Y (%) Y X X 30x50 Ythe type of test;
•
The repaired columns subjected to biaxial bending with constant axial load suffered spalling and buckling for drift demand corre-sponding to 66% of the original non-damaged one, with variable axial load;•
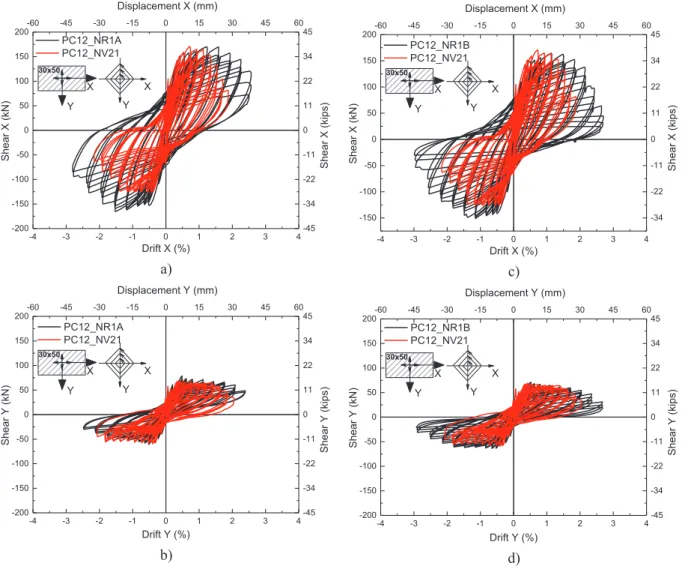
The conventional rupture occurred in the repaired columns, gen-erally, for lower drift demands when compared with the original ones, about 30% in the uniaxial tests and 10% for biaxial tests. 4.2. Shear-drift hysteric responseFrom the analyses of the shear force-displacement hysteretic re-sponse of the uniaxial tests, biaxial tests with constant and variable axial load, plotted in Figs. 17–19 the following conclusions can be performed:
•
In the biaxial tests, the plateau tends to be shorter and the softening is more pronounced, i.e., a more abrupt decay of the column strength is observed with increasing lateral deformation demands;•
The repair procedures caused a slight decrease of the initial stiffness in the columns subjected to biaxial bending with constant and variable axial load in the directions X+ and Y+; However no sig-nificant effects can be observed in other directions;•
Comparing the uniaxial and biaxial test results with variable axial load with the same repair procedure, it was not observed in the last ones a generalized decrease of the maximum strength for a specific direction as was observed in the original columns.From the shear-drift envelopes, plotted inFig. 20, the following considerations can be performed:
•
In the shear-drift curves’ envelopes, four main stages can be iden-tified in the, corresponding to: (i) the pre-cracking response; (ii) the post cracking behaviour, until the reinforcement steel begins to yield; (iii) a more-or-less evident plateau in the post-yielding hard-ening zone and (iv) a softhard-ening phase;•
From the comparison between the repaired columns subjected to variable axial load with the corresponding original ones, it is ob-served 10% higher maximum strength. In the case of the repaired columns subjected to constant axial load it was observed that when comparing with the results with the tests with variable axial load (i) the maximum strength was lower about 10–15% for the repaired columns and about 5% with the original column.4.3. Columns’ ultimate ductility
The procedure adopted in this work to evaluate ultimate ductility is based on the method proposed by Park[29], but adapted to be used along with the complete cyclic test results, whilst considering the possible hardening of the post-yield response. Park[29]proposed a procedure for the cyclic testing of RC columns based on previous as-sessments of the yield displacement. Essentially, the test is run in two stages, where thefirst stage corresponds to the evaluation of the yield displacement. First, a lateral load is applied monotonically to the spe-cimen in one direction until the load is either equal to the first
a)
b)
-4 -3 -2 -1 0 1 2 3 4 -200 -150 -100 -50 0 50 100 150 200-60 -45 -30 -15 0 15 30 45 60 -45 -34 -22 -11 0 11 22 34 45 PC12_NR1A PC12_NV21 Shear X (kips) Displacement X (mm) Shear X (kN) Drift X (%) Y X X 30x50 Y -4 -3 -2 -1 0 1 2 3 4 -200 -150 -100 -50 0 50 100 150 200-60 -45 -30 -15 0 15 30 45 60 -45 -34 -22 -11 0 11 22 34 45 PC12_NR1A PC12_NV21 Shear Y (kips) Displacement Y (mm) Shear Y (kN) Drift Y (%) Y X X 30x50 Yc)
d)
-4 -3 -2 -1 0 1 2 3 4 -150 -100 -50 0 50 100 150 200-60 -45 -30 -15 0 15 30 45 60 -34 -22 -11 0 11 22 34 45 PC12_NR1B PC12_NV21 Shear X (kips) Displacement X (mm) Shear X (kN) Drift X (%) Y X X 30x50 Y -4 -3 -2 -1 0 1 2 3 4 -200 -150 -100 -50 0 50 100 150 200-60 -45 -30 -15 0 15 30 45 60 -45 -34 -22 -11 0 11 22 34 45 PC12_NR1B PC12_NV21 Shear Y (kips) Displacement Y (mm) Shear Y (kN) Drift Y (%) Y X X 30x50 Ycalculated or measured yield or equal to three-quarters of the calculated ideal strength of the specimen, whichever is less. Then, the specimen is loaded in the opposite direction using the same procedure. The average of the displacements obtained in the two directions, corresponding to the intersection points of the secant stiffness and the horizontal lines for
the ideal strength of the specimen, defines the reference yield dis-placement[30]. In this work, the procedure adopted is based on the method proposed by Park[29], but it was adapted to be used along with the complete cyclic test results, whilst considering the possible hardening of the post-yield response. The strategy defined to calculate the ultimate ductility of the specimens subjected to the rhombus dis-placement path was composed by the following stages and is in agreement with the Rodrigues et al.[31]proposal procedure:
– Evaluation of the maximum strength of the specimen in both test directions;
– Identification of the cycle in which the strength is lower than three-quarters of the previously evaluated maximum strength of the spe-cimen;
– Calculation of the secant stiffness (Ky) for the cycle identified in step 2;
– Adjustment of the branch corresponding to the post-yield stiffness (Kpl);
– Determination of the intersection points of Kyand Kplfor each di-rection, giving the yield displacement in each direction. The average of the yield displacements obtained in the two directions (dy+and dy−) provides the reference yield displacement (Δy).
The evaluation of the ultimate ductility for the specimens subjected
a)
b)
-4 -3 -2 -1 0 1 2 3 4 -200 -150 -100 -50 0 50 100 150 200-60 -45 -30 -15 0 15 30 45 60 -45 -34 -22 -11 0 11 22 34 45 PC01_NV19 PC01_NVR1A PC01_NVR1B Shear X (kips) Displacement X (mm) Shear X (kN) Drift X (%) Y X X 30x50 Y -4 -3 -2 -1 0 1 2 3 4 -200 -150 -100 -50 0 50 100 150 200-60 -45 -30 -15 0 15 30 45 60 -45 -34 -22 -11 0 11 22 34 45 PC12-NV21 PC12-NVR1A PC12-NVR1B PC12-NR1A PC12-NR1B Shear X (kips) Displacement X (mm) Shear X (kN) Drift X (%) Y X X 30x50 Yc)
-4 -3 -2 -1 0 1 2 3 4 -200 -150 -100 -50 0 50 100 150 200-60 -45 -30 -15 0 15 30 45 60 -45 -34 -22 -11 0 11 22 34 45 PC12-NV21 PC12-NVR1A PC12-NVR1B PC12-NR1A PC12-NR1B Shear Y (kips) Displacement Y (mm) Shear Y (kN) Drift Y (%) Y X X 30x50 YFig. 20. Shear-drift envelopes of: (a) uniaxial tests and (b) biaxial tests with constant axial load, and (c) Biaxial tests with variable axial load.
a)
b)
0 5 10 15 20 25 Positive Negative DuctilitySpecimens
NV19X NVR1AX NVR1BX Y X X 30x50 Y 0 5 10 15 20 25 Positive Negative Ductility YSpecimens
NV21 X X Y NVR1A NVR1B X Y NR1A X Y NR1BY X Y X X 30x50 YFig. 21. Ultimate ductility of: (a) uniaxial tests and (b) biaxial tests with constant variable axial load.
to the uniaxial displacement path was composed by the same stages but related to only one direction of the tests (strong direction– Direction X). The method adopted to evaluate the yield displacement in this analysis has a clear advantage over the estimation by simplified for-mulae because the method is based on experimental test results. Moreover, procedures that define the yield point based on an equivalent
elastoplastic system with equal energy absorption may not properly represent the influence of the initial stiffness and the post-yield stiffness on the yield displacement
Regarding the repaired RC columns one of the main goals was to verify efficiency of the repairing procedure described in the keeping or improving of the original column ductility. From the ratios between the yielding displacement and ductility between the repaired and the
a)
b)
0 1 2 3 4 0.0 0.1 0.2 0.3 0.4 0.5 0.6 0.7 0.8 0.9 1.0PC01_NVR1A (2nd cicle X negative) PC01_NVR1B (2nd cicle X negative) PC01_NVR1A (3rd cicle X negative) PC01_NVR1B (3rd cicle X negative) PC01_NV19 (2nd cicle X negative) PC01_NV19 (3rd cicle X negative) Normalized strength de gradation (%) Drift X negative (%) Y X X 30x50 Y 0 1 2 3 4 0.0 0.2 0.4 0.6 0.8 1.0
PC12_NR1A (2nd cycle negative) PC12_NR1A (33d cycle negative) PC12_NR1B (2nd cycle negative) PC12_NR1B (3rd cycle negative) PC12_NVR1A (2nd cycle negative) PC12_NVR1A (3rd cycle negative) PC12_NVR1B (2nd cycle negative) PC12_NVR1B (3rd cycle negative) PC12_NV21 (2nd cycle negative) PC12_NV21 (3rd cycle negative) Normalized strength de gradation (%) Drift X- (%) Y X X 30x50 Y
c)
0 1 2 3 4 0.0 0.2 0.4 0.6 0.8 1.0PC12_NR1A (2nd cycle negative) PC12_NR1A (33d cycle negative) PC12_NR1B (2nd cycle negative) PC12_NR1B (3rd cycle negative) PC12_NVR1A (2nd cycle negative) PC12_NVR1A (3rd cycle negative) PC12_NVR1B (2nd cycle negative) PC12_NVR1B (3rd cycle negative) PC12_NV21 (2nd cycle negative) PC12_NV21 (3rd cycle negative) Normalized strength de gradation (%) Drift Y- (%) Y X X 30x50 Y
Fig. 22. Strength degradation of: (a) uniaxial tests and (b) biaxial tests with constant axial load, and (c) biaxial tests with variable axial load.
a)
0 1 2 3 4 0.0 0.2 0.4 0.6 0.8 1.0 PC01_NV1A PC01_NV1B PC01_NV19 Relative Stiffness (%) Drift X (%) Y X X 30x50 Yb)
c)
0 1 2 3 4 0.0 0.2 0.4 0.6 0.8 1.0 PC12_NV21 PC12_NV1A PC12_NV1B PC12_N1A PC12_N1B Relative Stiffness (%) Drift X (%) Y X X 30x50 Y 0 1 2 3 4 0.0 0.2 0.4 0.6 0.8 1.0 PC12_NV21 PC12_NV1A PC12_NV1B PC12_N1A PC12_N1B Relative Stiffness (%) Drift Y (%) Y X X 30x50 YFig. 23. Stiffness degradation of: (a) uniaxial tests and (b) biaxial tests with constant axial load, and (c) biaxial tests with variable axial load.
original column inFig. 21, the following conclusions can be drawn:
•
The results clearly shown that the maximum ductility observed in the original columns was exceeded by the repaired columns, parti-cularly in the biaxial tests;•
There was a slight increase of the ductility of the repaired columns in the negative direction, for the uniaxial test, associated with the decrease of the yielding displacement; In one of the columns it was observed a ductility decrease for the direction X+, for which one the yielding displacement increased also;•
For the biaxial tests, it was verified a considerable increase of the repaired columns ductility in both directions, being particularly notorious how quickly these columns reached the maximum strength in the weaker direction Y, resulting at lows values of yielding displacement.4.4. Strength degradation
The strength degradation was estimated according to the procedure proposed by Rodrigues et al. [31] for each displacement demand (comprising three cycles), the shear force was normalized by the maximum shear force, which occurs during thefirst pull (Fig. 22). The strength degradation analysis was based on the semi-cycles of negative force because thefirst force incursion for each displacement amplitude was made in the positive force direction in all of the tests.
As observed by Rodrigues[7,28]the strength degradation in all of the columns keeps constant until certain level of drift, and by com-paring this results with the obtained in Section4.1it is verified that the values are around for which occurred spalling and buckling. Since the above described damage states occurred for lower drift levels in the biaxial tests when compared with the uniaxial tests, the strength de-gradation occurred earlier.
4.5. Stiffness degradation
Stiffness degradation was evaluated by comparing the peak-to-peak secant stiffness values resulting from the first cycle of each imposed peak displacement.Fig. 23show the lateral peak-to-peak stiffness de-gradation for each column in each direction. From the results, the fol-lowing can be concluded:
•
All of the repaired columns show less pronounced stiffness de-gradation for the same drift demands, when compared with the original ones;•
The stiffness degradation was not significantly affected by the con-stant or variable axial load;4.6. Cumulative energy dissipated
The cumulative hysteretic dissipation energy was evaluated for all the tests, considering the area of each loading cycle in the X and Y direction, and then the total energy was calculated as the sum of these two parts. The results in terms of evolution of cumulative dissipated energy are presented in Fig. 24. From the analysis of the results the following conclusions can be drawn:
•
Different response of the repaired and the original columns, de-pending if subjected to uniaxial or biaxial tests: in thefirst case the cumulative energy dissipative is higher for repaired columns for similar drift demands, and the opposite is observed in the second case;•
For the biaxial tests, it was found that the columns with different repair procedures obtained similar response when subjected to constant axial load; otherwise it is observed more variation for the tests with variable axial load. In the case of the repaired columns (subjected to variable axial load) when compared with the originalthe results obtained didn’t show any improvement for the same drift demands. Nevertheless, the ST1A leads to obtain the same energy dissipation of the original column.
5. Summary and conclusions
The main objective of the present work was to study the behaviour of RC columns repaired, when subjected to horizontal uniaxial and biaxial horizontal loading. One of the main issues was to study in detail the repair procedure and the local behaviour of the longitudinal re-inforcement repair through welding. Thus, initially the study starts with the test of welding re-bars samples and subsequently in the application of this techniques in RC columns previously tested.
The use of an adequate electrode and a suitable cord length well designed and executed for the pretended application guarantee the integrity of the welding re-bars, being the rupture conditioned by the resistance of the steel re-bars as observed in the experimental campaign of tensile strength of different welding solutions. The monotonic tests showed higher ultimate strength, however it is verified reduction of the elasticity modulus, yielding extensions and maximum strength. The results regarding to the samples cyclically tested it was verified slight increase of the ultimate strength, however the other parameters were similar to the ones observed in the simple re-bars.
After this, six RC columns were repaired by two different repair procedures and were tested for uniaxial and biaxial loading combined
a)
b)
0 1 2 3 4 0 20 40 60 80 100 120 140 160 180 200 PC01_NV1A PC01_NV1B PC01_NV19Accumulative energy dissipated (kN.m)
Maximum Drift(%) Y X X 30x50 Y 0 1 2 3 4 0 20 40 60 80 100 120 140 160 180 200 PC12_NV21 PC12_NV1A PC12_NV1B PC12_N1A PC12_N1B
Accumulative energy dissipated (kN.m)
Maximum Drift (%) Y X X 30x50 Y
Fig. 24. Cumulative energy dissipated of: (a) uniaxial tests and (b) biaxial tests with constant and variable axial load.
with constant and variable axial load. It was observed similar results between the repaired and the original columns results. The repair process reduced the initial stiffness in the columns subjected to biaxial bending, only for X+ and Y+ directions, while similar values to the original ones were found for the remaining directions and types of the test. The repaired columns when tested biaxially obtained similar re-sults of the original column for the maximum strength, which not occur for the columns tested uniaxially where verified slight increase. The repaired columns shows an increase of the ductility, more pronounced in the biaxial tests, and otherwise it is observed lower stiffness de-gradation for same drift demands when compared with the original columns. Finally, the accumulative energy dissipated of the repaired columns is higher for the uniaxial tests slight lower for the biaxial tests. In general, the repair procedures were very efficient to restore the ca-pacity of the columns, which was also improved in certain cases. Acknowledgments
Thefirst author would like to acknowledge the financial support to the research Unit RISCO (FCT/UID/ECI/04450/2013) also funded by FEDER funds through COMPETE2020 – Programa Operacional Competitividade e Internacionalização (POCI) and by national funds through FCT – Fundação – Fundação para a Ciência e a Tecnologia, Portugal. The second, third and fourth authors would like to ac-knowledge the financial support by: Project POCI-01-0145-FEDER-007457 – CONSTRUCT – Institute of R&D. In Structures and Construction funded by FEDER funds through COMPETE2020 – Programa Operacional Competitividade e Internacionalização (POCI)– and by national funds through FCT – Fundação para a Ciência e a Tecnologia, Portugal. Finally the authors acknowledge the constructive comments and suggestions given by the anonymous reviewers which improved the quality of the manuscript.
Appendix A. Supplementary material
Supplementary data associated with this article can be found, in the online version, athttp://dx.doi.org/10.1016/j.engstruct.2017.11.043. References
[1] Romão X, Delgado R, Guedes J, Costa A. A comparative application of different
EC8-3 procedures for the seismic safety assessment of existing structures. Bull
Earthquake Eng 2010;8:91–118.
[2] Petrone F, Shan L, Kunnath SK. Modeling of RC frame buildings for progressive
collapse analysis. Int J Concr Struct Mater 2016;10:1–13.
[3] Kim D-K. Seismic response analysis of reinforced concrete wall structure using
macro model. Int J Concr Struct Mater 2016;10:99–112.
[4] Bousias SN, Verzeletti G, Fardis MN, Gutierrez E. Load-path effects in column biaxial bending with axial force. J Eng Mech 1995;596–605.
[5] Bousias SN, Verzelleti G, Fardis MN, Magonette G. RC columns in cyclic biaxial bending and axial load. presented at the 10th World Conf. on Earthq. Engrg,
Madrid; 1992. p.3041–6 .
[6] Rodrigues H, Varum H, Arêde A, Costa AG. Behaviour of reinforced concrete column
under biaxial cyclic loading—state of the art. Int J Adv Struct Eng 2013;5:1–12.
[7] Rodrigues H, Arêde A, Varum H, Costa AG. Experimental evaluation of rectangular reinforced concrete column behaviour under biaxial cyclic loading. Earthquake Eng Struct Dyn 2012.
[8] Bousias SN, Panagiotakos TB, Fardis MN. Modelling of RC members under cyclic
biaxialflexure and axial force. J Earthquake Eng 2002;6(2):213–38.
[9] CEB. RC frames under earthquake loading Lausanne; 1996.
[10] Sfakianakis MG, Fardis MN. Bounding surface model for cyclic biaxial bending of
RC sections. J Eng Mech 1991;117:2748–69.
[11] Bonet JL, Barros MHFM, Romero ML. Comparative study of analytical and
nu-merical algorithms for designing reinforced concrete sections under biaxial
bending. Comput Struct 2006;84:2184–93.
[12] Rodrigues H, Varum H, Arêde A, Costa A. Behaviour of reinforced concrete column
under biaxial cyclic loading– state of the art. Int J Adv Struct Eng 2013;5:4.
[13] Sfakianakis MG, Fardis MN. RC Column model for inelastic seismic response
ana-lysis in 3D. J Eng Mech 1991;117:2770–87.
[14] Vicente R, Rodrigues H, Varum H, Costa A, Silva JM. Performance of masonry
enclosure walls: lessons learned from recent earthquakes. Earthquake Eng Eng Vib
2012;11.
[15] Romão X, Costa AA, Paupério E, Rodrigues H, Vicente R, Varum H, et al. Field
observations and interpretation of the structural performance of constructions after
the 11 May 2011 Lorca earthquake. Eng Fail Anal 2013;34:670–92.
[16] Gautam D, Rodrigues H, Bhetwal KK, Neupane P, Sanada Y. Common structural and
construction deficiencies of Nepalese buildings. Innov Infrastruct Solut 2016;1:1.
[17] Varum H, Furtado A, Rodrigues H, Oliveira J, Vila-Pouca N, Arêde A. Seismic
performance of the infill masonry walls and ambient vibration tests after the
Ghorka 2015, Nepal earthquake. Bull Earthquake Eng 2017;15:1–28.
[18] Stewart J, Lanzo G. Engineering reconnaissance following the October 2016 Central Italy earthquakes (REPORT: GEER-O5OD); 2017.
[19] Rodrigues H, Arêde A, Furtado A, Rocha P. Seismic behavior of strengthened RC
columns under biaxial loading: an experimental characterization. Constr Build
Mater 2015;95:393–405.
[20] Rodrigues H, Arêde A, Furtado A, Rocha P. Seismic rehabilitation of RC columns
under biaxial loading: an experimental characterization. Structures 2015;3:43–56.
[21] Priestley M, Seible F, Calvi M. Seismic design and retrofit of bridges. New York:
Wiley; 1996.
[22] Priestley MJN, Park R. Strength and ductility of concrete bridge columns under
seismic loading. ACI Struct J 1987;84:61–76.
[23] BS EN ISO 17660-1:2006– Welding – Welding of reinforcing steel – Part 1: load-bearing welded joints; 2008.
[24] Eurocode 8: design of structures for earthquake resistance– Part 1–3: strengthening and repair of buildings– European prEN 1998-1-3, B. European Committee for Standardization, Belgium; 2003.
[25] Riva P, Franchi A, Tabeni D. Welded Tempcore reinforcement behaviour for seismic
applications. Mater Struct/Matériaux et Constructions 2001;34:240–7.
[26] Eurocode 2: design of concrete structures– Part 1–1: general rules and rules for buildings, CEN; 2004.
[27] BS EN ISO 2560:2005: welding consumables– covered electrodes for manual metal arc welding of non-alloy andfine grain steels – classification; 2006.
[28] Rodrigues H, Furtado A, Arêde A. Behavior of rectangular reinforced-concrete
columns under biaxial cyclic loading and variable axial loads. J Struct Eng
2016;142.
[29] Park R. Evaluation of ductility of structures and structural assemblages from
la-boratory testing. Bull NZ Natl Soc Earthquake Eng 1989;22.
[30] Tsuno K, Park R.“Experimental study of reinforced concrete bridge piers subjected
to bi-directional quasi-static loading. Struct Engrg Struct JSCE 2004;21(1):11s–26s.
[31] Rodrigues H, Arêde A, Varum H, Costa A. Experimental evaluation of rectangular
reinforced concrete column behaviour under biaxial cyclic loading. Earthquake Eng
Struct Dyn 2013;42:239–59.