2018, v.34, e34
* E-mail: [email protected] 26
ciências do comPorTamenTo
Advantages of Using HJ-Biplot Analysis
in Executive Functions Studies
Natalia Cadavid Ruiz1,*, Jaime Egido2, Purificación Galindo-Villardón2, & Pablo Del-Río3
1Pontificia Universidad Javeriana, Cali, Colombia
2Universidad de Salamanca, Salamanca, Espanha
3Universidad Carlos III, Madrid, Espanha
ABSTRACT - Executive functions (EFs) are considered a multiple system of processing, associated with different components, such as inhibition, working memory, planning, among others. The study of EFs requires the assessment of all its components, having in mind the socio-demographic and cognitive characteristics of the target population. Nowadays, analysis of variance is used to achieve this goal; nevertheless, HJ-Biplot analysis overcome its limitations by allowing simultaneous examination of multiple data, such as those generated in EFs studies. This study evaluates possible differences in the EFs of 80 8–year-old Colombian children by their sex, socio-economic status and type of school they attend, to exemplify the advantages of using HJ-Biplot analysis in neuropsychological studies.
KEYWORDS:Executive functions, cognitive ability, children, assessment, methodology.
Vantagens do Uso da Análise HJ-Biplot
em Estudos de Funções Executivas
RESUMO - As funções executivas (EFs) são consideradas um sistema de vários componentes associados, como inibição, memoria de trabalho, planejamento e outros. O estudo das EFs requer a avaliação da totalidade dos seus componentes, tendo em conta as caraterísticas sociodemográficas e cognitivas da população-alvo. A analise de variância é usada para atingir esse objetivo. No entanto, a análise HJ-Biplot supera suas limitações, permitindo o exame simultâneo de dados múltiplos, como os gerados nos estudos de EFs. Este estudo avalia as possíveis diferenças nas EFs de 80 crianças de 8 anos de idade na Colômbia segundo seu sexo, nível socioeconômico e tipo de escola que frequentam, para exemplificar
as vantagens de usar a analise HJ-Biplot nos estudos neuropsicológicos.
PALAVRAS-CHAVE:Funções executivas, habilidade cognitiva, criança, avaliação, metodologia
Traditionally, the evaluation of executive functions (EFs) has been considered as an integral element of any neuropsychological assessment directed towards determining the functioning of mind–brain–behavior relationships. Its evaluation focuses on the establishment of executive performance in psychological tests, and, in the case of dysfunction, the possible localization as well as its implication on global cognitive and behavioral functioning.
Given that EFs are considered a higher multi-component cognitive process, their assessment consists of reviewing the status of each one of their processes and inferring the neuropsychological condition of the associated neural
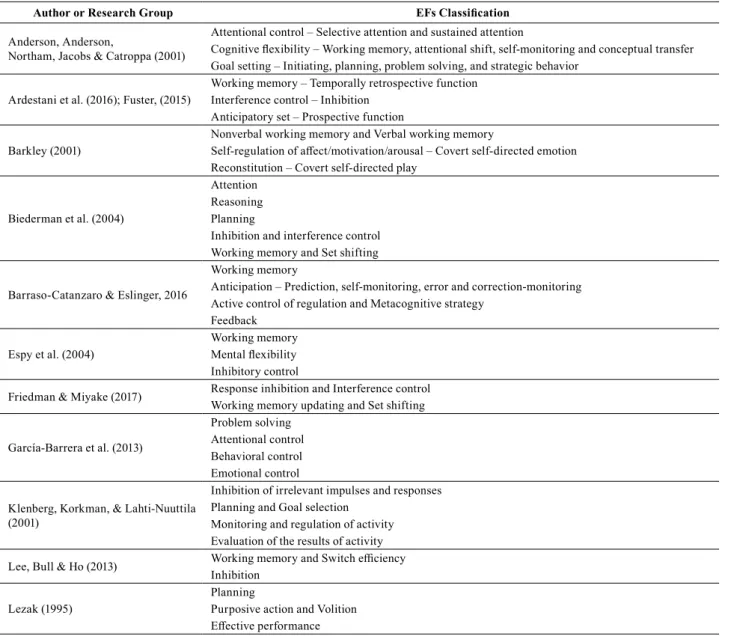
Specifically, EFs can be considered as the whole process of metacognition and self-regulation directed by present and future goals to respond consciously and intentionally to novel situations (Ardestani, Shen, Darvas, Toga, & Fuster, 2016; Anderson & Doyle, 2004; Anderson, 2001; Barkley, 2001; Borkowski & Burke, 1996; Carlson, Mandell, & Williams, 2004; Fernández-Duque, Baird & Posner, 2000; Friedman & Miyake, 2017; García-Barrera, Karr, & Kamphaus, 2013; Hothersall, 2005). Most of their exponents agree to emphasize EFs as a dynamic mental process, composed of a set of steps that occur over time; however, they differ in the number and name of these processes, a situation that has resulted in numerous classifications of EFs, as shown in Table 1.
A careful review of the scientific literature on this topic showed that the most popular mental processes associated with human executive functioning are inhibition, working memory, planning, and verbal self-regulation and, on the
other hand, that EFs are composed of at least by three mental processes, as shown in Table 1. This means that the assessment of EFs requires the analysis of the functioning of each one of its particular cognitive processes so as to understand the person’s executive pattern of strengths and difficulties.
Nowadays, the evaluation and research of the executive functioning domain is done primarily by applying different psychological tests, each one assessing a particular executive cognitive process, and analyzing the resultant data. This data is used to identify the level of performance of children on each executive cognitive process and to determine the presence of significant differences between children according to socio-demographic variables such as age, sex, grade level and socio-economic status.
For example, García-Barrera et al. (2013) studied the EFs of 1237 children, aged 6 to 11 years old. They use a confirmatory factor analysis and a latent growth analysis to
Table 1. Examples of classifications of the components of EFs
Author or Research Group EFs Classification
Anderson, Anderson,
Northam, Jacobs & Catroppa (2001)
Attentional control – Selective attention and sustained attention
Cognitive flexibility – Working memory, attentional shift, self-monitoring and conceptual transfer Goal setting – Initiating, planning, problem solving, and strategic behavior
Ardestani et al. (2016); Fuster, (2015)
Working memory – Temporally retrospective function Interference control – Inhibition
Anticipatory set – Prospective function
Barkley (2001)
Nonverbal working memory and Verbal working memory
Self-regulation of affect/motivation/arousal – Covert self-directed emotion
Reconstitution – Covert self-directed play
Biederman et al. (2004)
Attention Reasoning Planning
Inhibition and interference control Working memory and Set shifting
Barraso-Catanzaro & Eslinger, 2016
Working memory
Anticipation – Prediction, self-monitoring, error and correction-monitoring Active control of regulation and Metacognitive strategy
Feedback
Espy et al. (2004)
Working memory
Mental flexibility
Inhibitory control
Friedman & Miyake (2017) Response inhibition and Interference control Working memory updating and Set shifting
García-Barrera et al. (2013)
Problem solving Attentional control Behavioral control Emotional control
Klenberg, Korkman, & Lahti-Nuuttila (2001)
Inhibition of irrelevant impulses and responses
Planning and Goal selection
Monitoring and regulation of activity Evaluation of the results of activity
Lee, Bull & Ho (2013) Working memory and Switch efficiency Inhibition
Lezak (1995)
Planning
tracked longitudinally, during three years, the development of problem solving, attentional, behavioral and emotional control. Meanwhile, Lee, Bull and Ho (2013) used a multivariate analysis to examine EFs age-related differences in 688 participants, between 6 and 15 years old. On the other hand, Klenberg, Korkman and Lahti-Nuuttila (2001) studied the developmental sequence of attention and EFs in 400 3-to-12-year-old Finnish children. The EFs assessment consisted of the evaluation of the cognitive processes of inhibition, self-regulation, planning, and verbal and non-verbal fluency. They ran ANOVAs and post-hoc Bonferroni tests to investigate the effects and interactions of age, sex, and parent education level in the children’s performance in these cognitive processes. Additionally, they employed factor analysis to determine possible intercorrelations among the psychological subtests applied and to identify possible latent factors.
Anderson, Anderson, Northam, Jacobs, and Catroppa (2001) plotted the development of the executive skills of 138 Australian children, aged 11 to 17. They evaluated the children’s executive processes of selective attention, working memory, cognitive flexibility, verbal fluency, problem-solving ability, and planning and organizational ability. For this, they ran ANOVAs and Fisher’s LSD procedures. The relationship between the tests was evaluated using correlations, while the presence of factors underlying performance on test measures was evaluated with a principal component analysis.
Meanwhile, Ardila, Rosselli, Matute, and Guajardo (2005) analyzed the relationship with parents’ educational
level and type of school the child attended in 622 5-to-14-year-old Colombian children’s executive functioning. They assessed verbal and non-verbal fluency, verbal concept formation, abstract reasoning and conceptualization, cognitive flexibility, and problem-solving ability. They used MANOVAs and Tukey analysis tests to evaluate significant differences by sex, age, and school type. Pearson correlations were used to determine associations between parents’ educational level and EFs scores.
The advantages that the analysis of variance provides to these types of studies can be overcome by using a new statistical procedure for psychological research, the HJ-Biplot analysis, used in other scientific fields with evident advantages (Demey, Vicente-Villardón, Galindo-Villardón, & Zambrano, 2008; Gabriel & Odoroff, 1990; Martín-Rodríguez, Galindo-Villardón, & Vicente-Villardón, 2002; Strauss, et al., 1979). The major benefits of this technique are that it allows: (a) the simultaneous examination of multiple variables in the same graphical representational plane: psychological measures, participants and their socio-demographic variables; (b) comparison on an individual and group level; (c) provision of information on the relationship between measures of the same and/or different origin; and (d) no need to perform a posteriori contrasts.
The present study aims to highlight the use of HJ-Biplot analysis in psychological and neuropsychological studies focused on deepening the understanding on human executive skills as well as overall cognitive functioning.
METHOD
Participants
The participants consisted of 80 children, 40 girls and 40 boys aged eight years old, with normotypical psychological development and who regularly attend public and private schools from rural and urban zones of Bogotá, Colombia. They were also grouped by their socio-economic status (SES) in rural, low, middle and high levels.
Instruments
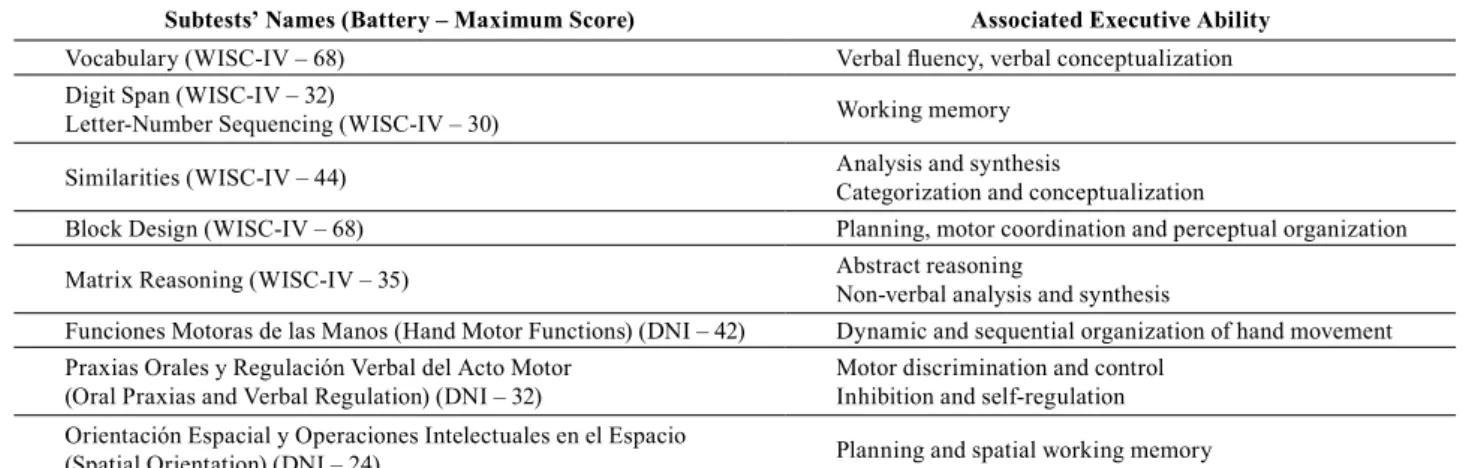
The neuropsychological assessment made of the EFs of the children consisted of the application of a group of psychological tests validated and standardized for the Spanish population. All of them are well known and considered in the scientific literature as measures of the different cognitive processes associated with human executive functioning. Of the tests used, six belong to the Weschler Intelligence Scale
for Children (WISC-IV; Weschler, 2005) and the other three to the Luria Neuropsychological Diagnostic (DNI) (in its original version, Diagnóstico Neuropsicológico de Luria of Christensen, 1979; Manga & Ramos, 2001). Table 2 shows the names and the mental processes each sub-test assesses.
Procedure
Two public and two private schools in Bogotá, Colombia participated in this study. In each one of them, 10 girls and 10 boys with normal psychological and physical development were randomly selected. All of them were tested individually in a quiet room at their respective school, by a trained psychologist, after receiving parental approval for the child to participate in the research.
Data analysis
This study used the HJ-Biplot, as an exploratory data analysis method that looks for hidden patterns in the data matrix. The method is in some ways similar to correspondence analysis but is not restricted to frequency data. The HJ-Biplot is a joint representation, in a low dimensional vector space (usually a plane), of the rows and columns of X, using markers (points/vectors), j1, j2, … , jn for its rows and h1, h2, …, hp for its columns. The markers are obtained from the usual singular value decomposition (SVD) of the data matrix X=U∑VT, where U is the eigenvectors
of XXT, V is the eigenvectors of XTX and ∑ is a diagonal
matrix containing the singular values (i.e. the square roots of the non-zero eigenvalues of both, XXT and XTX), taking
as row markers rows of J=U∑ and as column markers rows of H=V∑, in the appropriate dimensions.
Galindo (1986) shows that it is possible, with this particular choice of markers, to jointly represent rows and columns on the same reference system, obtaining the highest quality of representation (goodness of fit).
The rules for the interpretation of the HJ-Biplot are a combination of the rules used in other multidimensional scaling techniques such as correspondence analysis, factor analysis and classical biplots:
The distances between row markers are interpreted as an inverse function of similarities, in such a way that closer markers (individuals) are more similar. This property allows for the identification of clusters of individuals with similar profiles. Any hierarchical or non-hierarchical cluster technique can be used as an aid to identify the relevant clusters.
The lengths of the column markers (vectors) approximate the standard deviation of the variables.
The cosines of the angles among the column vectors approximate the correlations among variables in such a way that small acute angles are associated with variables with high positive correlations; obtuse angles near to the straight angle are associated with variables with high negative correlations and right angles are associated with
non-correlated variables. In the same way, the cosines of the angles among the variable markers and the axes (principal components) approximate the correlations between them. For standardized data, these approximate the factor loadings in factor analysis.
The order of the orthogonal projections of the row markers (points) onto a column marker (vector) approximates the order of the row elements (values) in that column (the same property holds for the projection of column markers onto the direction defined by a row marker). The larger the projection of an individual point onto a variable vector is, the more this individual deviates from the average of that variable. For this to be correctly interpreted, the aspect ratio of the biplot graph has to be 1:1, i.e. the physical horizontal and vertical scales have to be the same.
Some additional measures can be used as an aid to the correct interpretation of the graph (Galindo & Cuadras, 1986). The actual squared correlation between a variable and a factor is interpreted as the relative contribution of the factor to the variability of the element (variable; CRFE). Because the obtained factors are uncorrelated, the variability of a variable which accounts for a plane is obtained by summing up the contributions of the axis that form the plane and then the resulting quantity is termed ‘quality of representation’ (QLR). Only variables with high QLRs should be interpreted for any particular plane.
An analogous measure of the QLR can be obtained for each individual. We considered that an individual child was well represented when most of their information (measured through the variability) was accounted for in the reduced dimension. Because the representation is centered at the origin, the variability of each individual is measured by its squared distance to the center, so that the quality of representation can be measured by the ratio between the squared distance in the reduced dimension and the squared distance in the complete space. Geometrically, it is the squared cosine of the angle between the vector in the complete space and its projection onto the representation plane. HJ-Biplot graphics were calculated with the MULTIPLOT program (Villardón, 2007).
Table 2. Subtest’s names and their associated executive ability
Subtests’ Names (Battery – Maximum Score) Associated Executive Ability
Vocabulary (WISC-IV – 68) Verbal fluency, verbal conceptualization Digit Span (WISC-IV – 32)
Letter-Number Sequencing (WISC-IV – 30) Working memory
Similarities (WISC-IV – 44) Analysis and synthesis
Categorization and conceptualization
Block Design (WISC-IV – 68) Planning, motor coordination and perceptual organization
Matrix Reasoning (WISC-IV – 35) Abstract reasoning
Non-verbal analysis and synthesis
Funciones Motoras de las Manos (Hand Motor Functions) (DNI – 42) Dynamic and sequential organization of hand movement
Praxias Orales y Regulación Verbal del Acto Motor
(Oral Praxias and Verbal Regulation) (DNI – 32) Motor discrimination and controlInhibition and self-regulation
Orientación Espacial y Operaciones Intelectuales en el Espacio
RESULTS
Nowadays, when research is directed towards investigating children’s executive functioning and the effects and interactions with their personal variables, the analysis of variance is the first statistical aid to manage this type of data. The study presented here aimed to analyze the executive functioning of 80 Colombian children, using nine different psychological tests, by their sex, type of school and socioeconomic status. The conventional analysis of this multiple variables would require 27 one-way ANOVAs, three for each psychological test and nine post-hoc contrasts to determine the possible differences as a result of the children’s socioeconomic status. Correlation procedures would be used to determine the relationship between the psychometric measures of EFs. An alternative to analyze the relationship between the multiple variables of interest to this study, all at once, is the use of the HJ-Biplot analysis. This is exactly what the main goal of this study was.
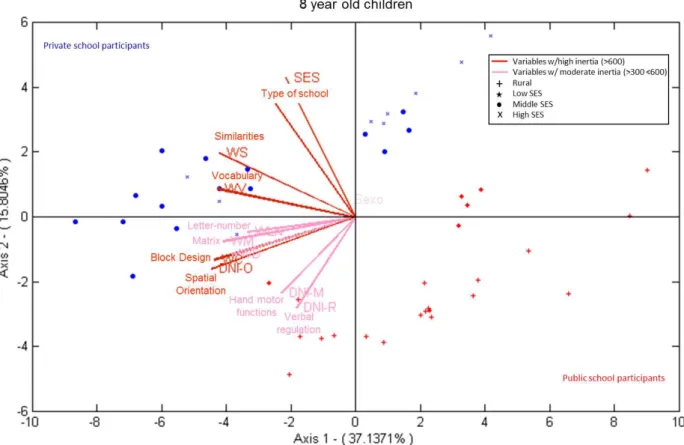
On the whole, the HJ-Biplot analysis showed four psychological tests, the Similarities, Vocabulary, and Block Design WISC-IV subtests, and the Spatial Orientation DNI subtest, to be the most important in explaining the main factor plane of the biplot, which explains 52.94% of the total inertia of the relationships between the sex, type of school, socio-economic status, and performance on each EFs test applied. These four variables, representing measures of verbal fluency and non-verbal planning EFs,
were the most important in predicting the children’s overall EFs performance. Meanwhile, its three main factor planes explained 65.24% of the total inertia of the original variables.
Figure 1 shows the HJ-Biplot graphic, which visually represents the obtained data. The vectors account for the psychological measures of EFs used in this study as well as the socio-demographic variables of the participants (sex, socio-economic status, and type of school). Blue figures represent children that attend private schools and red figures public schools: crosses represent rural children, stars low socio-economic children, dots middle class, and equis high socio-economic status children. Figure 1 also shows that the second axis of the main factor plane is defined by two identification variables, type of school and socio-economic status of the participants, suggesting the influence of personal variables on the children’s EFs profiles.
A closer look at Figure 1 highlights how the different psychological tests applied are grouped into three clusters. The first cluster is formed of the Vocabulary and Similarities WISC-IV subtests, which are measures of verbal conceptualization and fluency, and the second is composed of the Letter – Number Sequencing, Digit Span, Block Design, and Matrix Reasoning WISC-IV subtests, and the Spatial Orientation DNI subtest, all of them being measures associated with verbal and non-verbal working memory capabilities. The third cluster is formed of the Hand
Motor Functions, Oral Praxias, and Verbal Regulation DNI subtests, related to the evaluation of verbal inhibition and self-regulation. Furthermore, each one of these clusters measures the same EFs aspect, meaning that the score a child obtains on one of them allows the prediction of the child’s performance on the other subtests grouped in the same cluster.
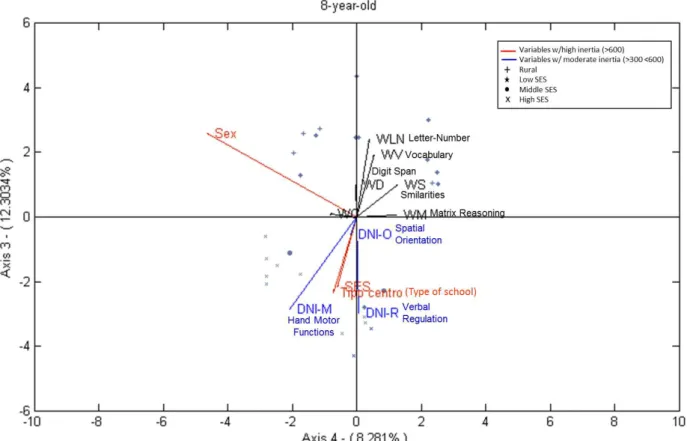
Moreover, children from private schools, especially children from middle socio-economic status backgrounds, performed better in EFs tasks than did children from public schools and low socio-economic status backgrounds. Meanwhile, high socio-economic status children obtained
the best performances on the Hand Motor Functions, Oral Praxias, and Verbal Regulation DNI subtests, as shown in Figure 2.
Both results suggest that the level of Colombian 8-year-old children’s EFs may depend on the learning opportunities and appropriation of their executive skills offered them by their socio-economic statuses and type of school they attend.
On the other hand, type of school and socio-economic status highly correlated, and both of them are independent of school grade, meaning that the first two socio-demographic variables may establish differences in the profiles of peers.
Figure 2. Graphical representation of the HJ-Biplot 3-4 plane calculated with the participants data.
DISCUSSION
The HJ-Biplot analysis allowed us to examine simultaneously multiple variables, especially the co-variation structure between the EFs tasks and the children’s personal variables. In this sense, this statistical method was shown to be useful to evaluate the Colombian children’s executive processes and to investigate the effects by type of school, and socio-economic status. There were further savings in time and statistical calculations, for example, one of the analysis’ major advantages is the representation of the results in a graphic favoring the comprehension of the existing relationships between the multiple data analyzed.
the executive processes of planning, non-verbal working memory and verbal fluency.
Even more, this same graphic showed some differences in the performance of executive tasks by the type of school and socio-economic backgrounds of the children. It was found that private school, middle and high socio-economic status children presented better executive functioning skills than public, low socio-economic status children, especially in the WISC-IV tests. This result was expected, since in Colombia, learning opportunities are associated with social and economic levels.
This type of analysis may be done at a group and individual level, since the HJ-Biplot graphic represents the totality of the participants. In other words, it is possible to identify immediately how a certain group of children, either by their type of school or socio-economic status, perform in the different EFs tasks, as well as how a particular child performs executively and with respect to their peers.
On the other hand, HJ-Biplot analysis showed that the tests of each separate psychological battery tended to group, pointing out that the Weschler Scale and the Luria Initial battery assess different aspects of the executive functioning of children. The subtests of the same battery tended to group in clusters, each one evaluating the same aspect of EFs. According to previous studies (Cadavid-Ruiz & Del-Río, 2012), WISC-IV test performance depends on the knowledge transmitted in the school context while the DNI test content depends primarily on experiences of informal non-verbal learning.
Overall, HJ-Biplot analysis provided a percentage of the capability of the psychological tests applied to explain the total inertia of the overall data. In the present study, an acceptable 65.24% was obtained. Future research should focus on proving the capability of other psychological measures of explaining the EFs construct, as well as the comparison of EFs performance across different ages.
REFERENCES
Anderson, P. J., & Doyle, L. W. (2004). Executive functioning in school-aged children who were born very preterm or with extremely low birth weight in the 1990s. Pediatrics, 114(1), 50-57.
Anderson, V. A. (2001). Assessing executive functions in children:
Biological, psychological, and developmental considerations. Pediatric Rehabilitation, 4(3), 119-136.
Anderson, V. A., Anderson, P., Northam, E., Jacobs, R., &
Catroppa, C. (2001). Development of executive functions through late childhood and adolescence in an Australian sample. Developmental Neuropsychology, 20(1), 385-406. doi: 10.1207/S15326942DN2001_5
Ardestani, A., Shen, W., Darvas, F., Toga, A. W., & Fuster, J. M. (2016). Modulation of frontoparietal neurovascular dynamics in working memory. Journal of Cognitive Neuroscience, 28(3), 379-401. doi: 10.1162/jocn_a_00903.
Ardila, A., Rosselli, M., Matute, E., & Guajardo, S. (2005). The influence of the parents’ educational level on the development
of executive functions. Developmental Neuropsychology, 28(1), 539-560.
Barkley, R. A. (2001). The executive functions and self-regulation: An evolutionary neuropsychological perspective. Neuropsychology Review, 11(1), 1-29.
Barrasso-Catanzaro, C. & Eslinger, P. J. (2016). Neurobiological bases of executive function and social-emotional development: Typical and atypical brain changes. Family Relations, 65, 108-119. doi:10.1111/fare.12175
Biederman, J., Monuteaux, M. C., Doyle, A. E., Seidman, L. J.,
Wilens, T. E., Ferrero, F., ... Faraone, S. V. (2004). Impact of executive function deficits and attention-deficit/hyperactivity
disorder (ADHD) on academic outcomes in children. Journal of Consulting & Clinical Psychology, 72(5), 757-766. doi: 10.1037/0022-006X.72.5.757
Bodrova, E., Leong, D. J., & Akhutina, T. V. (2011). When everything new is well-forgotten old: Vygotsky/Luria insights
in the development of executive functions. New Directions for Child and Adolescent Development, 133, 11-28. doi:10.1002/ cd.301
Borkowski, J. G., & Burke, J. E. (1996). Theories, models, and
measurements of executive functioning: An information
processing perspective. In G. R. Lyon & N. A. Krasnegor (Eds.),
Attention, memory, and executive function (pp. 235-261). Baltimore: Paul H Brookes Publishing.
Cadavid-Ruiz, N., & Del-Río, P. (2012). Memoria de trabajo
verbal y su relación con variables socio-demográficas en niños
colombianos. Acta Colombiana de Psicología, 15(1), 99-109. Carlson, S. M., Mandell, D. J., & Williams, L. (2004). Executive
function and theory of mind: Stability and prediction from ages 2 to 3. Developmental Psychology, 40(6), 1105-1122. doi: 10.1037/0012-1649.40.6.1105
Christensen, A.-L. (1979). El diagnóstico neuropsicológico de Luria: Texto. Madrid: Hijos de E. Minuesa.
Demey, J. R., Vicente-Villardón, J. L., Galindo-Villardón, M. P.,
& Zambrano, A. Y. (2008). Identifying molecular markers
associated with classification of genotypes by external logistic
biplots. Bioinformatics, 24(24), 2832-2838. doi: 10.1093/ bioinformatics/btn552
Espy, K. A., McDiarmid, M. M., Cwik, M. F., Stalets, M. M., Hamby, A., & Stern, T. E. (2004). The contribution of executive functions to emergent mathematic skills in preschool children. Developmental Neuropsychology, 26(1), 465-486.
Fernández-Duque, D., Baird, J. A., & Posner, M. I. (2000). Executive attention and metacognitive regulation. Consciousness & Cognition, 9(2 Pt 1), 288-307. doi: 10.1006/ccog.2000.0447 Friedman, N. P., & Miyake, A. (2017). Unity and diversity of
executive functions: Individual differences as a window on cognitive structure. Cortex, 1-19. doi: 10.1016/j. cortex.2016.04.023
Fuster, J. M. (2015). Overview of prefrontal functions: E Pluribus Unum - Coordinating new sequences of purposeful action. In The Prefrontal Cortex (5th. ed.), 375-425. doi: 10.1016/B978-0-12-407815-4.00008-8
Gabriel, K. R. & Odoroff, C. L. (1990). Biplots in biomedical
research. Statistics in Medicine, 9(5), 469-485.
Galindo, M. P. (1986). Una alternativa de representación simultánea:
HJ-Biplot. Questíio, 10(1), 13-23.
Galindo, M. P., & Cuadras, C. M. (1986). Una extensión del método biplot y su relación con otras técnicas. Publicaciones de Bioestadística y Biomatemática (Universidad de Barcelona), 17.
García-Barrera, M. A., Karr, J. E., & Kamphaus, R. W. (2013).
functioning: Assessing factorial invariance and exploring latent growth. Psychological Assessment, 25(4), 1300-1313. doi. 10.1037/a0034046.
Hothersall, D. (2005). Historia de la psicología. Madrid: McGraw-Hill.
Klenberg, L., Korkman, M., & Lahti-Nuuttila, P. (2001). Differential
development of attention and executive functions in 3- to 12-year-old Finnish children. Developmental Neuropsychology, 20(1), 407-428. doi: 10.1207/S15326942DN2001_6
Lee, K., Bull, R. & Ho, R. M. H. (2013). Developmental changes in executive functioning. Child Development, 84(6), 1933–1953. doi: 10.1111/cdev.12096
Lezak, M. D. (1995). Neuropsychological assessment. New York: Oxford University Press.
Manga, D., & Ramos, F. (2001). Batería Luria-DNA: Diagnóstico neuropsicológico de adultos. Madrid: TEA.
Martín-Rodríguez, J., Galindo-Villardón, M. P., & Vicente-Villardón, J. L. (2002). Comparison and integration of
subspaces from a biplot perspective. Journal of Statistical Planning and Inference, 102(2), 411-423.
Miller, M. R., Giesbrecht, G. F., Müller, U., McInerney, R. J. &
Kerns, K. A. (2012). A latent variable approach to determining the structure of executive function in preschool children. Journal of Cognition and Development, 13(3), 395-423. doi: 10.1080/15248372.2011.585478
Shayer, B., Carvalho, C., Mota, M., Argollo, N., Abreu, N. & Bueno, O. F. A. (2015). Desempenho de escolares em atenção e funções executivas no Nepsy e inteligência. Psicologia: Teoria e Prática, 17(1), 120-135.
Strauss, J. S. M. D., Gabriel, K. R., Kokes, R. F., Ritzler, B. A., VanOrd, A. M. A., & Tarana, E. (1979). Do psychiatric patients fit their diagnoses? Patterns of symptomatology as described
with the biplot. Journal of Nervous & Mental Disease, 167(2), 105-113.
Villardón, J. L. (2007). Programa MULTIBIPLOT (Version alpha
2.1). Salamanca: Departamento de Estadística, Universidad de Salamanca.
Wechsler, D. (2005). WISC-IV Escala de inteligencia de Wechsler para niños-IV. Adaptación española. Madrid: TEA.