Estimation of Kinetic Parameters During the Treatment of Steelmaking
Slag Expansibility Data
Tamires Cristina Costaa*, Alex Vazzolera, Wilton Pacheco de Araújoa, Edelize Angélica Gomesa
Received: July 19, 2017; Revised: November 01, 2017; Accepted: November 10, 2017
Steelmaking slag (SS) is one of the largest generation waste in the integrated and semi-integrated plants, but it has application restrictions due to its high expansibility. To overcome these constraints, this research had as its main objective the reactions is kinetics parameters estimation that result in the expansion of SS using the Arrhenius global equation. It was obtained 12.5 kJ/mol for activation energy and 260.42% for the pre-exponential factor. It was also noted that the temperature significantly impacts the final expansion values, increasing them exponentially. Furthermore the time of expansion of the slag obey an asymptotic equation (Exp = a - b.ct) whose results presented initially having a large expansion velocity, which tends to zero at times very long when the material has stabilized.
Keywords: Steelmaking slag, activation energy, Arrhenius, expandability slag.
*e-mail: [email protected]
1. Introduction
The slags are synthetic rocks resulting from inclusions and non-metallic additions in steelmaking processes to promote the congregation of undesirable elements1.
According to Costa et al.2 during the steel's manufacture the slag is the largest generation waste. They are constituted mainly of oxides of calcium (CaO), magnesium (MgO), silicon (SiO2), aluminum (Al2O3) and in smaller quantities of iron (FeO), manganese (MnO), also containing other elements such as sulfur3,4.
The proportion of the oxides used in the manufacturing process varies according to the chemical composition of the raw material, the type of process and the type of steel5. According
to its specifications, it is possible to cite two main types of slag generated by steel mills: blast furnace slag (resulting from ore reduction) and slag from steel mill (Steelmaking Slag - SS - resulting from the refining process). Both slags are generated from distinct processes and, therefore, have different applications. Blast furnace slag is used mainly as an aggregate in the manufacture of cement, bricks and ceramics6,7. Nonetheless, SS has uses in paving, soil correctives and cement manufacture due to some of the main components, such as calcium and magnesium oxides, metallic iron, silicates, as well as several others. Other compounds in smaller quantities undergo chemical transformations in the presence of moisture and cause their volumetric expansion6,8-11.
Due to its expansive nature and the lack of technical criteria to determine its stabilization, as well as its use without the correct evaluation of the expandability2,12, SS has obtained performance problems like cracks in the asphalt layer, which contribute to the increase of discrimination
and mistrust in its use in road paving13. Consequently, for a better market is acceptance it is of the utmost importance to define a period of volumetric stabilization, called aged slag curing, is required, which varies according to temperature and humidity.
To express the expansion capacity, the time and temperature of the test are extremely important factors in the most applied methods. In Brazil, one of the methods that can be used is the DNIT ME 113/0914 test. This test was adapted by the Department of Transportation of the state of Minas Gerais (DER/MG) of the expansion test PTM 130/7815, of the Department of Transportation of Pennsylvania, USA, and adopted in this research.
According to this test, with the time and the test temperatures for a slag with pre-established particle size and humidity, a model can be obtained to estimate its maximum expansion in a short period of time, without waiting years in a practical test.
The work's scope is characterize physically, chemically and microstructurally the SS to estimate the global kinetic parameters of the reactions that result in the expansion of the SS using the Arrhenius equation and to obtain a mathematical model/expression that estimates the expansion of the slag as a function of time.
2. Experimental
The SS used in this study was generated by a steel industry in the state of São Paulo/Brazil. The material was prepared, characterized and submitted to the expansion test by the method adapted from DNIT 113/200914, according to the following experimental procedure. All assays were performed in triplicate.
2.1. Material preparation
After the SS had undergone a metallic recovery, crushing and sieving to obtain granulometry in the range of 0 to 19 mm, approximately 50 kg of the slag yard was collected. This sample will be referenced as lot 01. As the quantity of lot 01 was very large, a representative part of that quantity was prepared, by reduced sample, subjecting it to the characterizations presented in Figure 1, as well as the test of expandability, according to the standard adopted in this work.
The sample from lot 01 was ground in a Retsch/Germany ring vibrating mill, model RS200, suitable for efficient grinding of medium hardness materials. For the chemical and physical characterization, part of the sample was submitted to the new milling, to increase its reaction area. After milling, the sample was penciled in a No. 200 sieve (Tyler series) to ensure particle size less than 0.075 mm and subjected to the tests. The passing fraction in the No. 200 sieve (0.075 mm), during this work, will be mentioned as lot 02.
The separate sample for the evaluation of the expansion was initially sieved and quarteted, taking advantage of the passing fraction in the No. 32 (0.500 mm) sieve and retained in the No. 150 (0.105 mm) sieve (Tyler Series). This fraction in the course of this work will be mentioned as lot 03.
2.2. Material characterization
The actual density of the SS was measured by the Quantachrome Instruments automatic helium pycnometer model Ultrapyc 1200e after removing any residual water
Figure 1. Experimental development flowchart
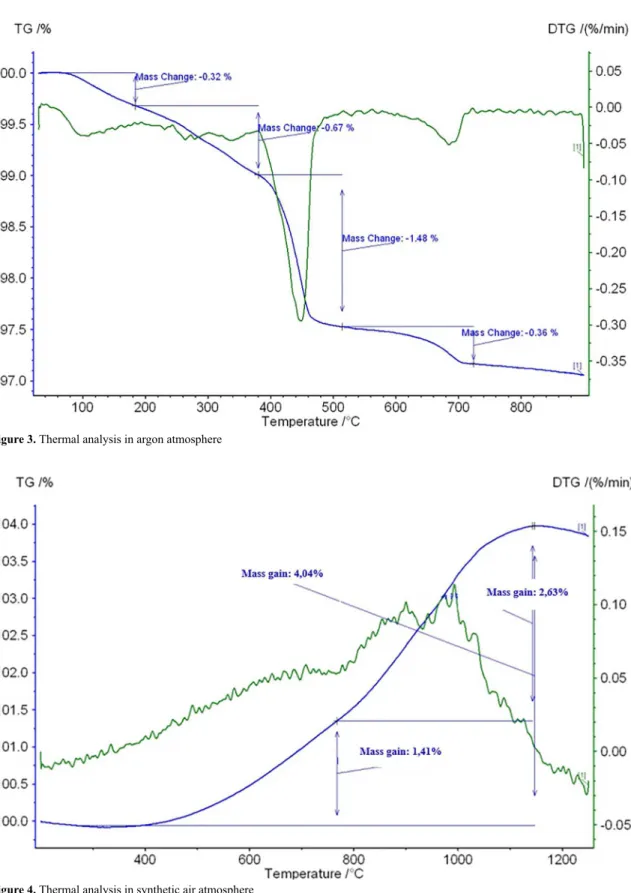
from the sample. The nitrogen's fission, using BET isotherm (NOVA 1200e, Quantachrome Instruments), and the air permeability specific surface estimation through Blaine's method (PC Blaine Star, ZEB), were used to determine the specific surface area. Thermal analysis of the material was performed using thermogravimetric (TGA) and derivative thermogravimetric (DTA) techniques. The equipment used was the Netzsch STA 449 F3 Jupiter thermobalance, under argon atmosphere and synthetic air, with flow rate of 100 cm3 min-1, the heating rate of 283 K min-1 of temperature, for argon from 323 to 1173 K and for synthetic air from 473 to 1523 K, with a mass spectrometer as detector of the gases released in the reactions.
To analyze the free lime content (CaO), the ethylene glycol method was used, according to NBR 722716, by neutralization titrations. Quantitative and semi-quantitative X-ray fluorescence analyzes were performed using a WXRF S8 Tiger Spectrometer (Bruker). The X-ray diffraction model D8 Advance (Bruker) was used to determine the crystalline phases present in the SS structure.
2.3. Kinetics
2.3.1 Expansion evaluation
The test method adopted in this research followed the experimental procedure of the norm of DNIT 113/2009 - ME14, varying only the temperature of the test between 324 and 364 K to determine the kinetic constants and to develop a representative mathematical model for the expansion.
This method consists in the immersion of cylindrical specimens (Figure 2) compacted in the normal Proctor energy in a thermal bath with water at a given temperature for a period of 7 days being made daily readings of the volumetric variation as a function of the increase of height of the body of proof. Then, the specimens are removed from the thermal bath and taken to an electric oven at the same temperature. The test method establishes that the specimen must be kept in the condition of "saturation" (not submerged) for another seven days, with the daily readings of the expansion being carried out for an equal period.
The percentage of total volumetric expansion is that obtained after 14 days and is set at 3% for cumulative expansion at the end of the test. To calculate it, equation 1 is used.
(1)
Whose variables, Li e Lf are the mean of the initial and
final readings respectively and L0 is the initial height of the sample, in millimeters. The expansion daily percentage calculation is obtained by dividing the difference between the daily readings performed and the initial measures of the each test piece.
2.3.2. Data processing and estimation of kinetic parameters of expansion
In order to obtain a mathematical representation of the data acquired during the expansion, used the programs Mathcad 6.0 and Origin © 7.5 SR4 for the reducing the errors and obtaining a mathematical model.
The kinetic scheme parameters determination used the Arrhenius empirical model. After expandability evaluation, the maximum expansion of each temperature within the same time interval was considered.
Now that it is possible to estimate kinetic scheme activation energy along with the pre-exponential factor through a linear regression of the experimental data. By applying the logarithm in the Arrhenius equation 2 we obtain a line, by the graph of ln (k) versus T1, whose angular coefficient is
R
Ea and linear is k 0.
(2)
3. Results and Discussions
3.1 Physical description
3.1.1. Density
The density for the fraction corresponding to lot 03 was 3.27 g cm-3. It is observed that the SS has a real specific gravity close to the natural aggregates that vary from 2.0 to 3.0 g cm-317.
The determined result is consistent with the results found by Maruthachalam and Palanisamy18, Machado10 and Rohde19, ranging from 3.35 to 3.51 g cm-3. Both authors allege that the high value found for this material is a consequence of the high metallic iron content present in its composition.
3.1.2 Specific surface area
To evaluate the surface area of the sample, two different methods were used. The BET method yielded 5.56 m² g-1 and
the Blaine method, 0.1593 m² g-1. According to Garcia20, these
results show that lot 03 is composed of fine materials, which is one of the factors governing the rate of hydration reaction.
In addition, there is a large difference in the values determined for the SS surface area. This observed difference is due to the way the specific surface area is determined. The BET technique tends to provide a higher value in comparison to the Blaine technique, since the condensed nitrogen molecules adsorb in the pores and micropores of the particles, that is, the given value is the specific surface area21, already in Blaine the value provided is from the accessible area for reaction.
3.2. Chemical characterization
3.2.1 Thermal analysis (TGA/DTA)
Thermogravimetric analysis (TGA) and its derivative (DTA) were used as an auxiliary technique to identify and quantify the compounds present in the sample of lot 02. The strategy is to generate complementary and some redundant information to check the chemical composition of the sample.
%
Exp
(
L
L
L
)
*
100
o
f i
=
-Figure 2. Mini-proctor tailored for expansion analysis
.
/
k
k e
EaRT
0
Table 1. X-ray Fluorescence result.
Elements %
Total iron Fet 21.94
Wüstita equivalent FeOeq 28.32
Calcium oxide CaO 29.24
Silicon dioxide SiO2 7.27
Magnesium oxide MgO 6.28
Manganese oxide MnO 3.06
Aluminum Oxide Al2O3 1.97
Phosphoric anhydride P2O5 1.05
Sulfur S 0.10
Carbon C 0.50
Titanium oxide TiO2 0.27
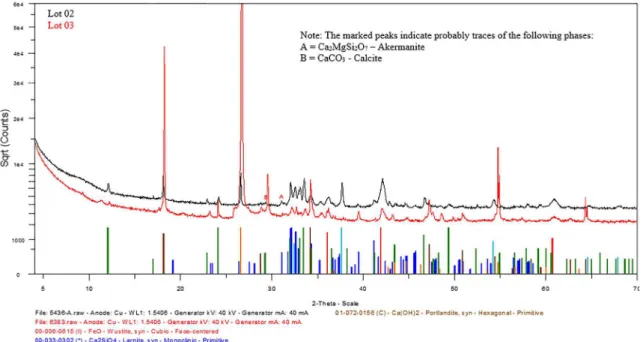
Figure 5. X-ray diffraction overlapping lot 02 and lot 03
Figure 6. Photomicrography sample lot 03
Figure 7. Average expansion (% of initial length) determined by
DNIT 113/2009 adapted method. ■ - 324 K; ● - 334 K; ▲ - 344 K; ▼ - 354 K; ◄ - 364 K
Table 2. Data for estimation of kinetic parameters
Expected temperature(K)
Measured
temperature (K) Expansion (%) Time (days) ln(k) 1/T (K
-1)
324 323.80 2.60 12.80 0.956 0.0031
334 333.30 2.65 12.80 0.975 0.0030
344 342.30 3.22 12.80 1.169 0.0029
354 352.03 3.63 12.80 1.289 0.0028
364 362.50 3.86 12.80 1.351 0.0027
Figure 8. Graph of ln (k) as a function of 1/T. ■ - 324 K; ● - 334 K; ▲ - 344 K; ▼ - 354 K; ◄ - 364 K
Table 3. Parameters adjusted for equation 2 that relates the expandability with time
Temperature
(K) a b c
324 2.439 2.357 0.690
334 2.547 2.436 0.685
344 3.041 2.991 0.579
354 3.440 3.403 0.521
364 3.698 3.679 0.330
A continuous mass loss of 373 to 673 K is observed, characteristic of silicates dehydration. Whenever slag's hydration and aging process occurs, silicates that are organized in crystalline structure such as larnite, for example (observed by X-ray diffraction), capture the water in its structure with a specific binding energy. This can be seen in the peaks formed at the temperature of 533 K and 623 K.
The carbonate is formed in the samples after CO2 capture from the atmosphere when they are subjected to a long process of exposure to the atmosphere. It is possible to observe that at a temperature of approximately 973 K there is a peak in the DTA curve which is associated with the decomposition of the carbonate (formed during exposure of the sample to the air) releasing CO2.
It is observed in the range of 293 to 1173 K the sample mass loss was 2.83%, this result is very close to the result found by Machado10, whose value is characteristic of magnesium oxide (Mg(OH)2), calcium hydroxide (Ca(OH)2) and calcium and magnesium carbonates (CaCO3 or MgCO3), indicating that the loss of mass is due to dehydration and decarbonation of these compounds.
Figure 4 shows the thermogram of the same sample (lot 02), with an oxidizing atmosphere (synthetic air), after the test of removal of water (H2O) and carbon dioxide (CO2) in an inert atmosphere. This second stage was established to evaluate the oxidation of Fe0 and FeO, obtaining additional information on the presence of oxidizable iron. Therefore, the mass gain recorded in the TGA curve comes from the
increase of oxygen incorporated to Fe0 and FeO to form the
most oxidized form of iron, Fe2O3 (hematite).
3.2.2. Chemical analysis
3.2.2.1 Ethylene glycol
A content of 5% of free calcium oxide was obtained in the slag of lot 01, this value being close to that determined by Machado10 of 4.7%. With this result, we can then consider that this slag is not cured.
3.2.2.2. Fluorescence of X-rays
The results of the quantitative chemical analyzes carried out in lot 02 are presented in Table 1. It is noted that there is a high content of calcium oxide (which is explained by the process with which this slag is generated) and iron oxide equivalent (wüstita). From these results a the high density value, and ethylene glycol test reflect the high amount of iron oxides.
3.3. Microstructural characterization
3.3.1 X-ray diffraction (XRD)
The main crystalline compounds identified in the slag were portlandite (Ca(OH)2), wüstita (FeO), larnite (2CaO. SiO4), calcium oxide (CaO), calcium carbonate (CaCO3) and carbon (C). In Fig. 5 it is possible to observe the overlapping of the difratograms of lot 02 and 03 for better visualization of the present phases.
increase of oxygen incorporated to Fe and FeO to form the most oxidized form of iron, Fe
of 4.7%. With this result, we can then consider
equivalent (wüstita). From these results a the high density value, and ethylene glycol test reflect the high amount of
3.3.1 X-ray diffraction (XRD)
The main crystalline compounds identified in the slag ), wüstita (FeO), larnite (2CaO.
carbon (C). In Fig. 5 it is possible to observe the overlapping
The basic difference of the two lots is found only in the
the smallest particle size (lot 02). This fact can be justified by the
.
Exp
= -
a
b c
tway in which the grains at the time of grinding were fragmented, where Ca(OH)2 particles war obtained with a size of less than 20 nm do not appear in XRD. Besides that, possibly, the sample of greater granulometry may have hydrated more easily and concentrated grains with higher contents of these compounds.
A high iron oxide (FeO) value is also observed in both samples, where the batch 02 sample has the highest content (20.32%). This is justified by the fact that the sample is thinner and can suffer corrosion more easily. In spite of this, the contents found for both iron and other elements are in agreement with those determined by Machado10 in their characterization.
3.3.2. Optical Microscopy
Figures 6 (a) to 6 (d) show photomicrographs of the lot 03 sample observed by optical microscopy and subjected to different magnifications (50 to 1000x). A variety of morphologies are present in the particles that are possibly produced by differences in the chemical composition and thermal history of the material. Some grains have more than one phase, this is observed due to the heterogeneity of colors in the same grain.
In Figure 6(a) it can be observed that there are blue points, supposedly corresponding to the Larnita (C2S). The fact that the sample was polished in water may have caused this compound to react to a bluish color.
In Figure 6(b), which is the same micrograph of Figure 6(a), but with polarized light, one can identify a bright rectangular compound that probably corresponds to alita (C3S).
In Figure 6(c) a rounded particle is observed, with white coloration and contoured by crystallized particles. This particle is possibly a metal, iron, and the crystallized particles that surround it probably corresponds to its oxide, FeO.
Figure 6(d) shows a longer, gold-colored particle. This particle has characteristics of graphite, visualized when there is incidence of light at different angles.
In the photomicrographs it was possible to observe the size of the phases and the structure of pores that will be responsible for the fragmentation pattern of the material during the hydration and aging process. However, in this research the compounds identified are only suggestions, and it is necessary to use complementary techniques to identify such compounds and suggested phases.
3.4 Expansibility of SS
3.4.1. Evaluation of the expandability
During the evaluation of the expansive potential of SS with different temperatures, four replicates were performed daily for the samples. Bearing the averages it was possible to calculate the expansion for each mini-proctor according to the volumetric expansion equation (equation 1), previously presented.
The assays were performed for each one at the four mini-proctors, for calculation purposes, the expansions means of each assay were calculated and presented in Figure 7.
According to Figure 7 it is possible to observe that the expansion occurs as a logarithmic curve and its value increases with test temperatures. It's also noted that the tests with a temperature of 324 K and 334 K obtained very close results, possibly this error may be linked to an error in the temperature of the test, or that the hydration of some of the oxides did not reach the activation condition.
3.5 Estimation of kinetic parameters
The activation energy and the pre-exponential factor of the Arrehnius equation were estimated from the maximum expansion (k) obtained for the various temperatures. Table 2 presents the data used for the estimation of kinetic parameters. And Figure 8 presents the result obtained from ln (k) as a function of the inverse of the temperature.
The straight line fitted to the data set of Figure 8 has an adjustment coefficient of 0.9457, obtaining as an equation
, ,
ln kQV=5 5623-1506 7$ST1X .The activation energy calculated
from this equation is 12.5 KJ mol-1. Replacing the value of the activation energy (Ea) in the Arrehnius equation, we obtain the value of the pre-exponential factor, 260.42%.
It is observed that the points referring to the expected temperatures of 61 °C and 51 °C are somewhat distant from linearization and are therefore responsible for the value of the correlation coefficient. This divergence may refer to errors in the measured water temperature.
With the values of activation energy and the pre-exponential factor determined, it is possible to estimate the maximum expansion (ln (k)) at various temperatures. It is worth mentioning that the estimation performed in this research is appropriate for the determined time of 12.8 days and for samples with characteristics that fit the specifications of lot 03, mainly with respect to granulometry.
3.6 Data processing
To better understand what happens during the expansion experiment, we tried to model the expansion curve mathematically.
An exponential asymptotic function was adopted because it seems to express well the idea of initially having a large expansion velocity, which tends to zero in very long times when the material has already stabilized. This function can be expressed by equation 3.
(3)
By the norm DNIT 11314 the experiment time is fixed
in 14 days. If the experiment were extended indefinitely the expansion would tend asymptotically to the value of a. Wherefore it will always be a little higher than the potential estimated. When the experiment time is zero (ct = 1) the b value will be close to a value. Since the expansion curve has to necessarily start from zero, which is at time zero, the expandability must be equal to zero.
The parameter c represents the function curvature measure. How much smaller the c greater the curvature. When c tends to 1, equation 3 tends to be linear at initial times and achieves the asymptote in very long times.
The parameters a, b and c are adjustment in fact a function of the temperature, because during the work, it could be observed that the expansion is directly related to the potential provided for the reaction to occur. Table 3 presents these adjustment parameters, estimated for the temperatures worked during the research.
In accordance with this information, it is believed that the slag will have a better acceptance, expansion and appreciation in the market, since the operator can predict the maximum expansion in the particular temperature and granulometry specific conditions for its volumetric stabilization and thus to overcome time and expansion indetermination problem. In addition, it will be possible to develop procedures to accelerate the curing of the slag and to guarantee the quality of the volumetric stability.
4. Conclusions
The characterization of SS proved the presence of expansion compounds (CaO and MgO). Through the static adapted measure it was possible to verify its dependence with temperature by means of Arrhenius equation.
This modeling resulted in an equation whose expansion can be described like a time function.
Finally, it is emphasized that proposed kinetic parameters estimation are restricted to SS with the granulometry and characteristics established in this research, it was necessary to correlate and extend these criteria to cover all types of slag and granulometry.
5. Acknowledgments
The steel industry for the supply of material and infrastructure and Unileste for the infrastructure for the development of this study.
6. References
1. Das B, Prakash S, Reddy PSR, Misra VN. An overview of
utilization of slag and sludge from steel industries. Resources, Conservation and Recycling. 2007;50(1):40-57. DOI: 10.1016/j. resconrec.2006.05.008
2. Costa KA, Guimarães ACR, Reis MM, Santana CSA. Study of controlled leaching process of steel slag in soxhlet extractor aiming employment in pavements. Matéria (Rio de Janeiro). 2017;22(2):e11823. DOI: 10.1590/s1517-707620170002.0155
3. Busnello EC. Avaliação do potencial de expansão da escória de aciaria estabilizada para utilização em sub-base e base de
pisos industriais de concreto. In: 58° Congresso Brasileiro do
Concreto; 2016 Oct 11-14; Belo Horizonte, MG, Brazil. p.
1-15.
4. Souza Junior DS. Estudo do comportamento de escórias de alto-forno a carvão vegetal produzidas a partir de ativação a
quente. [Dissertation]. Belo Horizonte: Federal University of
Minas Gerais; 2007.
5. Sofilic T, Mladenovic A, Sofilic U. Defining of EAF steel slag
application possibilities in asphalt mixture production. Journal
of Environmental Engineering and Landscape Management.
2011;19(2):148-157. DOI: 10.3846/16486897.2011.580910
6. Arrivabene LF, Pinto Junior LAB, Oliveira JR, Tenório JAS, Espinosa DCR. Viabilidade técnica da fabricação de cimento com mistura de escória de aciaria LD e resíduo de granito.
REM: Revista Escola de Minas. 2012;65(2):241-246. DOI: 10.1590/S0370-44672012000200013
7. Ulubeyli GC, Artir R. Sustainability for Blast Furnace Slag: Use of Some Construction Wastes. Procedia - Social and
Behavioral Sciences. 2015;195:2191-2198. DOI: 10.1016/j.
sbspro.2015.06.297
8. Gao X, Okubo M, Maruoka N, Shibata H, Ito T, Kitamura SY. Production and utilisation of iron and steelmaking slag in Japan and the application of steelmaking slag for the recovery
of paddy fields damaged by Tsunami. Mineral Processing
and Extractive Metallurgy. 2014;124(2):116-124. DOI:
10.1179/1743285514y.0000000068
9. Geyer RMT. Estudo sobre a potencialidade de uso das escórias
de aciaria como adição ao concreto. [Thesis]. Porto Alegre:
Federal University of Rio Grande do Sul; 2001.
10. Machado AT. Estudo comparativo dos métodos de ensaio para
avaliação da expansibilidade das escórias de aciaria. [Thesis].
São Paulo: University of São Paulo; 2000.
11. Raposo COL. Estudo experimental de compactação e expansão
de uma escória de aciaria LD para uso em pavimentação.
[Dissertation]. Vitória: Federal University of Espírito Santo;
2005.
12. Barbosa MCR, Justulim D, Machado IS, Machado AR. Avaliação do fenômeno físico-químico relacionado a expansibilidade da escória de aciaria para uso em pavimentação. In: 45ª Reunião
Anual de Pavimentação; 2016 Sep 20-23; Brasília, DF, Brazil.
13. Pena DC. Avaliação da Expansibilidade da Escória de Aciaria LD curada a vapor para Utilização em peças de Concreto para
Pavimentação. [Dissertation]. Vitória: Federal University of
Espírito Santo; 2004.
14. Brazil. National Department of Transport Infrastructure (DNIT). Pavimentação Rodoviária - Agregado Artificial - Avaliação do Potencial de Expansão de Escória de Aciaria - Método De
15. United States. Department of Transportation. Evaluation of Potential Expansion of Steel Slags. In: PTM 130; Pennsylvania: Department of Transportation; 2016. p. 1-8.
16. Brazilian Association of Technical Standards (ABNT). NBR NM 13 - Cimento Portland - Análise química - Determinação
de óxido de cálcio livre pelo etileno glicol. Rio de Janeiro:
ABNT; 2004. p. 1-10.
17. Mehta PK, Monteiro PJ. Concrete: Microstructure, Properties,
and Materials. New York: McGraw-Hill; 2013.
18. Verapathran M, Murti P. High performance concrete with steel slag aggregate. Gradevinar. 2014; 66(7):605-612. DOI: 10.14256/jce.1052.2014
19. Rohde L. Escória de aciaria elétrica em camadas granulares de
pavimentos - estudo laboratorial. [Dissertation]. Porto Alegre:
Federal University of Rio Grande do Sul; 2002.
20. Garcia E. Approche expérimentale et corrélations dans les systèmes complexes: Modes de broyage et réactivités du
ciment alumineux Fondu. [Thesis]. Montpellier: University
of Montpellier; 1999.
21. Gregg SJ, Sing KSW. Adsorption, Surface Area and Porosity.