ISSN 1984-3534
_____________________
*Autor para correspondência. E-mail: [email protected] DOI: 10.4322/PODes.2017.003
1Todos os autores assumem a responsabilidade pelo conteúdo do artigo.
ALTERNATIVE APPROACHES TO EVALUATE EXPERTS’
PERCEPTIONS: AN APPLICATION TO AGRICULTURE IN BRAZIL
1Geraldo da Silva e Souzaa*, Eliane Gonçalves Gomesa aSecretaria de Gestão e Desenvolvimento Institucional - SGI
Empresa Brasileira de Pesquisa Agropecuária - Embrapa, Brasília-DF, Brasil
Recebido 04/04/2016, aceito 15/02/2017
RESUMO
Os governos intervêm na agricultura por meio de políticas públicas. O objetivo deste trabalho é identificar temas críticos para as políticas públicas em termos de mercado, produção e regulação governamental. Com base em um conjunto de dez principais grupos de riscos agrícolas e as percepções de especialistas relativos tanto à importância destes temas quanto à intensidade das políticas governamentais correspondentes para aliviar os efeitos desses riscos, os temas foram classificados com o uso de métodos multicritério. De modo particular, a discussão concentra-se na lei dos julgamentos de Thurstone e no modelo analítico hierárquico de Saaty. As duas abordagens conduzem a resultados semelhantes. O item “Infraestrutura e logística” foi considerado como o mais importante para ambos os métodos a partir da perspectiva da importância do tema, e é o item menos importante do ponto de vista da intensidade das políticas públicas.
Palavras-chave: Risco, Agricultura, Percepções psicométricas, Modelo de Thurstone, AHP.
ABSTRACT
Governments intervene in agriculture via public policies. It is the objective of this work to identify critical themes for public policies in market, production, and government regulation. Thus, based on a set of ten main groups of agricultural risks and the perceptions of experts relative to both the importance of these themes and the intensity of the corresponding government policies to relieve risk effects, we rank the themes using multicriteria methods. We
particularly discuss Thurstone’s law of categorical judgments and the Saaty’s analytic hierarchy
process. The two approaches lead to similar results. Infrastructure and logistics are regarded as the most important item for both methods from the perspective of theme importance, and they are the least important from the perspective of the intensity of public policies.
19
1. IntroductionAgricultural management is subject to uncertainties of several types, for instance institutional government regulations, market uncertainties such as prices, exchange rates and international trade, climate changes, and biological factors.
Farmers face problems associated to logistics, infrastructure and transportation, which increase production costs and reduce the price received by the farmers. Moreover, financial costs resulting from high interest rates also add to production costs. Farmers also experience difficulties associated to imperfections in the institutional and legal regulations affecting the economy as a whole. Besides the market risks, farmers may face production risks. Climate and animal/plant health issues are among the factors outside producer’s control and can generate expressive losses for production.
Uncertainties should be translated into risk probabilities for proper management. It is important to classify themes according to intensity measures, taking into account the numerical probabilities of occurrence in several categories, for example very low (1), low (2), average (3), high (4), and very high (5).
In the operations research literature one notices a plethora of methods developed for the analysis of data resulting from perception evaluations of events or stimuli submitted to the consideration of a judge or a set of judges. Typical examples of these are the AHP – analytic hierarchy process (Saaty, 1990), MACBETH – Measuring Attractiveness by a Categorical Based Evaluation Technique (Bana e Costa and Vansnick, 1994), and Thurstone’s law of comparative and categorical judgments (Torgerson, 1958). See Bana e Costa et al. (2014), Souza and Gomes (2013), Canas et al. (2015), Gazzola et al. (2015, 2016), and Delbari et al. (2016), among others, for typical applications of these approaches.
With the exception of Thurstone’s laws, the methods are deterministic and do not allow
for statistical inferences and goodness-of-fit evaluations. Sufficient replication (several judges) is the key concept allowing statistical tests of Thurstone’s approaches. In this context the AHP
method can easily be adapted to produce weights comparable to Thurstone’s law of categorical
judgments.
Here we follow the AHP and the Thurstone’s law of categorical judgments approaches to analyze the categorical data provided by Gazzola et al. (2015, 2016). In this instance a set of 502 experts were invited to express their views on the importance (scale of 1 to 5) of each of 10 groups of agricultural risks regarding the dimensions of the relevance of each theme and how the government authority is acting to relieve the associated risks.
It is the objective of this work to identify critical themes for public policies in market, production, and government regulation. The risk events associated and their relative importance in the perceptions of experts are analyzed according to popular multicriteria approaches. We intend to show that they lead to similar conclusions, although based on different assumptions regarding the data generating process. The AHP is deterministic and Thurstone’s method is stochastic. Our contribution in this article is twofold. From the applied point of view, we provide a sound basis for government assessment of risk factors of importance to agriculture in Brazil. From a theoretical perspective, we provide an empirical comparison between the AHP
and the Thurstone’s law of categorical judgments when enough observations are available to
apply the latter. For small samples the AHP is indicated.
To the best of our knowledge no previous work in this respect is available in the literature. We found only one reference (Orbán-Mihálykó et al., 2015), in which the authors used a Thurstone-motivated model for ranking preferences regarding different types of lights. In order to check the rank, they performed the AHP method. The difference to our approach is that
here we deal with the Thurstone’s law of categorical judgments instead of the Thurstone’s law
20
(2016) and Schillo et al. (2017). The only use of the Thurstone’s law of categorical judgments toevaluate public policies is the proposal of Gazzola et al. (2015), but it is restricted to a linear approximation, which is generalized here.
2. Methodology
2.1 Thurstone’s Law of Categorical Judgments
Thurstone’s model was developed from psychological assumptions regarding referee
behavior when faced with stimuli and a categorical scale. It postulates a psychological continuum, as in Thurstone (1927) and Torgerson (1958). The theory is as follows, as described by Souza (2002). There are m (>2) categories and r (>1)stimuli. The psychological continuum is the real line. Each time a referee faces a stimulus, a mental discriminal process is put into
action and it generates a numerical value on the real line reflecting the stimulus’s intensity. The
stimuli translate into scale values
1,
,
r on the psychological continuum. Likewise, the categories translate into location values
1,
,
m1. The latter quantities form a partition of the real line(
, ], ( ,
1
1 2],
, (
m1,
)
.As described by Torgerson (1958), the partition relates to stimuli
S
i and categoriesC
jaccording to the following classification rule. The referee classifies stimulus
S
i into1
j
l l C if and only if
i
j. The process inherits randomness from the sampling scheme (replication ofreferees) and from the fact that, due to stochastic fluctuations, a given stimulus and category do not generate the same scale and boundary values on the psychological continuum when repeatedly evaluated by referees. Randomness leads one to assume that
i are means of randomvariables
i with variance
i2 and that
j are means of random variables
j with variances2
j
. One assumes row independence and joint normality; that is,
i are uncorrelated and( ,
i j)
are jointly normally distributed. One has primary interest in the means
i and thepairwise parametric differences
i
j. These quantities may serve the purpose of assessingstimuli intensities and differences in intensity between two stimuli.
Let
ij denote the probability of locating stimulusS
i in one of the first j categories1
,
2,
,
jC C
C
. We assume
ij
0
. We then have (1):
1 1, , 1, , 1
( )
j
i l l ij
i j
i j
i j
P S C i r j m
P
P Z
Var
(1)
Let
g
denote the probability inverse transformation. The assumption of joint normality leads to the equation (2), relating the cumulative probabilities
ij to the parameters of21
(
)
(
)
i j ij i jg
Var
(2)Suppose that enough observations are available to estimate the probabilities
ij.
In thiscontext a sample version of the law of categorical judgments is, therefore, shown in (3), where
ˆ
ij
is the relative cumulative frequency of observations in category Cj.ˆ
(
)
(
)
i j ij ij i jg
u
Var
(3)The vectors
u
i
(
u u
i1,
i2,
,
u
im1)
are independently distributed with a distinct variance matrix for each i. Clearly, we have (4), wherep
ˆ
il represents the proportion of times that the referees classify stimulusS
i intoC
l.1 2
ˆ
ijp
ˆ
ip
ˆ
ip
ˆ
ij
(4)At this level of generality, the sample model is not identifiable and further restrictions are imposed on the parameters to identify the model. Three alternatives are considered, leading to the models below, labeled by Torgerson (1958) as Models B, C, and D.
Model D:
Model D assumes
Var
(
i
j) 1
for any ( , )i j . Identifiability is obtained by imposingadditionally
1
0.
r
i i
Model B:
Model B assumes Var(
i j)
i2 0; that is, the model is heteroskedastic in stimuli(rows). Identifiability is obtained by imposing two additional conditions:
1 1 r i i r
and1 0. r i i i
Model C:Model C assumes
Var
(
i
j)
2j
0
; that is, the model is heteroskedastic incategories (columns). Identifiability is obtained by imposing 1
1
1
1
m j jm
and1 1
0.
m j j j
Models B, C, and D may be estimated by generalized least squares or maximum likelihood. For the latter the likelihood function is given by (5), where
m
i is a fixed row total,ij
y
is the frequency in cell ( , )i j , and m1 ij 1.j p
22
1 1 1
1
!
ln
ln
!
!
r i r m
ij ij
i i j
i im
m
y
p
y
y
(5)Here, for Model B we have (6):
1
1 1 1 1
1
,
2,
,
1
j i j i
i
i ij
i i i
p
g
p
g
g
j
m
(6)For Model C we have (7):
1
1 1 1 1
1
1 1
,
j i j i2,
,
1
i
i ij
j j
p
g
p
g
g
j
m
(7)For Model D we have (8):
1 1 1
1 1 , 1 2, , 1
i i ij j i j i
p g
p g
g
j m (8)All that is needed for inferences regarding the stimuli are the estimates of
i. Any monotonic transformation of these quantities will lead to the same ranking of the stimuli and the same pairwise comparisons. Souza (2002) suggests the ratio (9) as a measure of relative intensity for stimulus i. This definition relies on the assumption of a lognormal distribution on the psychological continuum and can be easily derived for Model D. This approach makes theresults comparable to the AHP’s outcomes. The other models lead to odds ratios dependent on
nuisance parameters.
1
exp( )
exp(
)
i
i r
w
(9)2.2 Analytic Hierarchy Process
As an alternative to the hierarchy induced by the law of categorical judgments, one may use the analytic hierarchy process (AHP). See Saaty (1990). The idea follows.
Let
S S1, 2,...,Sr
be the sequence of stimuli for which one wants to assign the sequence of weights
w w
1,
2,...,
w
r
reflecting stimuli intensities. A judge manifests his perception on therelative importance of stimulus
S
i relative to stimulusS
on a given numerical scale using thepositive constant
a
i. LetA
(
a
i)
be the evaluation matrix of order r. We assume:1. If
a
i
, thena
i
1.23
12 1
12 2
1 2
1
1
1
1
1
1
r
r
r r
a
a
a
a
A
a
a
(10)
As shown by Saaty (1990), the problem of the determination of weights is solved by looking for the eigenvector x (sum normalized) corresponding to the maximum eigenvalue. Assume that ai p pi , where p are positive numbers reflecting the perception of importance of the stimulus S in the judge’s concept. In this instance the largest eigenvalue of
(
i)
A
a
is r and the corresponding eigenvector is the first column sum normalized.The importance scale suggested by Saaty (1990) for pairwise evaluation (p’s) is: 1 –
equal importance, 3 – moderate importance, 5 – strong importance, 7 – very strong importance, and 9 – extreme importance. We notice that this scale can be obtained from the scale 1, 2, 3, 4, and 5 through the transformation 2p1.
The perception of several experts can be pooled into a reciprocal evaluation matrix using the geometric average of the individual perceptions.
3. Data
The application carried out here is derived from the study by Gazzola et al. (2015). As a result of a 2014 workshop, which took place at the headquarters of the Brazilian Agricultural Research Corporation (Embrapa), 10 critical areas were very important for public policies regarding the Brazilian agricultural sector: 1. extreme weather events and fire; 2. animal health; 3. plant health; 4. production management; 5. natural resources management; 6. market/commercialization; 7. credit; 8. international trade; 9. regulatory framework and interest conflict; and 10. infrastructure and logistics.
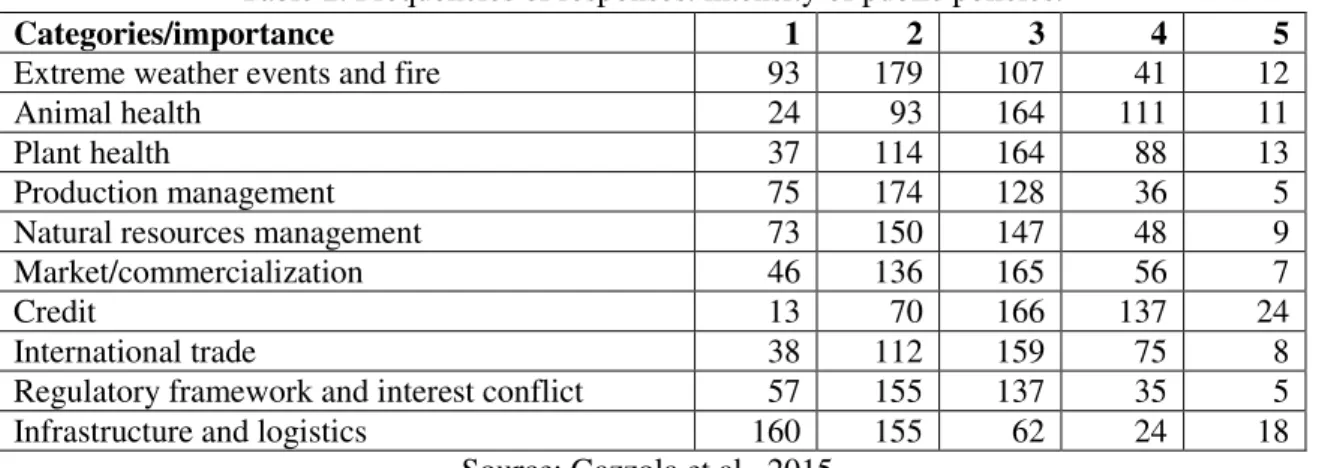
These areas were evaluated by 502 experts on the scale 1–5, where 1 represents the least intense perception of importance and 5 the most intense. The experts were asked 2 questions: the importance of the area and the intensity of public (government) policies handling each subject. Tables 1 and 2 show the response frequencies in each case. For example, in Table 1 six
experts classified the item “Extreme weather events and fire” as of the least importance. Similar
interpretation applies to Table 2.
Table 1. Frequencies of responses: area importance.
Source: Gazzola et al., 2015.
Categories/importance 1 2 3 4 5
Extreme weather events and fire 6 26 70 169 162
Animal health 3 15 39 160 204
Plant health 2 15 33 178 198
Production management 4 31 104 165 124
Natural resources management 6 21 69 158 173
Market/commercialization 8 21 93 182 118
Credit 2 22 86 185 127
International trade 6 21 96 172 119
Regulatory framework and interest conflict 7 22 116 140 123
24
Table 2. Frequencies of responses: intensity of public policies.Source: Gazzola et al., 2015.
4. Estimation Results
We estimated Thurstone’s Models B, C, and D by maximum likelihood. The parameters
were first estimated by generalized least squares (Souza, 2002), and the resulting estimates were used as initial values in the maximum likelihood routine. We used PROC NLMIXED (SAS Institute Inc., 2015) to fit the models. Table 3 shows the goodness-of-fit statistics for Models B, C, and D.
Table 3. Goodness-of-fit statistics for maximum likelihood and generalized least squares. AIC is the Akaike Information Criterion, BIC is the Bayesian Information Criterion, MSE is the Mean
Square Error and R2 is the square of the correlation between observed and predicted values.
Perspective Model -2 log likelihood AIC BIC MSE R2
Area importance
B 10,088 11,144 10,139 1.568 0.982
C 10,090 10,122 10,126 1.349 0.982
D 10,138 10,164 10,168 1.947 0.957
Intensity of public policies
B 11,010 11,054 11,061 3.330 0.952
C 11,005 11,037 11,042 2.449 0.971
D 11,083 11,109 11,113 2.762 0.950
Source: Prepared by the authors.
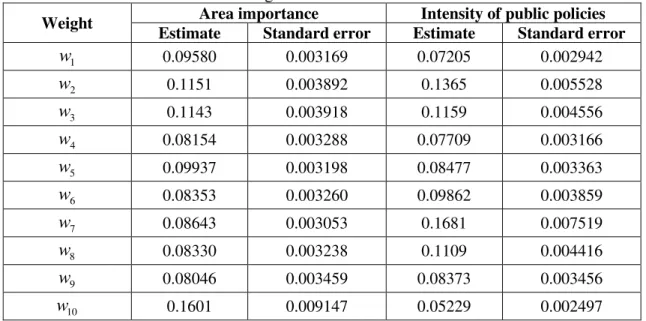
We see from Table 3 that all the models are approximately equivalent regarding the fit. Model C is slightly better for both perspectives. Table 4 shows the parameter estimates for Model C and Table 5 the weights indicating the relative importance of each area, computed with the parameters estimates of
( ,
1,
10)
in Table 4.For the area importance, based on the weights shown in Table 5, the stimuli rank order is 10 (infrastructure and logistics), 2 (animal health), 3 (plant health), 5 (natural resources management), 1 (extreme weather events and fire), 7 (credit), 6 (market/commercialization), 8 (international trade), 4 (production management), and 9 (regulatory framework and interest conflict). The pairwise nonsignificant effects are 1 and 5, 2 and 3, 4 and 6, 4 and 7, 4 and 8, 4 and 9, 6 and 7, 6 and 8, 6 and 9, 7 and 8, 7 and 9, and 8 and 9. Any other comparison is statistically significant (p-value <= 0.05).
For the intensity of public policies the rank order is 7, 2, 3, 8, 6, 5, 9, 4, 1, and 10 (see table 5). The pairwise nonsignificant effects are 1 and 4, 3 and 8, 4 and 5, 4 and 9, 5 and 9, and 6 and 8. Any other pairwise comparison is statistically significant (p-value <= 0.05).
The AHP estimation is derived from Tables 1 and 2 considering the scale transformation to 1, 3, 5, 7, 9. We illustrate the computations for Table 1. Firstly, one computes the vector of geometric means: (6.738 7.334 7.372 6.407 6.851 6.443 6.683 6.481 6.340 7.859). Notice that in this context, for example: 6.738exp
6ln
126ln
3 70ln
5 169ln
7 162ln
9
433
.Categories/importance 1 2 3 4 5
Extreme weather events and fire 93 179 107 41 12
Animal health 24 93 164 111 11
Plant health 37 114 164 88 13
Production management 75 174 128 36 5
Natural resources management 73 150 147 48 9
Market/commercialization 46 136 165 56 7
Credit 13 70 166 137 24
International trade 38 112 159 75 8
Regulatory framework and interest conflict 57 155 137 35 5
25
The final weights are obtained from the vector above, normalizing by this quantity and adjusting for unit sum.Table 4. Parameter estimation for Thurstone’s Model C.
Parameter Area importance Intensity of public policies Estimate Standard error Estimate Standard error
1 1.0589 0.03840 -0.6930 0.04265
2 1.2426 0.04419 -0.05403 0.04630
3 1.2355 0.04464 -0.2172 0.04370
4 0.8977 0.04159 -0.6253 0.04320
5 1.0955 0.03859 -0.5304 0.04201
6 0.9218 0.04116 -0.3791 0.04258
7 0.9560 0.03904 0.1544 0.05249
8 0.9191 0.04104 -0.2618 0.04403
9 0.8844 0.04367 -0.5427 0.04401
10 1.5727 0.06967 -1.0134 0.04872
1
-2.1397 0.2705 -1.6831 0.040692
-0.8494 0.1137 -0.6475 0.032253
0.8973 0.1391 0.4996 0.028384
2.09180 0.19126 1.8310 0.05641 1
0.1108 0.2462 1.3234 0.07531
1 2
0.6693 0.1046 1.3747 0.06217
1 3
1.5450 0.1265 1.0591 0.05333
1 4
1.67485 0.1786 0.2429 0.1061
Source: Prepared by the authors.
Table 5. Weights for Thurstone’s Model C.
Weight Area importance Intensity of public policies Estimate Standard error Estimate Standard error
1
w
0.09580 0.003169 0.07205 0.0029422
w
0.1151 0.003892 0.1365 0.0055283
w
0.1143 0.003918 0.1159 0.0045564
w
0.08154 0.003288 0.07709 0.0031665
w
0.09937 0.003198 0.08477 0.0033636
w
0.08353 0.003260 0.09862 0.0038597
w
0.08643 0.003053 0.1681 0.0075198
w
0.08330 0.003238 0.1109 0.0044169
w
0.08046 0.003459 0.08373 0.00345610
w
0.1601 0.009147 0.05229 0.002497Source: Prepared by the authors.
26
followed by the group 5, 1, 7 and the group 8, 6, 4, 9. For the intensity of public policies, stimulus 7 is the most intense, followed by 2, the group 3, 8, stimulus 6, the group 9, 5, 4, stimulus 1, and stimulus 10.Table 6. AHP weights.
Weights Area importance Intensity of public policies
1
w
0.098347 0.0821632
w
0.107047 0.1231713
w
0.107607 0.1127304
w
0.093523 0.0858995
w
0.099998 0.0913046
w
0.094046 0.1019587
w
0.097552 0.1379898
w
0.094609 0.1091799
w
0.092549 0.09156410
w
0.114722 0.064043Source: Prepared by the authors.
More informative statistically regarding the two methods (Thurstone’s Model C and the
AHP) and the two perspectives (area importance and intensity of public policies) is Table 7, showing the pairwise rank correlations between all the derived classifications. We see from Table 7 that the rank correlations between perspectives for both methods are low and do not differ significantly from zero. The conclusion is that experts perceive government policies as not aligned with their perceptions about the real importance of the subjects. Infrastructure and logistics, for example, are regarded as the most important item for both methods from the perspective of area importance and the least important from the perspective of the intensity of public policies. Although it is hard to separate effects with the AHP method, the ranks are
highly correlated with Thurstone’s classification from both perspectives. The lowest correlation
is 97.6%. We emphasize the impossibility of statistically comparing the data generating processes regarding AHP and Thurstone approaches. However, the similarities in the final classifications are remarkable.
Table 7. Spearman rank correlations. The figures in parentheses are p-values.
Method/perspective Thurstone/area importance
Thurstone/public policies
AHP/area importance
AHP/public Policies
Thurstone/area importance
1 0.05455 0.97576 -0.01818
(0.8810) (<0.0001) (0.9602) Thurstone/public
policies
1 0.05455 0.98788
(0.8810) (<0.0001) AHP/area
importance
1 -0.01818
(0.9602) AHP/public
policies
1
Source: Prepared by the authors.
5. Summary and Conclusions
27
that are essential for agricultural sustainability, we applied Thurstone’s law of categorical judgments and Saaty’s AHP method to rank the perceptions and measure the consistencybetween the two perspectives. To obtain comparable results, the AHP approach was adapted to bring the data to the AHP typical scale, to ease the computations, and to make the results
comparable to Thurstone’s.
AHP weights are easy to compute but lead to difficulties in interpretation, since one cannot properly separate weight perceptions, which are also scale dependent. The model cannot
be tested either. Thurstone’s fit may be tested statistically using deviance analyses. In our application the three Thurstone’s models were not rejected using a chi-square test for both perspectives. The scale deviances for Model C are 1.8394 and 1.9524 for the area importance and the intensity of public policies, respectively. Both are not statistically significant.
We concluded that the ranks induced by both approaches are highly correlated and indicate very poor association between the area importance and the intensity of public policies. For the AHP model this correlation is negative. The Model C classification of items from the perspective of area importance is 10 (infrastructure and logistics), 2 (animal health), 3 (plant health), 5 (natural resources management), 1 (extreme weather events and fire), 7 (credit), 6 (market/commercialization), 8 (international trade), 4 (production management), and 9 (regulatory framework and interest conflict). Item 10 is by far the most important perception. Item 7 is the most intense for public policies. Credit is of no help if logistics and infrastructure
problems are not solved. For Thurstone’s models, with the exception of an inversion between item 6 and item 8 in the area importance, the ranks are the same for both perspectives.
Acknowledgements. To CNPq for the financial support.
References
Bana e Costa, C. A., Lourenço, J. C., Oliveira, M. D. and Bana e Costa, J. C. A socio-technical approach for group decision support in public strategic planning: The Pernambuco PPA case.
Group Decision and Negotiation, v. 23, n. 1, p. 5-29, 2014.
Bana e Costa, C. A. and Vansnick, J. C. MACBETH – An interactive path towards the construction of cardinal value functions. International Transactions in Operational Research, v. 1, n. 4, p. 489-500, 1994.
Canas, S. R. D., Ferreira, F. A. F., and Meidutė-Kavaliauskienė, I. Setting rents in residential real estate: a methodological proposal using multiple criteria decision analysis. International Journal of Strategic Property Management, v. 19, n. 4, p. 368-380, 2015.
Chanthawong, A. and Dhakal, S. Stakeholders’ perceptions on challenges and opportunities for biodiesel and bioethanol policy development in Thailand. Energy Policy, v. 91, p. 189-206, 2016.
Delbari, S. A., Ng, S. I., Aziz, Y. A. and Ho, J. A. An investigation of key competitiveness indicators and drivers of full-service airlines using Delphi and AHP techniques. Journal of Air Transport Management, v. 52, p. 23-34, 2016.
Gazzola, R., Guiducci, R. C. N., Lopes, D. B., Pereira, V. F., Santos, A. C. C., Souza, G. S., Torres, D. A. P. and Vieira Jr., P. A. Risk assessment of events of interest for the Brazilian agricultural sector based on a psychometric model for ordinal preferences. In: Anais do XLVII SBPO - Simpósio Brasileiro de Pesquisa Operacional, Porto de Galinhas-PE, 2015.
28
Lin, C.-H., Wen, L. and Tsai, Y.-M. Applying decision-making tools to national e-waste recycling policy: An example of Analytic Hierarchy Process. Waste Management, v. 30, n. 5, p. 863-869, 2010.Orbán-Mihálykó, E., Koltay, L., Szabó, F., Csuti, P., Kéri, R. and Schanda, J. A new statistical method for ranking of light sources based on subjective points of view. Acta Polytechnica Hungarica, v. 12, n. 8, p. 195-214, 2015.
Petrini, M. A., Rocha, J. V., Brown, J. C. and Bispo, R. C. Using an analytic hierarchy process approach to prioritize public policies addressing family farming in Brazil. Land Use Policy, v. 51, p. 85-94, 2016.
Prochazkova, P. T., Krechovska, M. and Lukas, L. Effectiveness of entrepreneurship policies: Some evaluation research perspectives. Amfiteatru Economic, v. 17, n. 39, p. 706-722, 2015.
Requia, W. J., Roig, H. L., Koutrakis, P. and Rossi, M. S. Mapping alternatives for public policy decision making related to human exposures from air pollution sources in the Federal District, Brazil. Land Use Policy, v. 59, p. 375-385, 2016.
Saaty, T. L. Multicriteria Decision Making: The Analytic Hierarchy Process. Planning, Priority Setting, Resource Allocation. Pittsburgh: RWS Publishing, 1990.
SAS Institute Inc. SAS/STAT®14.1 User’s Guide: High-Performance Procedures. Cary, NC: SAS Institute Inc., 2015.
Schillo, R. S., Isabelle, D. A. and Shakiba, A. Linking advanced biofuels policies with stakeholder interests: A method building on Quality Function Deployment. Energy Policy, v. 100, p. 126-137, 2017.
Souza, G. S. The law of categorical judgment revisited. Brazilian Journal of Probability and Statistics, v. 16, n. 2, p. 123-140, 2002.
Souza, G. S. and Gomes, E. G. Scale of operation, allocative inefficiencies and separability of inputs and outputs in agricultural research. Pesquisa Operacional, v. 33, n. 3, p. 399-415, 2013.
Thurstone, L. L. A law of comparative judgment. Psychological Review, v. 34, n. 4, p. 273-286, 1927.