DECLARAÇÃO
Nome: Rui Jorge Andrade Alves
Endereço eletrónico: rui.a.mail@gmail.com Telefone: 912025423 Número do Bilhete de Identidade: 13903308
Título dissertação
Role of PIP5K in heat-stress signalling and tolerance in Arabidopsis thaliana
Orientador(es):
Dra. Ana Cunha (Departamento de Biologia da Escola de Ciências – Universidade do Minho) Dr. Teun Munnik (Swammerdam Institute for Life Sciences – University of Amesterdam)
Ano de conclusão: 2018
Designação do Mestrado: Mestrado em Biologia Molecular, Biotecnologia e Bioempreendedorismo em Plantas
É AUTORIZADA A REPRODUÇÃO PARCIAL DESTA DISSERTAÇÃO APENAS PARA EFEITOS DE INVESTIGAÇÃO, MEDIANTE DECLARAÇÃO ESCRITA DO INTERESSADO, QUE A TAL SE COMPROMETE.
Universidade do Minho, setembro de 2018
iii Acknowledgments
This Master's thesis in Plant Molecular Biology, Biotechnology and Bioentrepreneurship is the result of the collaboration of several people to whom I express my gratitude:
To my supervisor, Prof. Teun Munnik, for the opportunity to develop this fascinating theme in the University of Amsterdam, for his knowledge and his encouragement.
To my supervisor, Prof. Ana Cunha, for her availability, especially for meeting me during my short home visits, her advice and her encouragement throughout this work.
To Michael Mishkind, for his knowledge and encouragement, and for helping me in the lab during my first weeks of work.
To my lab colleagues, for all the advising and help. A special word to Xavi, Max and Ringo. To my professors and colleagues of the Master, for having met them and for exchanging experiences.
To my family and friends for all the support they gave me.
To my parents and my brother for the love, the encouragement, the patience and the help that they have given me during these two years.
v
Role of PIP5K in heat-stress signalling and tolerance in Arabidopsis thaliana ABSTRACT
Plants are exposed to a wide variety of biotic and abiotic stresses that disturb their development and productivity, such as extreme temperatures that can gravely affect the plant morphology, physiology and metabolism. On its turn, plants have developed responses to cope with heat stress, a process termed thermotolerance. Basal thermotolerance refers to the innate capacity of plants to survive when exposed to high temperatures while acquired thermotolerance involves a prior acclimation to a moderate level of heat. Plants’ perception of the heat stress involves multiple pathways and signalling molecules such as the phosphoinositides, which are derived from the structural membrane lipid phosphatidylinositol. Previous work on phospholipid signalling of heat stress have demonstrate a dramatic increase in PtdIns(4,5)P2, as a consequence of an increase in PIP5K activity, and by 32
P-phospholipid labelling it was discovered to involve PIP5K7 and PIP5K8 (Mishkind et al., 2009; Munnik lab, unpublished). These kinases are associated to the PtdIns(4,5)P2 generation pathway, throughout
the phosphorylation of the head group of another phosphoinositide, PtdInds4P.
The principal aim of this work is understanding what are the role of these kinases in heat signalling. For that, T-DNA insertion knock-out mutants (single and double pip5k7 and pip5k8 mutants) have been generated to study the role of these genes in basal- and acquired-heat tolerance and evaluation of the gene expression analysis by Promoter-GUS assays.
For evaluating seedlings survival to heat, 3 days-old seedlings were subjected to a heat shock of 44 °C for 36 min, for basal thermotolerance, or 45 °C for 2.5 h with a prior treatment of 37 °C for 1 h, for acquired thermotolerance. Root elongation and GUS-staining analysis were performed with 6 days-old seedlings subjected to 40 °C for 30 min. Seed germination was assessed after seeds being subjected to a heat shock of 50 °C for 2 hours. Phenotypic analysis has showed that pip5k8 loss-of-function seedlings exhibit a better recovery from heat shock, compared to wild-type ones, with greener leaves and a more developed root system. The better performance of the pip5k8 loss-of-function mutants in basal thermotolerance may indicate that it is not the PIP5K8 but the PIP5K7 that is involved in the tolerance to heat stress for basal thermotolerance. This was also corroborated by the histologic GUS-staining analysis of the pip5k7 promoter, being displayed an intensive blue staining in non-vascular cells of the cotyledons, which was not observed for untreated seedlings. For acquired thermotolerance, it was observable a phenotype for the pip5k7 loss-of-function seedlings, that showed higher survival from the heat shock than the wild-type. The higher viability of pip5k7-1 loss-of-function mutant suggest that the PIP5K8 is involved in acquired thermotolerance of young seedlings, promoting an improvement of seedlings survival. Looking at the germination patterns after subjecting the seeds to heat treatments (basal and acquired), the pip5k8 loss-of-function seeds showed a percentage of germination significantly inferior than the wild-type ones. This phenotype may indicate a role for PIP5K8 in heat tolerance during seed germination, either for basal and acquired thermotolerance.
The approaches used in this work to investigate the PIP5K7 and PIP5K8 function have disclosed the role of these PIP5K isoforms in heat-stress responses (basal and acquired thermotolerance) during seed germination and early plant development. Further research on the expression of these kinases by Q-PCR will strengthen the current knowledge about their role in heat signalling.
vii
O papel da PIP5K na sinalização e tolerância ao stresse pelo calor em Arabidopsis thaliana
RESUMO
As plantas estão constantemente sujeitas a uma diversidade de stresses que perturbam o seu desenvolvimento e produtividade, como é o caso de temperaturas extremas que podem afetar a morfologia, fisiologia e metabolismo das plantas. Estas, por sua vez, foram desenvolvendo respostas para lidar com o stresse pelo calor excessivo, num processo designado por termotolerância. A termotolerância basal refere-se à capacidade inata das plantas sobreviverem quando expostas a temperaturas elevadas, enquanto a termotolerância adquirida envolve uma aclimação prévia ao calor. A perceção das plantas ao stresse pelo calor envolve múltiplas vias e moléculas sinalizadoras, tais como os fosfoinositídeos que derivam do lípido estrutural de membrana fosfatidilinositol. Trabalhos anteriores na sinalização fosfolipídica do stresse pelo calor demonstraram um aumento substancial de PtdIns(4,5)P2 como consequência de um aumento da atividade da PIP5K e, através de ensaios com
fosfolípidos marcados com 32P, foi descoberto que envolve a PIP5K7 e a PIP5K8 (Mishkind et al., 2009;
Munnik lab, não publicado). Estas cinases estão associadas à via de formação de PtdIns(4,5)P2.
O principal objetivo deste trabalho é perceber o papel destas cinases na sinalização do calor. Para isso foram gerados mutantes (T-DNA insertion knock-outs) mutados no gene pip5k7, no pip5k8 e em ambos, para estudar o seu papel na termotolerância basal e adquirida, bem como avaliar a sua expressão através de um ensaio de promotor-GUS.
Para avaliar a sua sobrevivência ao calor, plântulas com 3 dias foram sujeitas a 44 °C por 36 min, para termotolerância basal, ou 45 °C por 2,5 h com tratamento prévio de 37 °C por 1 h, para termotolerância adquirida. A análise do crescimento da raiz e expressão do promotor-GUS foi realizada em plantas com 6 dias sujeitas a 40 °C por 30 min. A germinação das sementes foi avaliada após terem sido sujeitas a 50 °C por 2 h. A análise fenotípica mostrou que as plântulas mutadas no pip5k8 apresentaram uma melhor recuperação do choque térmico, comparativamente às selvagens, apresentando folhas mais clorofilinas e um sistema radicular mais desenvolvido. A melhor performance destas plântulas nos ensaios de termotolerância basal sugere que não é a PIP5K8 mas a PIP5K7 que está envolvida na tolerância basal ao stress pelo calor. Isto é corroborado pela análise histológica (GUS-staining) do promotor de pip5k7, onde foi exibido um intenso sinal nas células não vasculares dos cotilédones que não foi observado em plântulas não tratadas. Nos ensaios de termotolerância adquirida foi observado que as plântulas mutadas no pip5k7 apresentaram uma maior resistência ao choque térmico do que as selvagens. A maior viabilidade destas plântulas sugere que a PIP5K8 está envolvida na termotolerância adquirida, promovendo maior sobrevivência. Relativamente à germinação das sementes após choque térmico (avaliando a termotolerância basal e adquirida), verificou-se que sementes mutadas no pip5k8 apresentaram uma % germinação significativamente inferior à das não mutadas. Este fenótipo sugere um papel para a PIP5K8 na tolerância ao calor durante a germinação, quer para termotolerância basal, quer para adquirida.
As estratégias utilizadas neste trabalho permitiram desvendar o papel das isoformas da PIP5K – PIP5K7 e PIP5K8 – nas respostas ao stresse pelo calor (termotolerância basal e adquirida) durante a germinação e desenvolvimento inicial da planta. Investigação adicional na expressão destas isoformas, nomeadamente através de ensaios Q-PCR, servirão para aprofundar o conhecimento atual sobre o seu papel na sinalização do stresse pelo calor.
ix Table of Contents Acknowledgments ... iii Abstract ... v Resumo ...vii Table of Contents ... ix List of Abbreviations... xi
List of Figures ... xiii
List of Tables ... xv
I. INTRODUCTION ... 1
1. Stress in plants ... 3
1.1. Temperature stress ... 4
1.1.1. Heat stress ... 5
1.1.2. Plant responses to heat stress ... 7
1.2. Heat sensing and signalling ... 9
1.2.1. The role of Ca2+ ... 9
1.2.2. Heat shock transcription factors... 10
1.3. Lipid signalling in plants ... 11
1.3.1. Phosphatidic acid formation ... 12
1.3.2. Phosphoinositides ... 12
1.3.3. PPIs are hydrolysed by PLC ... 14
1.3.4. PtdIns(4,5)P2 accumulation during heat stress ... 15
2. Aim of the thesis ... 15
II. MATERIALS AND METHODS... 17
2.1. Plant material ... 19
2.2. Seed sterilization... 19
x
2.4. Seedlings survival assay ... 20
2.5. Root elongation assay ... 20
2.6. Determination of chlorophyll content ... 20
2.7. Plant DNA manipulation ... 21
2.7.1. DNA isolation ... 21 2.7.2. DNA quantification ... 21 2.7.3. Amplification by PCR ... 21 2.7.4. DNA electrophoresis ... 22 2.8. GUS-staining ... 23 2.9. Statistical analysis ... 23
III. RESULTS AND DISCUSSION ... 25
3.1. Phenotypic analysis ... 27 3.1.1. Seedlings survival ... 27 3.1.1.1. Basal thermotolerance ... 28 3.1.1.2. Acquired thermotolerance... 38 3.1.2. Root growth ... 35 3.1.3. Seed germination ... 38 3.2. Genotyping ... 42 3.3. GUS-expression analysis ... 44
IV. CONCLUSIONS AND FURTHER PERSPECTIVES ... 47
xi List of Abbreviations
ANOVA – Analysis of variances APX – Ascorbate peroxidase CaM – Calmodulin
CAT – Catalase
CBK3 – CaM-binding protein kinase 3 Col-0 – Colombia-0
DAG – Diacylglycerol DAT – Days after treatment DGK – Diacylglycerol kinase DGPP – DAG pyrophosphate DNA – Deoxyribonucleic acid DPP – DGPP phosphatase
DREB – Dehydration-responsive element
binding
DREB2A – Dehydration-responsive
element-binding protein 2A
EDTA – Ethylenediaminetetraacetic acid Fw – Forward primer
GUS – β-glucuronidase HS – Heat shock
HSE – Heat shock element HSF – Heat shock factor HSP – Heat shock protein HSU – HS-up-regulated Ins – Inositol
Ins(1,4)P2 – Inositol 1,4-bisphosphate
Ins(1,4,5)P3 – Inositol 1,4,5-trisphosphate
IR – Infrared
LB – Left border primer LR – Lateral root
MS – Murashige and Skoog medium PA – Phosphatidic acid
PAK – PA kinase
PAP – PA phosphatase PC – Phosphatidylcholine PCR – Polymerase chain reaction PE – Phosphatidylethanolamine PI3K – Phosphoinositide 3-kinase PI4K – Phosphoinositide 4-kinase PIP5K – PtdIns4P 5-kinase PI-PLC – PI-specific PLCs PLC – Phospholipase C PLD – Phospholipase D PPIs – Phosphoinositides PtdIns – Phosphatidylinositol PtdIns(3,4)P2 – Phosphatidylinositol 3,4-bisphosphate PtdIns(3,4,5)P3 – Phosphatidylinositol 3,4,5-trisphosphate PtdIns(3,5)P2 – Phosphatidylinositol 3,5-bisphosphate PtdIns(4,5)P2 – Phosphatidylinositol 3,4-bisphosphate
PtdIns3P – Phosphatidylinositol 3-phosphate PtdIns4P – Phosphatidylinositol 4-phosphate PtdIns5P – Phosphatidylinositol 5-phosphate Q-PCR – Quantitative real-time PCR
Rnase – Ribonuclease ROS – Reactive oxygen species Rv – Reverse primer
SD – Standard deviation
SEM – Standard error of the mean SOD – Superoxide dismutase T-DNA – Transfer DNA UV – Ultraviolet
xiii List of Figures
Figure 1. Different environmental stresses to which an organism may be subjected ... 3
Figure 2. Prediction map for Europe of change in annual mean temperature and amount of precipitation (CEC, 2007) ... 5
Figure 3. Effects of heat stress on biophysical, biochemical and physiological processes in plants ... 6
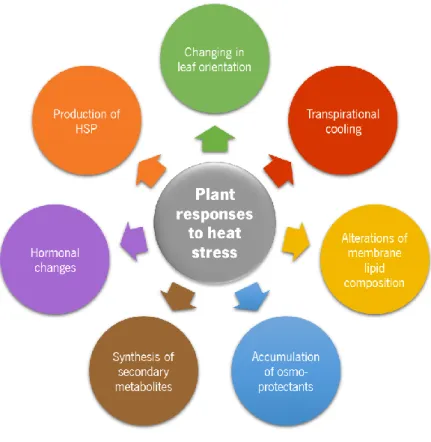
Figure 4. Plant responses to heat stress ... 8
Figure 5. Signalling components involved in the plant response to heat ... 11
Figure 6. Synthesis of PA ... 12
Figure 7. Structure of the phosphoinositide, PtdIns(4,5)P2 ... 13
Figure 8. Synthesis of PtdIns4P and PtdIns(4,5)P2... 14
Figure 9. PtdIns(4,5)P2 is hydrolysed by PLC ... 14
Figure 10. Schematic representation of the heat shock conditions used to evaluate basal thermotolerance phenotypes for Arabidopsis thaliana seedlings ... 28
Figure 11. Seedlings survival assay for basal thermotolerance ... 29
Figure 12. Chlorophyll content and weight of the aerial part of seedlings used in the basal thermotolerance treatment... 30
Figure 13. Relative main root length increment of seedlings survival assay for basal thermotolerance ... 32
Figure 14. Schematic representation of the heat shock conditions used to evaluate acquired thermotolerance phenotypes for Arabidopsis thaliana seedlings ... 33
Figure 15. Seedling survival assay for acquired thermotolerance ... 34
Figure 16. Schematic representation of the heat shock conditions used in root growth assays. ... 35
Figure 17. Root growth assay ... 36
xiv
Figure 19. Schematic representation of the heat shock conditions used to evaluate basal and
acquired thermotolerance phenotypes in germination for Arabidopsis thaliana seeds. ... 39
Figure 20. Germination percentage for basal and acquired thermotolerance... 40 Figure 21. Percentage of germinated seeds for basal and acquired thermotolerance determined
216 h after stress ... 41
Figure 22. Genotyping of the T-DNA knock-out mutants ... 43
xv List of Tables
Table 1. Sequence of the primers used for genotyping ... 22 Table 2. Preparation of PCR reaction-mixes ... 22 Table 3. PCR conditions used ... 22
1
3
1. Stress in plants
Plants are incessantly exposed to stress, that is normally defined as any alteration of environmental conditions that can disturb their growth or development (Salisbury & Ross, 1992), and consequently their productivity (Buchanan et al., 2000). Stress can cause a premature end of the vegetative developmental program, with the subsequent transition to flowering, fertilization and seed establishment before the plant reach its full size, therefore resulting into a reduced plant size and reduced seed production (Taiz et al., 2014).
Although it can be caused by combined conditions, plant stress is usually categorized as biotic or abiotic (Figure 1). A stress is classified as biotic when it is triggered by living organisms (such as pathogens or herbivores), while the abiotic stress is a result of a variation of the physical or chemical environment of the plant (Hopkins & Hüner, 2009), such as variations in temperature, water availability, radiation, chemicals (Taiz et al., 2014) and in other parameters like wind or pressure (Levitt, 1980).
4
In addition to these primary stresses, and as a consequence of them, secondary stresses like osmotic or oxidative stress can surge. For example, oxidative stress, caused by an increase of reactive oxygen species (ROS), is commonly associated with high temperature, salinity and drought stress (Wang et al., 2003).
As sessile organisms, plants cannot escape from these adverse environments so, during evolution, they have developed sophisticated strategies that enabled them to survive by quickly responding to environmental changes. This process by which the plant fits to cope with an unfavourable environment is known as stress resistance or stress tolerance (Taiz & Zeiger, 2010).
When referring to the different mechanisms by which plants respond to stress, generally the expressions acclimation and adaptation are mentioned. Plant acclimation is used when referring to the plants’ adjustments in response to stress that comprises alterations on their physiology or morphology enhancing their survival and reproduction ability, without being required genetic modifications and with the possibility of reversion if the environmental conditions change back (Taiz et al., 2014). On the other hand, adaptation requires genetic changes of a population of organisms in order to enhance their environmental fitness (Buchanan et al., 2000). These plant adaptive mechanisms to different environmental stresses allow the avoidance of the potentially damaging effects of these conditions (Taiz et al., 2014).
1.1. Temperature stress
Temperature is an environmental variable that has a decisive role in plant growth and development and, together with salinity and drought, extreme temperatures are normally referred as the most common abiotic stress that come across with plants (Bhatnagar-Mathur et al., 2008). Plants are continuously subjected to temperature oscillations that vary during the different moments of the day and over the different seasons of the year and may lead to negative consequences to plants if there are extreme deviations in temperature (Fitter & Hay, 1991; Ciarmiello et al., 2011). Temperature stress can be distinguished in three major categories: heat shock; freezing, for temperatures below 0 ºC; and chilling, at low temperatures above 0 ºC (Sung et al., 2003). Some species have however some adaptive processes by which the temperature range of survival can be extended by a prior less severe treatment. Such induced mechanisms are known as “cold acclimation” or “acquired thermotolerance”, when they lead to an increase in chilling/freezing or in heat tolerance, respectively (Ciarmiello et al., 2011).
5
It is important to remember the two different standpoints on plant responses to high temperature that are generally used: basal and acquired thermotolerance. “Basal thermotolerance” refers to the innate capacity of plants surviving when exposed to temperatures above the ones optimal for their growth, while “acquired thermotolerance” is the aptitude of plants to rapidly acclimate to otherwise normally lethal temperatures, by a prior exposure to a moderate level of heat or if submitted to a gradual increase in temperature (Larkindale et al., 2005a; Mishkind et al., 2009).
1.1.1. Heat stress
Crop productivity is highly affected by drought, salt and temperature stresses, with their adverse effects being intensified by climate changes, being predicted a rise in temperature and changes in precipitation (Zhu, 2016; Zandalinas et al., 2017). According to the Intergovernmental Panel on Climate Change (IPCC), until the end of the century, it is predicted a rise of 1.5 - 2 °C of the global surface temperature, in relation to 1850-1900 (IPCC, 2014) and, as a result of this, more than half of Europe’s plant species could be vulnerable or threatened by 2080 (CEC, 2007). One of the most susceptible areas in Europe in response to climatic changes is Southern Europe (Figure 2), where Portugal is located, because of “the combined effect of high temperature increases and reduced precipitation in areas already coping with water scarcity” (CEC, 2007).
Figure 2. Prediction map for Europe of change in annual mean temperature and amount of precipitation
(CEC, 2007). Figures are based on IPCC SRES scenario A2. The projected climate impacts are estimated for 2071-2100 relative to 1961-1990.
6
According to the IPCC report (IPCC, 2014), plants will experience heat stress not only due to a consistent increase in global mean temperatures, but also as a result of an intensification of heat waves, either by its frequency, intensity and/or duration (Gray & Brady, 2016).
Heat can grievously affect plant morphology, physiology and metabolism (Figure 3). Some of the more observable morphological consequences of heat in plants are the scorching and sunburns of leaves and stems, shoot and root growth inhibition, leaf senescence and abscission, abortion of flowers and fruits or fruit discoloration and damage (Wahid et al., 2007; Hasanuzzaman et al., 2013).
In addition to a shortened plant life cycle and a reduction of yield and plant productivity (Bita & Gerats, 2013), there are also noticeable changes in plant architecture, such as elongation of hypocotyls and petioles, “morphological responses similar to those observed in shade-avoidance response” (Gray & Brady, 2016). It has also been demonstrated that heat can reduce pollen fertility as well other consequences during germination, including reduced plant radicle emergence, abnormal seedlings, delayed germination and poor seedlings’ vigour (Hasanuzzaman et al., 2013). Alterations of cell differentiation, elongation and expansion also lead to a reduced cell size and plant growth (Wahid et al., 2007).
At the cellular level, heat is responsible for an increase of membrane fluidity, and therefore for changes in membrane permeability (Larkindale et al., 2005a). Heat can cause changes in the organization of cellular structures, such as organelles and cytoskeleton, modification of enzyme
7
activity and protein denaturation or degradation (Bita & Gerats, 2013). The rise of temperature in plant cell triggers an increase in the velocity of the movements (either vibrational, rotational or translational) of the reacting molecules, therefore increasing intermolecular collisions. The tertiary structure of the enzymes, that is responsible for the enzymatic activity (since the substrate molecules must fit exactly into these structures for the reaction proceed), tend to be altered by this enhanced molecular agitation, affecting consequently enzyme activity (Fitter & Hay, 1991).
One of the major consequences of heat stress is the decrease in photosynthetic activity (Larkindale et al., 2005a), caused by alterations in chloroplasts, with modifications of the structural organization of thylakoids, such as swelling of grana and loss of grana stacking (Hasanuzzaman et al., 2013). The activity of photosystem II is also reduced in these conditions, as well as the amount of photosynthetic pigments, mainly due to the increase of chlorophyllase activity (Bita & Gerats, 2013). Other limitations to photosynthesis are related to RuBisCO activity including reduced regeneration of ribulose-1,5-bisphosphate, the substrate for RuBisCO carboxylation, and also reduced activity of RuBisCO activase, the enzyme responsible for the removal of inhibitory molecules from the catalytic site of RuBisCO (Gray & Brady, 2016). This reduced efficiency of photosynthesis can result in a decrease of energy reserves, leading to plant starvation and reproductive failure (Bita & Gerats, 2013).
Another contribution to cellular damage due to high temperatures is the production and accumulation of reactive oxygen species (ROS), like anion superoxide radical (•O
2-), singlet oxygen
(1O2), hydrogen peroxide (H2O2) and hydroxyl radical (•OH), that can promote the peroxidation of
membrane lipids and pigments (Wahid et al., 2007).
1.1.2. Plant responses to heat stress
Plants have developed several responses to cope with heat stress (Figure 4), engendering for that some avoidance mechanisms like changing leaf orientation or enhanced transpiration to promote plant cooling (Hasanuzzaman et al., 2013), but also modifications of the lipid composition of membranes, increasing the amount of saturated and monounsaturated fatty acids in order to maintain membrane stability (Bita & Gerats, 2013).
Upon heat stress, plants increase their stomatal conductance, increasing the transpiration rate, a process where the endothermic water phase transition lead to leaf cooling and for this is usually referred as transpirational cooling. However, if heat stress occurs simultaneously with drought, what happens frequently, the stomata closure is promoted, resulting in an increase in leaf
8
temperature of 2 to 5 ºC (Taiz et al., 2014). To avoid loss of cell water content, besides closure of stomata, a reduced leaf area or larger xylem vessels in roots and shoots are promoted (Hasanuzzaman et al., 2013).
Other responses may involve hormonal changes, accumulation of compatible osmolytes (osmo-protectants) and secondary metabolites, and accelerated transcription and translation of heat shock proteins (HSPs) (Wahid et al., 2007).
At the hormonal level it is enhanced the production of some phytohormones, in particular abscisic acid, salicylic acid and ethylene, and decreased the production of others, like auxins, cytokinins and gibberellins (Bita & Gerats, 2013).
In relation to the osmolytes, there is an increase in the accumulation of primary metabolites, such as proline, glycine betaine and soluble sugars (Bita & Gerats, 2013), as well sugar alcohols (polyols), tertiary sulphonium compounds or tertiary and quaternary ammonium compounds (Wahid et al., 2007). Heat stress may also enhance the production of secondary metabolites, such as phenolic compounds, including flavonoids and anthocyanins, and plant steroids (Wahid et al., 2007).
9
Plants have also developed detoxification systems as a response to oxidative stress induced by heat. It has been observed that the activity of antioxidant enzymes, such as superoxide dismutase (SOD), ascorbate peroxidase (APX) and catalase (CAT), increases in response to heat stress, protecting cells from oxidative damage (Wahid et al., 2007; Hasanuzzaman et al., 2013). Is was also detected that an enhanced synthesis of ascorbate and glutathione results into a lower production of ROS, protecting the plants against oxidative stress (Xu et al., 2006). Other antioxidant metabolites, like tocopherol and carotene, have been demonstrated to have the same protective effects (Hasanuzzaman et al., 2013).
Heat shock proteins (HSP) rapidly accumulate in the cell immediately after exposure to heat stress and the major function of these molecular chaperones is maintaining the functional conformation and functionality of cell proteins (Wahid et al., 2007). These proteins are generally grouped into five families, according their size: HSP100, HSP90, HSP70, HSP60 and small HSP (smHSP). The HSP70 and HSP60 are highly conserved proteins in nature (Hasanuzzaman et al., 2013) and there have been proposed several functions to HSP70, such as protein translation and translocation, proteolysis, protein folding or chaperoning, aggregation suppressing, and reactivation of denatured proteins (Zhang et al., 2005, cited by Wahid et al., 2007).
1.2. Heat sensing and signalling
Plants can perceive stresses and trigger appropriate responses to re-establish their homeostasis, which typically involve multiple signalling pathways, regulatory networks and cellular compartments (Ciarmiello et al., 2011; Mittler et al., 2012). Membrane fluidity is highly affected by fluctuations of the ambient temperature, being triggered regulatory functions such as the up-/down-regulation of genes (Horváth et al., 2012).
1.2.1. The role of Ca2+
Ca2+ plays a significant role in stress signalling, since it functions as a key messenger, responsible
for regulating many growth and development processes (Reddy et al., 2011). The Ca2+ flux in the
cytosol and cellular compartments is regulated by complex mechanisms that involve Ca2+ channels,
pumps and exchangers, which are responsible for maintaining Ca2+ homeostasis or for bringing
10
Modifications of the membrane fluidity play a key role in sensing heat stress, since that can affect the activity of specific calcium channels present in the plasma membrane (Conde et al., 2011). Heat shock cause the opening of these Ca2+ channels thus causing a specific and transient Ca2+
influx into the cell (Mittler et al., 2012). This sudden increase of cytoplasmic Ca2+ triggers a further
heat-shock response, that involves the activation of calmodulins (CaMs) (Ahuja et al., 2010). Calmodulins like CaM3 can activate calcium-dependent kinases, such as CBK3, responsible for the phosphorylation of HSFA1a, a member of the HSF (heat shock factor) family (Mittler et al., 2012). The activation of HSF will promote the expression of HSP genes and, consequently, the production of HSPs, leading to an increased thermotolerance. In this way, it is suggested a transient and sequential heat shock response, characterized by an initial Ca2+ influx that triggers a transient
mRNA synthesis, which is thus responsible for a transient protein expression (Horváth et al., 2012).
1.2.2. Heat shock transcription factors
Heat stress responsive genes, that encode HSPs, are up-regulated by conserved heat shock transcription factors, also known as HSFs (Liu , 2011). These transcription factors, which form active trimeric conformations (Liu & Charng, 2012), are able to recognize and bind to conserved cis elements (HSE) in the promoter region. HSE consists in palindromic sequences (5’-AGAAnnTTCT-3’) in the promoter region of many HSP genes, and function as the binding site for HSF (Sung et al., 2003; Larkindale et al., 2005a). HSFs, which were found to be encoded by 21 different genes in Arabidopsis, are assigned into three major classes – A, B and C – based on structural differences at their oligomerization domains (Kotak et al., 2007), with the number of HSF present in each group varying among the different species (Liu et al., 2011).
The members of the HSFA1 group are considered the master regulators of the heat shock response (Liu et al., 2011), since they are essential for the activation of transcriptional networks and have been predicted to regulate the expression of other HSFs (Ohama et al., 2017), including HSFA2, HSFA7 or DREB2A, a dehydration-responsive element binding protein (Figure 5).
It is suggested that HSFA2s are involved in the regulation of late heat shock response, being responsible for improving acquired thermotolerance in plants by positively regulating the expression of heat-induced genes after an initial induction by HSFA1 (Charng et al., 2007). In this way, HSFA1s appear to be responsible for the regulation of early heat shock response, while HSFA2s are involved in the regulation of late heat shock response (Liu et al., 2011).
11
In relation to HSFA3 transcription factors, it was shown that these are induced by DREB2A, a transcription factor involved in the regulation of dehydration-responsive genes (Kotak et al., 2007), that functions in heat shock and water-deficit stress responses (Liu et al., 2011).
It is also known that HSFA9 is involved in the regulation of HSP expression during seed development and that HSFB1 and HSFB2b act as transcriptional repressors (Maruyama et al., 2017).
1.3. Lipid signalling in plants
Plant cells are bounded by membranes that separate the cytoplasm from the extracellular space, acting as hydrophobic barriers that control the exchange of molecules and information (Heilmann, 2016). They are composed by proteins that are embedded in a double layer (bilayer) of lipids (Taiz et al., 2014), formed by structural phospholipids, sphingolipids, sterols and other minor lipid constituents. The head group of phospholipids comprises of a phosphate residue that can be esterified with ethanolamine, choline, serine, glycerol or inositol (Heldt, 2005). Other minor lipid constituents have regulatory roles on membrane-associated processes (Gerth et al., 2017), such
Figure 5. Signalling components involved in the plant response to heat (Liu et al., 2011). HSFA1, which
are activated by heat shock through a Ca2+/CaM/CBK pathway, are considered the master regulators of
HSR. It is predicted that HSFA1 regulate the expression of other HSF, such as HSFA7, HSFA2 and DREB2A, which in its turn, induces HSFA3. All these HSF are responsible for activating HSP, promoting plant thermotolerance. In parallel, heat shock promotes an increase of the levels of several heat-responsive metabolites, like NO and H2O2. Abbreviations: CaM, calmodulin; CBK3, CaM-binding protein kinase 3; DREB,
dehydration-responsive element-binding protein; HS, heat shock; HSF, heat shock factor; HSU, HS-up-regulated.
12
as phosphatidic acid, that plays a role as a signal substance (Heldt, 2005). Another example of these lipids with regulatory roles are the phosphoinositides (Hou et al., 2016), which comprise <1 % of membrane phospholipids, and are involved in stress signalling (Munnik et al., 2011).
1.3.1. Phosphatidic acid formation
Phosphatidic acid (PA) can be formed by two distinct pathways (Figure 6). Structural phospholipids, such as phosphatidylethanolamine (PE) and phosphatidylcholine (PC), can be hydrolysed by phospholipase D (PLD), generating PA and a free hydrophilic head group (Testerink & Munnik, 2005). Another way to produce PA is by the phosphorylation of the diacylglycerol (DAG), which was produced by phospholipase C (PLC), by the action of the diacylglycerol kinase (DGK) (Arisz et al., 2009).
1.3.2. Phosphoinositides
Phosphoinositides (PPIs) are derived from the structural membrane lipid phosphatidylinositol (PtdIns), through phosphorylation or dephosphorylation of the inositol head group (Figure 7) at the positions 3, 4 and 5, by specific kinases and phosphatases (Munnik & Nielsen, 2011). In plants it have been detected five PPI isoforms, generating different PtdIns monophosphates: PtdIns3P, PtdIns4P, PtdIns5P; and bisphosphates: PtdIns(3,5)P2 and PtdIns(4,5)P2 (Gerth et al., 2017). The
presence of PtdIns(3,4)P2 and PtdIns(3,4,5)P3, which have been found in animals, has not been
Figure 6. Synthesis of PA. Abbreviations: DAG, diacylglycerol; DGPP, DAG pyrophosphate; DPP, DGPP
phosphatase; P, phosphate; PAK, PA kinase; PAP, PA phosphatase; PC, phosphatidylcholine; PE, phosphatidylethanolamine; PtdIns, phosphatidylinositol; PtdIns(4,5)P2,
13
confirmed in plants (Heilmann, 2016). PtdIns4P is the most abundant PPI in plants, corresponding to about 80% of the phosphoinositides (Noack & Jaillais, 2017).
The phosphoinositide signalling pathway involves two types of signalling molecules: water-soluble inositol phosphates (InsPs); and lipid-soluble phosphatidylinositol phosphates (PtdInsPs), which are interdependent on each other (Gillaspy, 2013).
Specific kinases are responsible for the formation of PtdIns3P and PtdIns4P from PtdIns: the phosphoinositide 3-kinase (PI3K) and the phosphoinositide 4-kinase (PI4K), respectively (Heilmann, 2016). PtdIns(3,5)P2 and PtdIns(4,5)P2 are originated by the phosphorylation of
PtdIns3P and PtdIns4P in the D5 position of the inositol ring (Gerth et al., 2017). This sequential phosphorylation is catalyzed respectively by four PtdIns3P 5-kinases (similar to the yeast enzyme FAB1) and by PtdIns4P 5-kinases (PIP5K). In Arabidopsis genome are coded 11 different isoforms of PIP5K (Heilmann, 2016). In relation to the PtdIns5P, as no gene encodes for a phosphoinositide 5-kinase, it is most likely formed by the dephosphorylation of PtdIns bisphosphate (Hou et al., 2016). The synthesis of PtdIns(4,5)P2 is represented in Figure 8.
Figure 7. Structure of the phosphoinositide, PtdIns(4,5)P2. PPIs are formed by sequential phosphorylation
of the inositol- (Ins-) head group of PtdIns and PtdInsP, respectively. PtdIns(4,5)P2 is phosphorylated at
positions -4 and -5 (Adapted from Gerth et al., 2017).
P P
Inositol head group
14
1.3.3. PPIs are hydrolysed by PLC
Glicerophospholipids, like PPIs, can be hydrolysed by PLC enzymes, originating diacylglycerol (DAG), that remains in the membrane, and the phosphorylated head group that diffuses into the cytosol (Gerth et al., 2017). In this way, PPIs can be degraded by PI-specific PLCs (PI-PLC), generating inositol polyphosphates (InsP), along with DAG. These enzymes are activated by Ca2+
and in Arabidopsis genome are encoded by a family of nine isoforms, all similar to the mammalian PLCζ subfamily (Munnik, 2014). PtdIns(4,5)P2 can be hydrolysed by PI-PLC (Figure 9) to generate
inositol 1,4,5-trisphosphate (Ins(1,4,5)P3) and DAG (Xue et al., 2009). The inositol polyphosphates
generated can be sequentially phosphorylated by inositol polyphosphate kinases (IPK2 and IPK1), to produce InsP5 and InsP6, a known signalling molecule (Gillaspy, 2013; Munnik, 2014;).
Figure 9. PtdIns(4,5)P2 is hydrolysed by PLC (Heilmann, 2016). The hydrolysis of PtdIns(4,5)P2 by PLC
originates DAG and Ins(1,4,5)P3. In plants, DAG is rapidly phosphorylated to PtdOH and possibly further to
DGPP. An Ins(1,4,5)P3-sensitive Ca2+ channel is absent in plants and Ins(1,4,5)P3 instead appears to act as
a precursor for IPPs, including InsP5, InsP6 or pyrophosphorylated IPPs (PP-IPPs). Abbreviations: DAG,
diacylglycerol; DGPP, diacylglycerol pyrophosphate; Ins(1,4,5)P3, inositol 1,4,5-trisphosphate; InsP5, inositol
pentakisphosphate; InsP6, inositol hexakisphosphate; PtdOH, phosphatidic acid.
Figure 8. Synthesis of PtdIns4P and PtdIns(4,5)P2 (Gerth et al., 2017). PtdIns4P and PtdIns(4,5)P2 are
generated by sequential phosphorylation oh the Ins-head group. The enzymes that are thought to mediate these interconversions are indicated in green. Abbreviations: PI4K, phosphatidylinositol 4-kinase; PIP5K, phosphatidylinositol 4-phosphate 5-kinase.
15
1.3.4. PtdIns(4,5)P2 accumulation during heat stress
Mishkind et al. (2009) have studied how phospholipid-based signalling patterns respond to heat stress by labelling tobacco cells with 32P-ortophosphate. When heat-stressed, a dramatic increase
in PtdIns(4,5)P2 and PA was found and this occurs through activation of PLD and PIP5K.
PtdIns(4,5)P2 accumulated at the plasma membrane, nuclear envelope, nucleolus and punctate
cytoplasmic structures (Mishkind et al., 2009). The increase in PtdIns(4,5)P2 was suggested to
result from an increase in PIPK activity rather than an inhibition of PLC or phosphatase activity.
2. Aim of the thesis
By 32P-phospholipid labelling experiments in Arabidopsis thaliana, the loss of PtdIns(4,5)P
2 response
during heat treatment of T-DNA insertion knock-outs of the 11 PIP5K was analysed (Munnik lab, unpublished). It was discovered that this response involved PIP5K7 and PIP5K8. To understand their role in heat signalling, T-DNA insertion knock-out mutants (single and double pip5k7 and pip5k8 mutants) have been generated and used to study their role in basal- and acquired-heat tolerance as well as their contribution to thermomorphogenesis during early growth and development of seedlings. Promoter-GUS will be used for gene expression analyses.
In the first section, I. Introduction, a general overview of stress in plants is presented, with emphasis to plant responses to heat stress, the signalling mechanisms, as well as lipid signalling in plants, with a focus on the role of phosphoinositides therein. In the section II. Materials and
Methods the plant material and the methodologies used to perform this work are presented. The
presentation and discussion of the results is available after, in the section named III. Results and
Discussion, while the final conclusions and further perspectives of investigation are assembled in
17
19 2.1. Plant material
The seeds of the Arabidopsis thaliana ecotype Columbia (Col-0) and of the homozygous T-DNA insertion mutants pip5k7-1, pip5k8-2 and pip5k7/8 were already available in the laboratory. The same applies for the seeds of ProPIP5k7::GUS and ProPIP5k8::GUS.
2.2. Seed sterilization
A. thaliana seeds were surface sterilized by exposure to chlorine gas (20 mL of thin commercial bleach and 600 µL of 37 % HCl) into a desiccator for 3 hours, and then were put inside a vertical flow chamber for 1 h for complete evaporation of the chlorine gas.
2.3. Seed germination assay
Germination assays were performed after stratification of the seeds, which was done by inserting seeds into 0.5 mL microtubes containing 0.2 mL of sterile 0.1 % (w/v) agarose solution and incubated in the dark at 4 °C for 3 days. Two different assays were performed in order to evaluate basal and acquired thermotolerance. For basal thermotolerance, seeds were heated at 50 °C for 0 hours (or no heating – Control) and 2 hours (Heat Shock), while for acquired thermotolerance seeds were first incubated at 37 °C for 1 hour, returned to 22 °C for 2 hours for recovery and then subjected to 50 °C for 0 hours (Control) and 2 hours (Heat Shock). For both assays, the heat shock was done inserting the respective microtubes into a DNA thermocycler (PTC-100 TM, MJ Research Inc.) programmed with the conditions referred above.
After heat shock, seeds were plated on square Petri dishes containing 25 mL of ½ MS basal medium (Murashige & Skoog, 1962) with Gamborg B5 Vitamins (Duchefa Biochemie, Haarlem, The Netherlands), 1 % (w/v) Daishin agar, 1 % (w/v) sucrose, pH 5.7 adjusted with KOH, and placed near vertically (70°), in the growth room at 22 °C with a 16 h photoperiod. Germination was monitored as radicle emergence using a binocular microscope (M3 Wild Heerbrugg, Switzerland), at indicated time points between 48 h and 336 h after heat treatment.
20 2.4. Seedlings survival assay
Seeds were plated on round Petri dishes containing 20 mL of the same medium described above and maintained in the growth room in the same conditions as above for 3 days before subjected to heat shock. This assay was used to test basal and acquired thermotolerance.
For basal thermotolerance seedlings were heated at 44 °C for 0 min (Control) and 36 min (Heat Shock). For acquired thermotolerance seedlings were first incubated at 37 °C for 1 hour, recovered at 22 °C for 2 hours and then subjected to a new treatment at 45 °C for 0 hours (Control) and 2.5 hours (Heat Shock). The heat shock at 37 °C was done by putting the plates inside an oven and at 44 °C and 45 °C by submerging the sealed plates into a water bath. After treatment, the seeds were immediately left to recover at 22 °C (16 h photoperiod) for 8-10 days. Survival percentage was determined based on the tissue color, where green seedlings were marked as survived and white seedlings were marked as dead.
2.5. Root elongation assay
Seeds stratified and plated on square Petri dishes as described above, and grown vertically in the same conditions as before for 6days before being submitted to treatment. The plates were scanned (Epson Perfection V800 Photo Scanner, at 300 dpi) immediately before and every day after the onset of treatment for 6 days. It was only tested basal thermotolerance and the heat shock was done by putting the sealed plates into a water bath at 40 °C for 0 min (Control) and 30 min (Heat Shock).
The root growth was measured using the plugging SmartRoot version 4.21 (Lobet et al., 2011) of the Fiji ImageJ software (Schindelin et al., 2012).
2.6. Determination of chlorophyll content
The aerial part of the seedlings of one plate (around 30 seedlings of each genotype), of the experiment 2.4., was collected to a 2 mL tube, in quadruplicate, and partially grinded with a pestle to facilitate the extraction. 1.5 mL of 80 % acetone was added and the tubes were kept in the dark for 105 min, being frequently agitated to facilitate pigments diffusion. The tubes were then centrifuged (Centrifuge 5415D, Eppendorf) at 12,000 xg for 2 min and the absorbance (Ax) of the
21
supernatant was measured by spectrophotometry (U 5100 Spectrophotometer Hitachi) at 663.2 nm (A663.2) and 646.8 nm (A646.8), using 80 % acetone as a blank control.
The chlorophyll concentration of the extract was calculated according to Lichtenthaler (1987): Chl. a+b (µg mL-1) = 7.15 x A
663.2 + 18.71 x A646.8, and the chlorophyll content was expressed
in µg/seedling.
2.7. Plant DNA manipulation
2.7.1. DNA isolation
Individual seedlings (around 4-5 days-old) were collected into microtubes, in quadruplicate, added 450 µL of STE/lysis buffer (100mM Tris pH 7.5, 2 % SDS and 10 mM EDTA), and grinded with the help of a pestle. After the addition of more 450 µL of STE/lysis buffer the microtubes were incubated at 65 °C for 20 min. After returning to room temperature, it was added 300 µL of precipitation buffer (10 M ammonium acetate) to the microtubes that were mixed and spin down at 13.000 rpm for 10 min (Centrifuge 5415D, Eppendorf). More 200 µL of precipitation buffer was added and again spin down at 13,200 rpm for 10 min, for total protein precipitation. After the transference of 750 µL of the supernatant to a fresh tube, 750 µL of 2-propanol was added, mixed and incubated for 5 min at RT and then centrifugated at 12,000 rpm for 10 min. The pellet was washed with 70 % EtOH, dried for a couple of minutes and resuspended in 50 µL dH20+RNase
(RNase solution 1 %). The microtubes were incubated at 65 °C for 10 min and then stored at 4 °C for 1 day.
2.7.2. DNA quantification
DNA was quantified by spectrophotometry using the NanoDrop 2000 (Thermo Scientific), using 2 µL of each sample. DNA concentration was determined considering that an A260 of 1 is equivalent
to 50 µg mL-1 and purity was evaluated by A
260 /A280 and A260/A230 ratios.
2.7.3. Amplification by PCR
Amplification of DNA was performed by PCR using My-CyclerTM (Bio-Rad). One specific primer was
designed for the insertions (LB primer) and two primers for the gene of interest (Fw and Rv). The primers sequences are presented in Table 1, the reaction conditions in Table 2 and the PCR conditions in Table 3.
22
Table 1. Sequence of the primers used for genotyping (5’ – 3’)
pip5k7 Fw primer TGCTATGTCGCAGAAACAATG
pip5k7 Rv primer TAAGTCAAACATGCCCCATTC
pip5k8 Fw primer CTCTGGTCAAAGCGAGATCC
pip5k8 Rv primer GATCGGGGGCTCTAAAATGT
LB primer ATTTTGCCGATTTCGGAAC
Table 2. Preparation of PCR reaction-mixes
pip5k7 insertion pip5k8 insertion
Solutions Fw/Rv Rv/LB Fw/Rv Rv/LB Sample DNA (µL) 1 1 1 1 DreamTaq (µL) 0.1 0.1 0.1 0.1 DreamTaq Buffer (µL) 2 2 2 2 dNTP Mix (µL) 2 2 2 2 Primer pip5k7-1 Fw (µL) 2 - - - Primer pip5k7-1 Rv (µL) 2 2 - - Primer pip5k8-2 Fw (µL) - - 2 - Primer pip5k8-2 Rv (µL) - - 2 2 Primer LB (µL) - 2 - 2 Autoclaved MQ H2O (µL) 10.9 10.9 10.9 10.9
Table 3. PCR conditions used
Initial denaturation 95 °C, 2 min
Denaturation 95 °C, 20 sec
37x
Annealing 53 °C, 30 sec
Extension 72 °C, 2.5 min
Final extension 72 °C, 6 min
2.7.4. DNA electrophoresis
The PCR results were resolved by electrophoretic separation. Agarose gels were made with a final concentration of 1 % (w/v) agarose in 0.5x TAE, which was also used as running buffer. DNA was stained by applying 1.5 μL of ethidium bromide (EtBr) in 40 mL of melted agarose gel. DNA samples were mixed with loading buffer (6x Orange DNA Loading Dye, Thermo Scientific™) and O'GeneRuler™ 1 kb DNA Ladder Plus, ready-to-use (Thermo Scientific™) was used as the molecular weight marker.Gels were visualized under UV light in InGenius3 UV transilluminator (Syngene) and
23 2.8. GUS-staining
Seedlings (5-6 days-old) were transferred into a 12-well plate (one seedling per well) and 90 % cold acetone was added. After an incubation of 20 minutes at room temperature, the acetone was removed and added the staining solution (0.25 % Triton X-100, 50 mM NaHPO4 (pH 7.2), 2 mM
K4[Fe(CN)6] (potassium ferrocyanide), 2 mM K3[Fe(CN)6] (potassium ferricyanide), 1 mM X-Glu).
The samples were incubated at 37 °C for 5 hours and, after that, the staining solution was replaced by EtOH 70 %. The samples were left overnight at room temperature and in the next day the EtOH was replaced by a fresh one to extract all the chlorophyll from the plants. Samples were stored at 4 °C and for microscope visualization it was used glycerol 10 % in the slides.
2.9. Statistical analysis
Statistical analysis and graphic representation of the results was performed using GraphPad Prism version 6.01 for Windows (GraphPad Software, La Jolla California USA, www.graphpad.com).
For seed germination assays (experiment 2.3.) two independent experiments were done, each one with two or three replicate plates, containing 40 seeds for each genotype tested. The results presented are the combination of the two experiments and error bars represent SD. Statistical analysis of the results, 96 h after treatment, was done by one-way ANOVA, with Tukey’s post-hoc test for multiple comparisons, where significant statistical differences between mean values were represented by different letters. More two independent experiments were performed to evaluate the percentage of germination 216 h after stress, each one with four replicate plates, also containing 40 seeds per genotype. Results were organized and represented as above. Statistical analysis of these results was done running two-way ANOVA followed by Tukey’s test, comparing heat treatment and genotypes: different capital letters display significant differences between Control and Heat for each genotype, and different lower-case letters display significant differences when comparing genotypes, in each heat treatment (Control or Heat).
For seedlings survival assays (experiment 2.4.), 3 independent experiments were performed, being presented a representative result. Mean values were obtained from four replicate plates per genotype tested, each containing 30 seedlings. Statistical analysis and results’ representation were done as described above for seed germination assay evaluated at 96 h after treatment (experiment 2.3).
24
For root elongation assays (experiment 2.5.), 3 independent experiments were performed, being presented also only one representative result. Mean values were obtained from four replicate plates for each genotype tested, all containing around 6 seedlings each. Error bars represent the standard error of the mean (SEM) and statistical analysis of the results, 3 days after treatment, was done as described before. For the analysis of the number of lateral roots and the lateral root density, 5 days after the treatment, the replication used was the same and the statistical analysis of was done by two-way ANOVA followed by Tukey’s test, where the asterisk notation was used to express the statistical significance of comparisons (non-significant - ns p > 0.05; significant * 0.01< p ≤ 0.05; very significant ** 0.001<p ≤ 0.01; highly significant *** p ≤ 0.001).
One single experiment with four replicate plates per genotype tested, each containing around 30 seedlings was performed to determine the chlorophyll content and the weight of the aerial part of the seedlings (experiment 2.6.) Statistical analysis and results’ representation were done as described above for seed germination assay evaluated at 216 h after treatment (experiment 2.3).
25
27 3.1. Phenotypic analysis
When plants are heat-stressed, a complex response system is activated, suggesting that different genes may be involved in thermotolerance.
Arabidopsis thaliana is widely used for phenotypic characterization of knock-out mutants (Larkindale et al., 2005b; Yeh et al., 2012; Silva-Correia et al., 2014) and the most frequent parameters used for the detection of phenotypical changes are seedling survival, germination success and root growth (Silva-Correia et al., 2014). Other common analysis includes shoot and hypocotyl elongation, determination of plant fresh weight, cotyledon greenness and chlorophyll content, ion leakage and TBARS accumulation (Silva-Correia et al., 2014).
It is important to acknowledge that the contribution for thermotolerance of a given heat stress response gene may be different between tissues and across developmental stages of the plant life cycle (Yeh et al., 2012). Another aspect needed to be considered is the time-point chosen for determining the phenotypes, since “a basic aspect to heat-related phenotype assays is the range of temperatures and the treatment length”, being this way important performing time-course experiments for the phenotype in question in order to avoid masked alterations between the wild-type and mutant plants (Silva-Correia et al., 2014).
3.1.1. Seedlings survival
Different phenotypic assays can be used for evaluating heat tolerance in Arabidopsis, with the seedlings survival being one of the most commonly used (Yeh et al., 2012). In these assays, survival is generally scored based on tissue colour, considering to be viable the seedlings that remain green, actively growing and generating new leaves, after being submitted to heat (Silva-Correia et al., 2014). By contrast, the yellowing or bleaching of the cotyledons or leaves represent non-viable seedlings, since their photosynthetic activity has been compromised.
In relation to the experimental conditions used for assessing this phenotype, it is suggested that the immersion of the sealed plates in water baths is the most effective way to heat-stress the plants, comparing to heating blocks and growth chambers/ovens, mainly due to the better heat conductance of water relatively to air (Yeh et al., 2012). The plates should also not be piled up, once this organizational setting prevent an adequate heat transfer to the plates (Silva-Correia et al., 2014).
28
3.1.1.1. Basal thermotolerance
Assays in basal tolerance to heat stress in Arabidopsis thaliana are normally performed by exposing the seedlings to temperatures between 43 °C and 45 °C, for periods of 26 to 60 minutes, depending on the age of the seedlings (Larkindale et al., 2005b; Charng et al., 2007; Liu et al., 2011; Yeh et al., 2012). Prior experiments in A. thaliana carried out in our lab for assessing basal thermotolerance, have used 3 days-old seedlings and a heat shock of 44 °C for 36 minutes by submerging the sealed plates in a water bath. For that, these settings were also used in our present experiments (Figure 10).
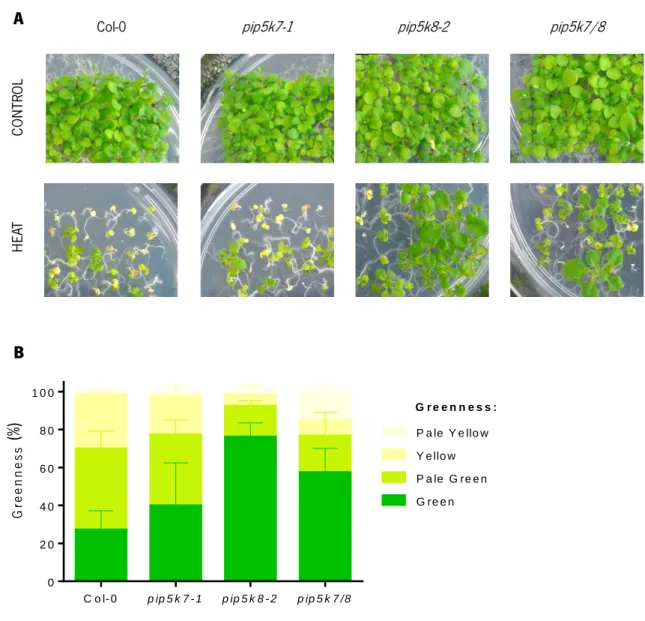
The viability of the seedlings after heat-stress treatment of wild type (Col-0) and the knock-out mutants (pip5k7-1, pip5k8-2 and pip5k7/8) was assessed in three independent experiments. The phenotypes obtained in a representative experiment are showed in Figure 11. Examining the plates, it is visible that more than half of the seedlings of the four genotypes continued growing after the heat shock treatment. However, it looks like there is a phenotype for pip5k8 mutants (pip5k8-2 and pip5k7/8), since its seedlings were not so affected by heat, presenting bigger and greener leaves comparing to the wild-type (Figure 11 A). It was also assessed the greenness of the seedlings classifying them in four classes according to the colour and colour density of their leaves (green, pale green, yellow and pale yellow), with the pip5k8-2 mutant seedlings showing a higher greenness than the other mutants and wild-type (Figure 11 B). The double mutant, despite having more dead seedlings (pale yellow) than the other mutants, presented the second highest percentage of green leaves and more developed seedlings. The performance of pip5k7-1 mutants was similar to the wild-type.
Figure 10. Schematic representation of the heat shock conditions used to evaluate basal thermotolerance
phenotypes for Arabidopsis thaliana seedlings. Seedlings (3 days-old) were subjected to heat shock at 44 °C for 0 min (Control) and 36 min (Heat Stress). Survival was determined 14 days after treatment.
29
Additional measurements were done in order to confirm the phenotypes obtained, such as the chlorophyll content (Figure 12-A) and the weight of the aerial part of the seedlings (Figure 12-B). The results obtained corroborate what was observed before (Figure 11), with the pip5k8-2 mutants having a significantly higher chlorophyll content than the other genotypes after heat stress. The weight of the aerial part of pip5k8-2 mutants was also significantly higher than that of the other genotypes and close to the weight of control seedlings. It looks like that pip5k8-2 mutants were
A B G re en n es s C o l- 0 p ip 5 k 7 - 1 p ip 5 k 8 - 2 p ip 5 k 7 /8 0 2 0 4 0 6 0 8 0 1 0 0 G re e n P a le G r e e n Y e llo w P a le Y e llo w G r e e n n e s s :
Figure 11.Seedlings survival assay for basal thermotolerance. Arabidopsis seeds were stratified (2 days
at 4 °C) and grown for 3 days on ½ MS Petri dishes with 1 % agar and 1 % sucrose, pH 5.7 with KOH, at 22 ºC (16 h photoperiod). The seedlings of wild type (Col-0) and mutants (pip5k7-1, pip5k8-2 and pip5k7/8) were treated with 0 minutes (Control) and 36 minutes at 44 ºC (Heat Shock) in a water bath. Plates were photographed 14 days after treatment (A) and the greenness of the tissue colour was evaluated at the same period (B). The results obtained are representative of 3 independent experiments. Mean values were obtained from four replicates per genotype tested, each containing around 30 seedlings. Error bars represent standard deviation (SD).
30
only slightly affected by the heat shock treatment in contrast to the seedlings of wild-type and pip5k7 knock-outs that showed a dramatic reduction (around 50 %) both in their chlorophyll content and aerial part weight.
Since these seedlings’ survival experiments were performed using round plates disposed horizontally, it was not possible to study what was happening to the roots. To address this problem, a new experiment was settled using square plates placed in an angle of 70°, being in this way possible to visualize roots’ growth (Figure 13-A). The main root length increment relatively to the day of the onset of treatment was calculated and present in Figure 13-B. Concordantly with what was observed for the aerial part of the seedlings, the pip5k8-2 mutants also perform differently from the wild-type in response to heat treatment, with some of the seedlings showing a more developed root system with an architecture similar to that of the wild-type (Control), that is characterized by long main roots with several lateral roots.
The better performance of the pip5k8 mutants in seedlings survival, chlorophyll content or relative main root length may indicate that is not the PIP5K8 but the PIP5K7 that is involved in basal thermotolerance. Similar results were found (Li et al., 2017) for other genes involved in thermotolerance (CER9 an HRD1A/1B), with 7 days-old Arabidopsis thaliana mutant seedlings of these genes showing a significantly better survival than wild-type after a heat shock of 1 h at 45
A B
Figure 12. Chlorophyll content and weight of the aerial part of seedlings used in the basal thermotolerance
treatment. 14 days after treatment, was determined: A – the chlorophyll content (µg/ seedling) and B - the weight (g) of the aerial part of the seedlings. Mean was estimated from four replicates, for each genotype tested, all containing around 30 seedlings each and error bars represent standard deviation. Statistical analysis of the results was done by two-way ANOVA, with Tukey’s multiple comparisons test, where different letters represent significant statistical differences.
C h lo ro p h y ll c o n te n t (µ g / s e e d li n g ) C O N T R O L H E A T 0 1 2 3 C o l- 0 p ip 5 k 7 - 1 p ip 5 k 8 - 2 p ip 5 k 7 /8 a a a b W e ig h t o f a e ri a l p a rt ( g ) C O N T R O L H E A T 0 .0 0 .1 0 .2 0 .3 0 .4 C o l- 0 p ip 5 k 7 - 1 p ip 5 k 8 - 2 p ip 5 k 7 /8 a a a b W e ig h t o f a e ri a l p a rt ( g ) C O N T R O L H E A T 0 .0 0 .1 0 .2 0 .3 0 .4 C o l- 0 p ip 5 k 7 - 1 p ip 5 k 8 - 2 p ip 5 k 7 /8 a a a b
31
°C, being suggested that they play negative roles in heat tolerance. On its turn, and associated with the PIP5K pathway, that originates PtdIns(4,5)P2 from the phosphorylation of PtdIns4P, Gao
and collaborators (2014), in their studies over the role of PLC3, a phospholipase that hydrolyze PtdIns(4,5)P2 and that plays a role in thermotolerance, have discovered that under heat shock plc3
mutant seedlings also showed serious growth delays, with only 30 to 40 % of survival rate, which is according to the results obtained for PIP5K7.
A way to confirm the possible involvement of the PIP5K7 in heat shock response or if PIP5K8 is playing a negative role in basal thermotolerance is preparing Arabidopsis lines overexpressing the pip5k7 and pip5k8 genes and analysing their survival after being subjected to similar heat shocks (results present at section 3.3.).
32
Figure 13. Relative main root (MR) length increment of seedlings survival assay for basal thermotolerance.
The treatment conditions are the same as described in Figure 11. Plates were photographed 13 days after treatment (DAT) (A) and the relative root length increment was determined for the same period (B). Mean was estimated from three replicates, for each genotype tested, all containing around 6 seedlings each.
A B R e la tiv e M R le n g th ( fo ld ) 0 1 0 2 0 3 0 1 3 D A T C o l- 0 p ip 5 k 7 - 1 p ip 5 k 8 - 2 p ip 5 k 7 / 8 R e la tiv e M R le n g th ( fo ld ) 0 1 0 2 0 3 0 1 3 D A T C o l- 0 p ip 5 k 7 - 1 p ip 5 k 8 - 2 p ip 5 k 7 / 8
33
3.1.1.2. Acquired thermotolerance
As previously described, acquired thermotolerance involves a prior acclimation of seedlings to moderately elevated temperatures before stressing the plants to high temperatures after a recovering time, generally of 2 hours (Mueller et al., 2015). For acclimation it is commonly used temperatures of 37 °C or 38 °C, during 1 to 2 hours, while the heat stress generally occurs at 44 °C or 45 °C for 2-3 hours (Hong & Vierling, 2000; Charng et al., 2006; Chen et al., 2006; Muench et al., 2016).
The stress conditions used in our experiments for assessing acquired thermotolerance with seedlings survival assay are schematically represented in Figure 14. For that, 3 days-old seedlings were acclimated at 37 °C for 1 hour, left to recover at 22 °C for 2 hours, and then submitted to heat stress of 45 °C for 0 hours (Control) and 2.5 hours (Heat Shock). The viability of the seedlings was scored 8 days after treatment, based on the tissue colour.
Three independent experiments were done and the viability of the seedlings after heat stress was determined again for the four genotypes assessed: Col-0 and the mutant T-DNA insertion lines pip5k7-1, pip5k8-2 and pip5k7/8. The phenotypes of a representative replicate are presented in Figure 15-A, while the viability, represented as “greenness”, for one representative experiment, is shown in Figure 15-B.
Figure 14. Schematic representation of the heat shock conditions used to evaluate acquired
thermotolerance phenotypes for Arabidopsis thaliana seedlings. Seedlings (3 days-old) were subjected to a prior acclimation (1 h at 37 °C), left to recover at 22 °C for 2 h and subjected to heat stress at 45 °C for 0 h (Control) and 2.5 h (Heat Shock). Survival was determined 8 days after treatment, based on the tissue colour of the seedlings.
34
The results obtained reveal that the pre-treatment of 37 °C for 1 hour didn’t have any lethal effect on seedlings, since all the seedlings of the four genotypes have survived and grew normally in control condition (100 % of green seedlings), where any further stress was applied (data not shown). When heat-stressed for 2.5 hours at 45 °C, the four genotypes showed a dramatic decrease in their seedlings’ viability comparing to control conditions, as it was expected. This experiment has demonstrated the presence of a phenotype for the pip5k7-1 mutant, with the seedlings of this mutant exhibiting a higher heat shock survival for acquired thermotolerance. The pip5k7-1 mutants showed a survival of around 60 %, while for the wild-type (Col-0) it was only around 25 %, which
Figure 15. Seedling survival assay for acquired thermotolerance. Seeds were stratified (2 days at 4 °C)
and grown for 3 days as described above. Seedlings of wild type (Col-0) and mutant lines (pip5k7-1, pip5k8-2 and pip5k7/8) were subjected to a prior acclimation (1 h at 37 °C), put to recover at 22 °C for 2 h and subjected to heat shock at 45 °C for 0 h (Control) and 2.5 h (Heat Shock). Plates were photographed 8 days after the onset of treatment (A) and survival was score for the same period (B), based on the tissue colour. The results obtained are representative of 3 independent experiments. Mean values were obtained from four replicates per genotype tested, each containing around 30 seedlings. Error bars represent standard deviation. Statistical analysis of the results was done by one-way ANOVA, with Tukey’s multiple comparisons test, where different letters represent significant statistical differences.
A B G re en n es s C o l- 0 p ip 5 k 7 - 1 p ip 5 k 8 - 2 p ip 5 k 7 /8 0 2 0 4 0 6 0 8 0 1 0 0 G re e n P a le Y e llo w a a a b G r e e n n e s s : (%)
35
means an improvement of 35 % in viability for pip5k7-1 seedlings. The pip5k8-2 mutant showed a slight improvement in their heat shock survival comparing to wild-type, however, it was not statistically significant. The pip5k7/8 mutant also presented a viability rate similar to the wild-type. The higher viability of pip5k7-1 knock-outs (where is encoded pip5k8 but not the pip5k7), suggest that PIP5K8 is involved in acquired thermotolerance, promoting an improvement of seedlings survival. When this gene is knocked-out, seedlings survival to heat stress was 30 % lower comparing to the pip5k7 mutant. Similar results were obtained in the study of the role of the heat-inducible transcription factor HsfA2, required for extension of acquired thermotolerance (Charng et al., 2007). They have observed a decrease in thermotolerance for hsfa2 mutant seedlings, that were more sensitive to heat shock after a prior moderated heat acclimation. Nevertheless, it looks like pip5k7 have a repressing role over pip5k8 during acquired thermotolerance for young seedlings, since the viability of the wild-type (where are encoded both the pip5k) was lower than the obtained for pip5k7-1 mutant (where is only encoded the pip5k8), and similar to the survival rate of pip5k8-2, indicating that this decrease in viability is due to the pip5k7 and not to the pip5k8. When both pip5k are knocked-out, the seedlings viability was also lower.
3.1.2. Root growth
When looking for Arabidopsis responses to temperature, another assay that is normally used is the root growth assay (Larkindale et al., 2005b; Chen et al., 2006). This assay consists in analysing how the roots grow after the seedlings are submitted to treatment. In this assay it was only assessed basal thermotolerance using for that 6 days-old seedlings. The seedlings were treated at 40 °C for 30 minutes by submerging the sealed plates into a water bath (Figure 16).
Figure 16. Schematic representation of the heat shock conditions used in root growth assays. Seedlings
(6 days-old) were subjected to heat shock at 40 °C for 0 min (Control) and 30 min (Heat Shock). Survival was determined 14 days after treatment.