eISSN: 2237-2083
DOI: 10.17851/2237-2083.26.4.1455-1488
Acoustic Models for the Automatic Identification
of Prosodic Boundaries in Spontaneous Speech
Modelos acústicos para a identificação automática
de fronteiras prosódicas na fala espontânea
Bárbara Helohá Falcão Teixeira
Universidade Federal de Minas Gerais, Belo Horizonte, Minas Gerais / Brazil [email protected]
Maryualê Malvessi Mittmann
Centro Universitário FACVEST, Lages, Santa Catarina / Brazil Universidade do Vale do Itajaí, Itajaí, Santa Catarina / Brazil [email protected]
Abstract: This work presents the results of the analysis of multiple acoustic parameters
for the construction of a model for the automatic segmentation of speech in tone units. Based on literature review, we defined sets of acoustic parameters related to the signalization of terminal and non-terminal boundaries. For each parameter, we extracted a series of measurements: 6 for speech rate and rhythm; 34 for duration; 65 for fundamental frequency; 4 for intensity and 2 measurements related to pause. These parameters were extracted from spontaneous speech fragments that were previously segmented into tone units, manually performed by 14 human annotators. We used two methods of statistical classification, Random Forest (RF) and Linear Discriminant Analysis (LDA), to generate models for the identification of prosodic boundaries. After several phases of training and testing, both methods were relatively successful in identifying terminal and non-terminal boundaries. The LDA method presented a higher accuracy in the prediction of terminal and non-terminal boundaries than the RF method, therefore the model obtained with LDA was further refined. As a result, the terminal boundary model is based on 20 acoustic measurements and shows a convergence of 80% in relation to boundaries identified by annotators in the speech sample. For non-terminal boundaries, we arrived at three models that, combined, presented a convergence of 98% in relation to the boundaries identified by annotators in the sample.
Resumo: Este trabalho apresenta os resultados da análise de múltiplos parâmetros
acústicos para a construção de um modelo para a segmentação automática da fala em unidades tonais. A partir da investigação da literatura, definimos conjuntos de parâmetros acústicos relacionados à identificação de fronteiras terminais e não terminais. Para cada parâmetro, uma série de medidas foram extraídas: 6 medidas de taxa de elocução e ritmo; 34 de duração; 65 de frequência fundamental; 4 de intensidade e 2 medidas relativas às pausas. Tais parâmetros foram extraídos de fragmentos de fala espontânea previamente segmentada em unidades tonais de forma manual por 14 anotadores humanos. Utilizamos dois métodos de classificação estatística, Random Forest (RF) e Linear Discriminant Analysis (LDA), para gerar modelos de identificação de fronteiras prosódicas. Após diversas fases de treinamentos e testes, ambos os métodos apresentaram sucesso relativo na identificação de fronteiras terminais e não-terminais. O método LDA apresentou maior índice de acerto na previsão de fronteiras terminais e não-terminais do que o RF, portanto, o modelo obtido com este método foi refinado. Como resultado, O modelo para as fronteiras terminais baseia-se em 20 medidas acústicas e apresenta uma convergência de 80% em relação às fronteiras identificadas pelos anotadores na amostra de fala. Para as fronteiras não terminais, chegamos a três modelos que, combinados, apresentaram uma convergência de 98% em relação às fronteiras identificadas pelos anotadores na amostra.
Palavras-chave: segmentação da fala; fronteiras prosódicas; fala espontânea.
Submitted on January 12th, 2018 Accepted on June 17th, 2018 1 Introduction
This paper presents results from an investigation that aims at the construction of a model for spontaneous speech segmentation based on acoustic parameters. Natural speech is segmented into intonation units, delimited by prosodic boundaries that signal the conclusion or continuity of discourse. These boundaries are acoustically signaled by parameters such as pitch reset, pauses and syllabic lengthening, among others.
Although we have by now a good overall understanding of different parameters involved in speech segmentation (for a review, see MITTMANN; BARBOSA, 2016), there is no approach that allows us to integrate them into a model that could be applied for the automatic detection of prosodic boundaries in spoken texts. Moreover, discrimination between terminal (conclusive) and non-terminal boundaries is essential, since this information
is key to the correct identification of syntactic relations inside the utterance, as well as its pragmatic meaning (for a discussion and demonstration regarding this argument see MONEGLIA, 2011; RASO; VIEIRA, 2016).
Therefore, our research aims to develop a tool that aggregates acoustic data of multiple acoustic parameters together with information about boundary type (terminal or non-terminal) obtained from human annotation of spontaneous speech input. The results will allow the creation of a computational tool for the automatic (or, at least, semiautomatic) detection of prosodic boundaries. Such tool would aid the compilation of spontaneous speech corpora, since it can make the speech segmentation process faster, saving time and effort, what could contribute to corpus linguistics in general.
This research represents an advance not only in the technological aspects of speech processing, but it implies in a better understanding about speech segmentation phenomena. Thus, we hope to contribute to the theory of speech, by promoting more accurate descriptions of phonetic phenomena involved in the linguistic processes that guide production and perception of terminal and non-terminal prosodic boundaries in spontaneous speech.
Prosodic segmentation of speech implies a series of methodological challenges. Boundaries are always signaled by phonetic phenomena, but those vary substantially in spontaneous speech. Working with non-natural and manipulated data provides comparable, high acoustic quality data, but represents enormous limitations when compared with the phenomena that occur in spontaneous, natural occurring data.
When we choose to work with spontaneous speech data, finding comparable speech segments is very difficult, and data with high acoustic quality may be hard to obtain. Besides, controlling variables one by one is not a possibility with spontaneous speech data. For these reasons, we employed statistic classification methods to arrive at models for automatic identification of terminal and non-terminal boundaries in spontaneous speech.
2. Speech segmentation based on prosodic cues
Speech is usually described as a “flow”, and identifying its segmental units is not a simple, straightforward, task. Segmentation of speech has been studied according to different theoretical perspectives. The syntactic approach proposes that the syntactic level of the sentence corresponds to a phonological level of the intonational phrase (COOPER; PACCIA-COOPER, 1980; SELKIRK, 2005). The pragmatic perspective states that prosodic parsing organizes speech by the demarcation of discourse or
information units (CRESTI, 2000; HALLIDAY, 1965; SZCZEPEK REED, 2012). The cognitive view studies the relation among units of speech and units of language processing by the brain (BYBEE, 2010; CHAFE, 1994; CROFT, 1995). Finally, the conversation analysis approach claims that breaks in the speech flow – cesuras – are granular by nature and the units they encompass cannot be discriminated into atomized categories, and so, segmentation analysis should regard the boundaries themselves instead of the units (AUER, 2010; BARTH-WEINGARTEN, 2016).
In this paper, we propose that a model for speech segmentation should primarily identify prosodic boundaries that listeners recognize in spontaneous speech. Perception of prosodic boundaries may vary, since there are boundaries that are more clearly signaled, or more prominent, than others.
Corpus-based observations and experimental research (BARBOSA, 2008; COUPER-KUHLEN, 2006; FUCHS; KRIVOKAPIC; JANNEDY, 2010; MITTMANN et al., 2010; MO, 2008; MONEGLIA; CRESTI, 2006; SCHUETZE-COBURN; SHAPLEY; WEBER, 1991; SWERTS; COLLIER; TERKEN, 1994) allow us to distinguish two boundary macrotypes: boundaries that signal discourse closure and boundaries that are not correlated to a closure. The first type is referred to in this paper as terminal boundary, and the second, non-terminal boundary. This two boundary macrotypes will be further discussed in the following sections. We also assume that the units delimited by those boundaries are the key for speech interpretation, as they mostly correspond to the organization of speech into information units (CRESTI; MONEGLIA, 2010; MONEGLIA, 2006), inside of which the morphosyntactic relations occur.
Most models for automatic speech segmentation aim to identify boundaries between phones and words, and then bootstrap syntactic relations from word sequences to arrive to the uttered sentence. The acoustic speech signal contains much of the information needed for extraction of the phonetic structure of the linguistic message (FOWLER, 1984). However, speech sounds blend together and cannot easily be separated, not only within words but also across words, due to speech coarticulation. Lexical, syntactic, and acoustic information are usually cues employed for word recognition, but some of them may work only for certain languages and all of them may be misleading in normal speech (for a discussion, see SANDERS; NEVILLE, 2000). Also, in spontaneous speech, syntactic and semantic relations can only be properly interpreted within the scope of units defined by prosody, such as utterances and tone units (BOSSAGLIA, 2016; CRESTI, 2014; IZRE’EL, 2011; MONEGLIA, 2011; RASO; VIEIRA,
2016). For these reasons, automatic models for speech segmentation that use the word as the base for segmentation are very complex and do not seem to be a good solution to spontaneous speech analysis. The best starting point for segmentation of the speech signal is prosody.
The role of prosody in speech segmentation is well acknowledged in linguistics literature. Among the functions of prosody, we can distinguish demarcation, i.e., marking boundaries of prosodic constituents, such as syllables, phonological words and groupings of speech in tone units (BARBOSA, 2012). According to Cruttenden (1997), a set of internal and external criteria can be applied to prosodic boundary identification. Among external criteria there are pre-boundary syllabic lengthening, presence of silent pause, changes in pitch level or direction. An example of internal criterion is the presence of a prominent syllable, called a nucleus, with a pitch movement. Crystal (1969) argues that aspiration is also a possible relevant acoustic parameter for boundary marking.
Considering the difficulty of applying these criteria in spontaneous speech, Cruttenden (1997) recommends the adoption of grammatical criteria, arguing that prosodic boundaries often co-occur with syntactic constituent limits. However, spontaneous speech corpora data show that, in many cases, there is no co-occurrence between prosodic and syntactic boundaries of constituents. Besides, adoption of grammatical criteria for prosodic boundary identification should be avoided, because it implies in describing a phonetic phenomenon by means of morphosyntactic categories.
Prosodic boundaries can be more or less perceptually prominent. The fact that boundaries do not constitute a categorical perceptual entity (AUER, 2010; BARTH-WEINGARTEN, 2016; BIRKNER, 2006; BOLINGER, 1972) is one of the reasons why their study is so complex. If some prosodic boundaries are very prominent and perceived by almost everyone, others show much less perceptual agreement among different speakers/listeners. When that is the case, many scholars end up making decisions about boundary marking based on linguistic theory, thus creating a circularity effect, as discussed by Brown et al. (1980) and Peters, Kohler and Wesener (2005). Therefore, in agreement with Auer and Barth-Weingarten, we believe that it is important to study the acoustic features that signal prosodic boundaries independently of the analysis of the units delimited by them.
According to Du Bois et al. (1992), prototypical prosodic units present: a coherent and unified pitch contour, pitch reset to the base level at the beginning of the unit, pause at the beginning of the unit, a high speech rate at the initial syllables of the unit, lengthening of one
or more syllables on the final portion of the unit. However, prosodic boundaries usually do not present all these features, so it is possible to divide them into two boundary types: “Full” boundaries, which have all the prototypical characteristics, and “partial” boundaries, which present only some of the prototypical characteristics. Because of the less precise demarcation of some boundaries, Du Bois (2008) complements the list of acoustic cues, including boundary tone, number of pitch accents, creaky voice, turn taking, rhythm and pitch changes.
This list of acoustic parameters related to boundary marking is supported by a great number of experimental research on various languages, such as English (COLE; SHATTUCK-HUFNAGEL; MO, 2010; MO; COLE; LEE, 2008)54 excerpts, 11-55-s duration each, German (BATLINER et al., 1995; FUCHS et al., 2010; KOHLER; PETERS; WESENER, 2001), Dutch (BLAAUW, 1994; SWERTS, 1997; SWERTS; COLLIER; TERKEN, 1994), Portuguese (BARBOSA, 2008; RASO; MITTMANN; MENDES, 2015)showing the interdependence between f0 and syllable-sized duration contours, showing the separate contributions of duration and f0 at minor prosodic boundaries, presenting a semi-automatic method for analysing the correlation between f0 and normalised syllablesized duration contours. Contrary to the observations in lab speech for isolated utterances, pitch accents are relatively frequent in BP (from 54 to 73 %of the phonological words and Mandarin (FON; JOHNSON; CHEN, 2011; TSENG; CHANG, 2008; TSENG et al., 2005) syllable duration, pause duration, and syllable onset intervals (SOIs, just to cite a few. This variety of parameters shows how complex the acoustic correlates of boundaries are. Also, even if certain parameters had been shown to be strong correlates of boundaries, there is still no consensus regarding how much each individual parameter contributes to explain boundary perception. This occurs because, in many cases, a given parameter may be a very strong boundary predictor, but it could be completely absent in many other boundary positions. This problem is discussed in more detail by Mittmann and Barbosa (2016).
Another issue that adds up to this complexity regards to the type of boundary and how acoustic parameters correlate with each type. From a perceptual point of view, it seems evident that prosodic boundaries are not all of the same type. Researchers usually refer to boundaries associated with the perception of discourse completion or boundaries that signal discourse continuation (PIERREHUMBERT, 1980; PIKE, 1945; SZCZEPEK REED, 2004). Therefore, one would expect two
sets of acoustic correlates: one for conclusive boundaries, another for continuative boundaries. However, as we will discuss in the next sections, boundary typology is more complex than the conclusive-continuative dichotomy, and as our results show, it is not possible to arrive at two well-delimited groupings of prosodic parameters.
2.1 Terminal boundaries
The first macrotype of prosodic boundary refers to the ruptures in the speech flow that correspond to the perception of discourse closure or conclusion. These terminal boundaries signal the completion (in most cases) of an utterance, that is a linguistic entity that has prosodic and pragmatic autonomy in spoken discourse, as it expresses the completion of a speech act (AUSTIN, 1962; CRESTI; MONEGLIA, 2010). Some researchers refer to these units as “spoken sentences”, or “sentence-like units”, since, from the syntactic point of view, utterances not always correspond to the grammatical notion of “sentence”. Terminal boundaries delimit utterances, which may be (or may be not) further parsed into smaller units by means of non-terminal boundaries.
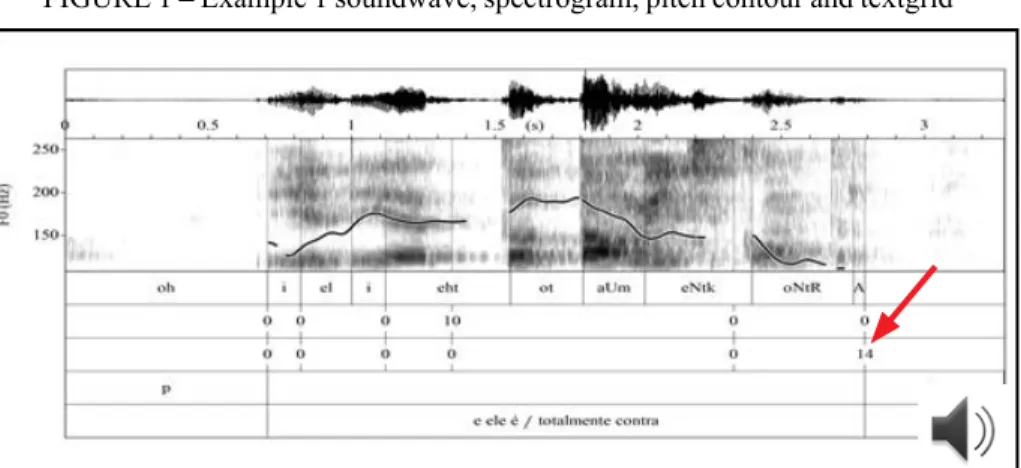
Example 11 illustrates an utterance delimited by what can be
considered a prototypical terminal boundary. In our research, in this example, the boundary at the end of the utterance was identified as terminal by 14 out of 14 annotators (indicated by the red arrow in Figure 1). Figure 1 shows the soundwave, spectrogram, pitch contour and textgrid of example 1. Textgrid has five tiers, representing, from top to bottom:
1st– V-V tier: vowel to vowel2 intervals with broad phonetic transcription in ASCII characters;
2nd – NTB tier: points indicate phonological words’ boundaries, numbers at each point indicate the number of annotators that perceived the point as a non-terminal boundary;
3rd – TB tier: points indicate phonological words’ boundaries, numbers at each point indicate the number of annotators that perceived the point as a terminal boundary;
1 All examples come from the samples prepared for this research, based spontaneous
speech corpus C-ORAL-BRASIL, as described in the “Methods” section.
4th – Pause tier: silent pauses intervals. 5th – Orthographic transcription tier.
(1) C-ORAL-BRASIL I, bfammn24
e ele é/ totalmente contra //
and he is totally against
‘And he is totally against it’
In this example, the terminal boundary occurs after the word “contra”. This utterance is formed by two tone units separated by the non-terminal boundary after the word “é”. The utterance on Example 1 ends with a silent pause, a falling pitch contour and lengthening of the pre-boundary V-V unit (Figure 1).
FIGURE 1 – Example 1 soundwave, spectrogram, pitch contour and textgrid
Other occurrences are not so prototypical in terms of parameter signaling, but still have a high prominence, as shown in Example 2. The boundary after the discourse marker “né” was perceived by all 14 annotators, but they were not in total agreement regarding if it was a terminal or non-terminal boundary. In Figure 2, it is possible to see that the boundary indicated by the red arrow does not present much of the prototypical features associated with boundaries (such as pitch reset, falling tone, pause), but 9 out of 14 listeners have identified it as a terminal boundary.
(2) C-ORAL-BRASIL II, bmidmn01
eu brinco que é um downhill / né // é uma descida que I joke that is a downhill disc is a fall that
cê fica se segurando you keep refl holding
‘I joke that it’s like a downhill / you know // It’s a fall where you keep holding yourself’
FIGURE 2 – Example 2 soundwave, spectrogram, pitch contour and textgrid
From data inspection, we observed that terminal boundaries are usually highly prominent. Even so, it is not possible to distinguish a unifying prosodic description for boundaries that signal terminality. It could be argued that this is possibly related to the fact that an utterance may express different illocutive contents, prosodically encoded in many ways. However, we highlight the fact that, regardless the type of unit delimited by the boundary, listeners can perceive a common quality among different types of utterance closures. So, even though there are many possible ways to express utterance terminality, it is reasonable to expect that are some acoustic cues that lead to the perception of “conclusiveness”.
Another aspect to be considered refers to utterances that are “abandoned”. For example, when the speaker drops the ongoing utterance and decides to start over, with a new one. Or, in another example, when the speaker is interrupted in mid utterance by external forces (for example, a loud noise or other participants in the conversation). In both cases, we
have the disruption of the utterance, which should be considered “closed”, but which is obviously not “concluded”.
This type of disfluency is also highly prominent for listeners, who usually have no doubt about the presence of a boundary. It is a very common phenomenon in spontaneous speech and implies extra challenges for an automatic recognition of prosodic boundaries, since these situations are not intentional. That means that there is no cognitive planning involved in the linguistic encoding of such events, hence, there is probably not a unifying set of prosodic parameters that indicate utterance interruption.
2.2 Non-terminal boundaries
The non-terminal macrotype refers to prosodic boundaries that parse the utterance into smaller tone units. These boundaries are usually referred to in the literature as “continuative” boundaries. We prefer not to adopt this terminology, since prosodic boundaries that present a clear signal of discourse continuity are just one of the subtypes of non-terminal boundaries. Many prosodic boundaries do not carry a positive sign of continuity, but at the same time seem to lack a positive sign of utterance conclusion.
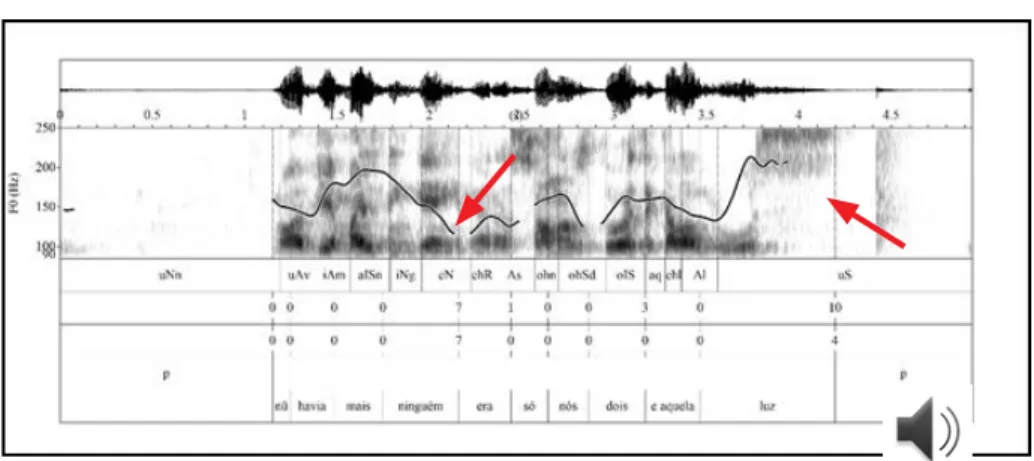
Example (3) presents two non-terminal boundaries: the first with a falling pitch after the word ninguém (“nobody”), usually associated with utterance finality; and the second with a rising pitch, after the word
luz (“light”), usually associated with utterance continuation (Figure 3).
(3) C-ORAL-BRASIL I, bfammn11
nũ havia mais ninguém / era só nós dois e aquela luz /
neg there.was else anybody was just we two and that light
‘there wasn’t anybody else / it was just the two of us and that light /’ For the first boundary, the annotators were divided in relation to the nature of the boundary: 7 annotators identified it as a non-terminal and 7 as a terminal boundary, where as for the second boundary, 10 out of 14 annotators in our study identified it as a non-terminal boundary. That shows that the annotators have weighted different parameters in deciding as for boundary type and that pitch contour alone is not a sufficient predictor for boundary type distinction. Figure 3 shows both boundaries, indicated by red arrows.
FIGURE 3 – Example 3 soundwave, spectrogram, pitch contour and textgrid
Example 4 and Figure 4 illustrate another type of non-terminal boundary, associated with utterance continuity. In this case, we have a filled pause delimited by two prosodic boundaries, indicated by the arrows (Figure 4).
(4) C-ORAL-BRASIL II, bnatmn01
e Platão que/ &he / critica / and Plato that / filler/ criticizes
‘and Plato that / eh / criticizes /’
Pauses always indicate a disruption of the utterance and are a highly relevant indicative of boundary. However, they can be associated with either one of the two boundary macrotypes, terminal or non-terminal.
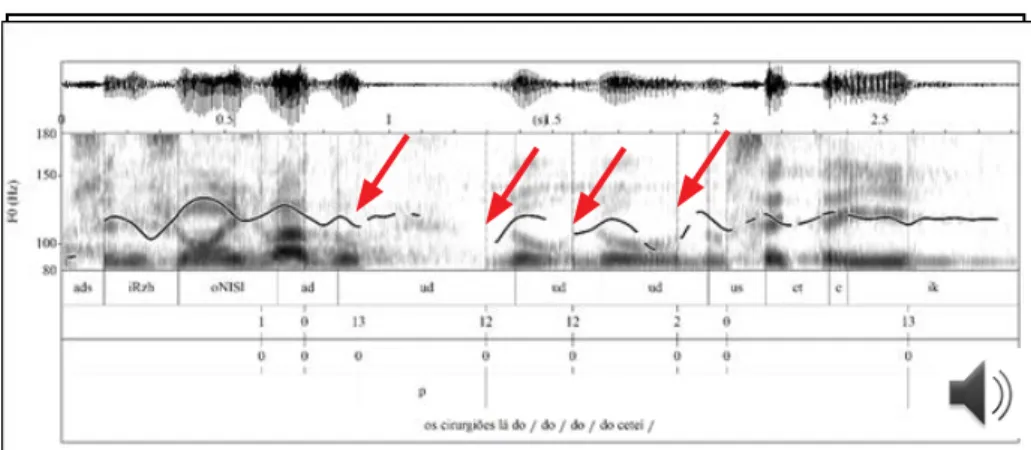
In example 5 we present another type of discourse disfluency, characterized by the lexical correction and/or lexical repetition of one or more items. This phenomenon is referred in this paper as “retracting” and is related to self-regulation in speech production, and it is usually formed by a single phonetic syllable. The acoustic features related to this type of non-terminal boundary make it challenging to model, since, similarly to utterance interruptions, they indicate a disfluency in speech and most likely are not realized through a consistent set of prosodic parameters.
(5) C-ORAL-BRASIL II, bnatmn02
os cirurgiões lá do / do / do / do ceteí / the surgeons disc from.the from.the from.the from.the ICU
‘the ICU surgeons /’
FIGURE 5 – Example 5 soundwave, spectrogram, pitch contour and textgrid
We observe different instances of prosodic boundaries with acoustic correlates that differ from the categories they are usually associated with. Therefore, prosodic boundaries do not appear to be discrete categories, but rather partially stable instances, which are signaled through the variation of many acoustic parameters, as proposed by Barth-Weingarten (2016). Thus, the first step in the study of prosodic boundaries must consist in describing
the two more perceptually stable macrotypes, terminal and non-terminal, and then refine the study from that starting point.
Examples like the ones discussed here justify the hypothesis of the existence of more than two types of boundaries. They also explain the fact that some prosodic boundaries are highly prominent and perceived by (almost) all people, while others are not. Our operational hypothesis is that boundaries that are perceived by a higher number of people have more prototypical acoustic correlates, which are used more frequently in the language to signal terminality or non-terminality.
3. Methods
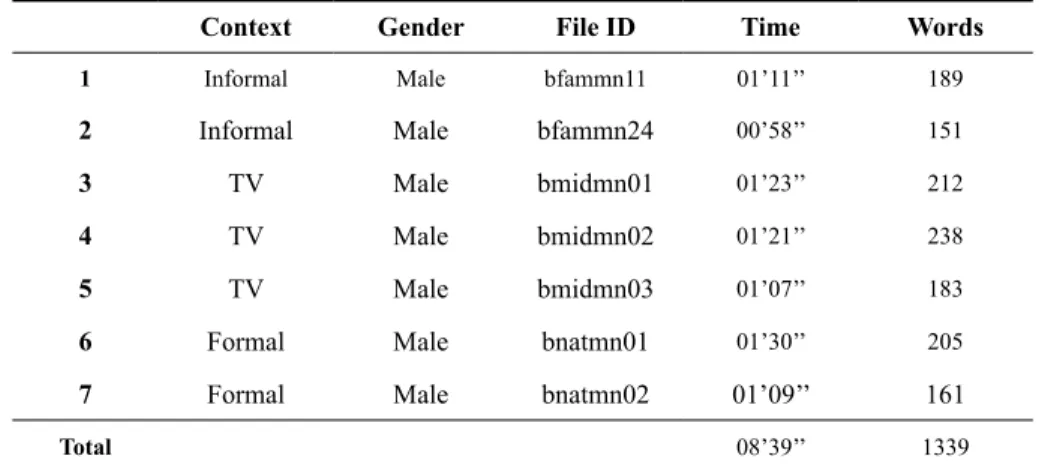
We extracted 7 excerpts of monological speech from Brazilian Portuguese spontaneous speech corpora C-ORAL-BRASIL I (RASO; MELLO, 2012) for informal speech and C-ORAL-BRASIL II (RASO; MELLO, in preparation) for formal and TV speech. The sample comprises a total of 1,339 words and 8 minutes and 39 seconds of male voices (Table 1).
TABLE 1 – Sample description
Context Gender File ID Time Words
1 Informal Male bfammn11 01’11’’ 189
2 Informal Male bfammn24 00’58’’ 151
3 TV Male bmidmn01 01’23’’ 212
4 TV Male bmidmn02 01’21’’ 238
5 TV Male bmidmn03 01’07’’ 183
6 Formal Male bnatmn01 01’30’’ 205
7 Formal Male bnatmn02 01’09’’ 161
Total 08’39’’ 1339
We chose to perform this study using only the male monological speech because fundamental frequency differs a lot between men and women, and so we wanted to exclude the gender variable in this study. The methodological procedures are described in the following sections.
3.1. Data preparation
Each excerpt was independently segmented by fourteen annotators. Subjects were given the audio and transcript files with no punctuation or annotation besides turn separation and speaker identification. Annotators were asked to add mark-ups to the transcripts corresponding to their perception of prosodic boundaries, using the following symbols: single slash (/) for non-terminal boundaries and double slashes (//) for terminal boundaries. All subjects had already had some experience in prosodic segmentation of speech. Transcripts of all annotators were aligned word by word and the total number of annotators that signaled each position to the right of a word as a boundary was taken into account.
It is important to stress that different annotators may assign different boundary types to the same datum (see Example 3). For that reason we counted each boundary type separately. For this study, we decided that the model should consider as a boundary position every occurrence where at least 7 annotators (50%) signaled it as a terminal or a non-terminal boundary. That is, for the terminal boundary model, 7 or more annotators must have signaled the position as a terminal boundary; and the same for the non-terminal boundary model.
Additionally, after some initial tests, we decided to eliminate from the sample, all instances of non-terminal boundaries following retracting, filled pauses and the word “né”, given the high number of classification errors in those contexts.
Table 2 shows the total number of perceived boundaries in the sample.
TABLE 2 – Frequency of terminal and non-terminal boundaries perceived by at least 7 annotators
Boundary macrotype Frequency %
Terminal 70 24
Non-terminal 225 76
Total 295 100
In the next phase, all speech excerpts were annotated in Praat (BOERSMA; WEENINK, 2015) by creating a Textgrid with 5 tiers: an interval tier for Vowel to Vowel (V-V) broad phonetic transcription
(ASCII characters); a point tier for the number of subjects that identified each point as a non-terminal boundary (range 0-14); a point tier for the number of subjects that identified each point as a terminal boundary (range 0-14); an interval tier for silent pauses; an interval tier for orthographic transcription.
V-V units comprise the time between the onset of a vowel up to the onset of the next vowel and represent a phonetic syllable. V-V segmentation is adopted instead of a (phonological) syllabic segmentation because phonetic syllables represent more accurately the rhythmic structure of utterances (BARBOSA, 1996, 2006).
3.2. Acoustic parameters and data extraction
Based on literature review, a set of acoustic parameters was defined, to determine which parameters are better boundary correlates. Acoustic parameters are divided into five classes: a) speech rate and rhythm; b) standardized V-V duration; c) fundamental frequency (F0); d) intensity; e) silent pause.
Acoustic analysis considers each boundary in its surrounding context, and prosodic boundaries will always coincide with boundaries of phonological words. Thus, the context for analysis is defined as 21 V-V units centered at a given phonological word boundary. This includes positions signaled by annotators as boundaries or non-boundaries. That means two windows of analysis, one including 10 V-V units to the left and one with 10 V-V units to the right of a position in analysis plus the V-V unit that starts at the current position.
Table 3 shows a summary of the measurements extracted for prosodic analysis, divided into global and local. Global measurements are calculated considering the values from left and right windows, plus the difference between those values at a phonological word boundary position. Local values are calculated for every single V-V unit inside the left and right windows.
TABLE 3– Summary of acoustic parameters
Class Type Measurement
Speech rate
and rhythm Global
Rate of V-V units per second (right window context, left window context and difference) Rate of non-salient V-V units per second
Standardized segment duration
Local Mean of smoothed z-score (adjacent right context, adjacent left context and difference)
Global
Mean of smoothed z-score (right window context, left window context and difference)
Standard deviation of smoothed z-score (right window context, left window context and difference)
Skewness of smoothed z-score (right window context, left window context and difference) Peak rate of smoothed z-score (right window context,
left window context and difference)
Fundamental frequency
Local
F0 median for each V-V (left and right V-Vs in window and difference at window center) in semitones re 1 Hz First derivative of F0 median for each V-V unit (left and right V-Vs in window and difference at window center) in semitones re 1 Hz/s
Global
Mean of F0 medians (right window context, left window context and difference) in semitones re 1 Hz
Standard deviation of F0 medians (right window context, left window context and difference) in semitones re 1 Hz
Skewness of F0 medians (right window context, left window context and difference)
Mean of F0 median first derivative (right window context, left window context and difference) in semitones re 1 Hz/s Standard deviation of F0 median first derivative (right window context, left window context and difference) in semitones re 1 Hz/s Peak rate of smoothed F0 peaks per second (right window context,
left window context and difference) Intensity
Local Mean spectral emphasis for V-V unit at window center in dB Global Mean spectral emphasis (right window context,
left window context and difference) in dB Pause Local Pause presence (0 = absence or 1 = presence)
Data extraction was performed through BreakDescriptor (BARBOSA, 2016), a Praat script developed from ProsodyDescriptor (BARBOSA, 2013). BreakDescriptor calculates and extracts acoustic data from every V-V unit (phonetic syllable) of the analysis context, which comprises 10 units to the left and 10 units to the right of the phonetic syllable under analysis plus the phonetic syllable itself. That comprises a total of 111 acoustic measurements for each position, according to the variables described in Table 3.
3.3 Evaluation of classification methods
Our goal is to arrive to a set of acoustic parameters that can identify the chance that any given phonological word boundary corresponds to a terminal prosodic boundary, a non-terminal prosodic boundary or none. Thus, we search for a model that assigns a weight to each acoustic parameter and ensures the greatest possible discrimination between any of the two macrotypes of prosodic boundaries and the absence of prosodic boundaries.
For this purpose, we tested two classification methods: Random Forest (RF) and Linear Discriminant Analysis (LDA). These methods of statistical classification were used to obtain hierarchical classification models based on the observation of the predictor variables, in this case acoustic parameters (Table 3). This process makes it possible to identify the combination of measurements and weights that can best explain the perceptual segmentation performed by human annotators. LDA and Random Forest are two statistical techniques that result in different models, While LDA calculates association through linear regression, Random Forest uses decision trees, also called decision nodes.
Calculations were performed with the R environment for statistical computing (R CORE TEAM, 2017). The LDA method is part of the MASS package (VENABLES; RIPLEY, 2002) – function lda(). The RF method is found in the randomForest package (LIAW; WIENER, 2002) – function randomForest(x, ntree=100, proximity=TRUE).
For the evaluation of both methods we verified results for both a training stage and a test stage. During the training stage, the classification method infers weights of predictor variables and performs a multivariate analysis of data, to arrive at statistical correlations between predicted (boundary presence or absence) and predictor variables (acoustic parameters) for all groups. The test stage evaluates the effectiveness of
the classification method in distinguishing the groups of boundary vs. non-boundary. We created two separate samples, one for training and one for testing. The training set consisted of a random selection of 70% of the V-V units in our data, whereas the test set consisted of the remaining 30% of the V-V units.
For both classification methods, we considered the presence and the absence of a certain boundary type, for both, terminal and non-terminal boundaries, building a separate model for each. Thus, in the terminal boundary model, absence of boundary includes also the instances of non-terminal boundaries; and in the non-terminal boundary model the absence of boundary includes also the instances of terminal boundaries.
We also consider the predictive power of LDA and RF. The prediction shows hits and false alarms for the dataset. After an initial evaluation phase, the LDA method presented the best results for both boundary types, producing a better match to the perceptual segmentation. Therefore, the LDA method was further refined, in order to improve the performance of the classifier as well as to reduce to a minimum the number of variables used for classification.
3.4 LDA refinement
LDA refinement consisted in identifying the most and least relevant variables among the 111 acoustic parameters collected by
BreakDescriptor. The gradual elimination of parameters allowed us
to achieve the highest percentage of hits for boundary presence and, the lowest percentage of false alarms in points perceived as absent of boundary as well as a minimum set of predictors, which allows to reduce the window extension around each predicting position.
For the refinement, we also split the set into a training set with 70% of random positions and a test set with the remaining 30%.
The LDA model refinement was carried out in two phases. In the first phase, the measurements extracted by BreakDescriptor were gradually removed from each model by discarding the ones with the lowest weights. In the second phase, measurements were excluded from the model based on the phonetic phenomena they represent, based on literature review. Thus, the less relevant phonetic phenomena were eliminated. This process aimed at reducing the “noise” in the models, increasing the proportion of hits and reducing the proportion of false alarms with a reduced set of acoustic predictors.
Finally, we investigated the hypothesis that the non-terminal boundaries in the dataset represent different boundary sub-types, signaled by different groupings of acoustic parameters. For this, we did not perform training and testing. Instead, in order to maximize our available sample, we used the entire dataset, except all instances of boundaries identified by 7 or more annotators as terminal boundaries. We then performed a cluster analysis to identify possible groups of similar non-terminal boundaries. Clusters were calculated using the complete linkage method, through R environment for statistical computing (R CORE TEAM, 2017), with the function hclust(). The dissimilarity matrix for the cluster analysis was calculated using the Euclidean method with the function dist() from a table of correlations of parameters obtained by Pearson’s coefficient, with the function cor(x, method=“pearson”)^2. All these functions belong to the stats package included in R core.
4. Results
4.1 RF and LDA Evaluation
Evaluation of models generated by RF and LDA classification methods took into consideration all 111 acoustic parameters as predictor variables for presence or absence of terminal and non-terminal boundaries. Table 4 shows absolute values for identification of boundaries. These results show that the LDA model identified a higher number of terminal boundaries, and was also able to identify the absence of terminal and non-terminal boundaries in a higher number of occurrences.
TABLE 4 – Evaluation of RF and LDA, absolute frequency of boundary identification
Boundary RF LDA
Terminal Non-terminal Terminal Non-terminal
Presence 47 185 75 142
Absence 785 646 1076 1010
Based on these results and the data from the perceptual annotation of prosodic boundaries (Table 2), we calculated the predictive power of the models generated by each classification method. The predictive power establishes the percentage of hits and false alarms for each boundary
macrotype. A hit indicates that the statistical model was able to identify a boundary that was perceived as such by at least 50% of human annotators. A false alarm means that the model predicts a boundary where human annotators did not perceive one.
We obtained the following results:
a) Terminal boundaries: RF predicted 28% of terminal boundaries
correctly, whereas it has only 1% of false alarms. LDA, on the other hand, has 57% of terminal boundaries hits and 2% of false alarms. b) Non-terminal boundaries: RF predicted 19% of terminal
boundaries correctly, whereas it has only 6% of false alarms. LDA, on the other hand, has 38% of terminal boundaries hits and 5% of false alarms.
Based on this, we proceed with the refinement of the models generated by the LDA classifier.
4.2 Refining the LDA model for terminal boundaries
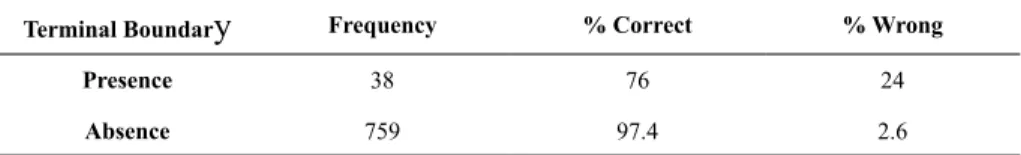
The first model included all 111 acoustic parameters extracted by BreakDescriptor. Frequency of terminal boundaries and the model predictive power are presented in Table 5. For the model with all 111 parameters, the LDA classifier produces 76% of hits and 24% of false alarms for terminal boundaries. LDA model showed 97.4% correct prediction for the absence of terminal boundaries.
TABLE 5 – Frequency of boundary identification and predictive power of model for terminal boundaries with 111 acoustic parameters
Terminal Boundary Frequency % Correct % Wrong
Presence 38 76 24
Absence 759 97.4 2.6
We progressively removed the least relevant acoustic parameters based on phonetic criteria. The model that presented the best results for terminal boundary classification used 20 of the 111 parameters. Table 6 shows the results of performance of this final model for terminal boundaries. The model reached a convergence with human annotation of 80% for boundary presence and 92% for boundary absence.
TABLE 6 – Frequency of boundary identification and predictive power of model for terminal boundaries with 20 acoustic parameters
Terminal boundary
Training Test
Freq. % Correct % Wrong Freq. % Correct % Wrong
Presence 45 80 20 25 80 20
Absence 837 95.2 4.8 319 92 8
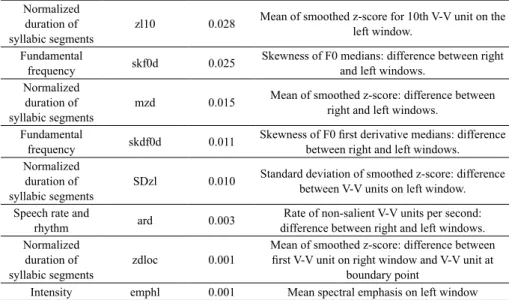
The set of parameters that constitute the model for terminal boundaries is listed in Table 7. Results show that pauses are the most relevant parameters for classifying a boundary as terminal. The next parameters indicate changes in pitch direction and pitch reset, followed by pre-boundary syllabic lengthening and changes in speech rate. Finally, the relative intensity in the pre-boundary syllable also contributes to the identification of terminal boundaries.
TABLE 7 – Parameters for identification of terminal boundaries according to statistical weight
Parameter class Abbrev. Weight Global/local parameter measurement
Pause psdur 2.641 Pause duration after V-V unit. psp 1.948 Pause presence after V-V unit.
Fundamental frequency
f0meddloc 0.329 First derivative of F0 median: difference between V-V at boundary and first V-V to the right. df0medr1 0.264 First derivative of F0 median for 1st V-V unit on right window.
df0medl 0.257 Mean of F0 median first derivative on the left windows. sddf0d 0.157 Standard deviation of first derivative of F0 median: difference between right and left V-V unit. Normalized
duration of
syllabic segments prd 0.101
Peak rate of smoothed z-score: difference between right and left windows.
Fundamental frequency
sdf0l 0.091 Standard deviation of F0 medians on left window. df0medl10 0.066 First derivative of F0 median for 10th V-V unit on left window.
f0rl 0.033 Peak rate of smoothed F0 peaks per second on the left windows. df0meddloc 0.032 First derivative of F0 median: difference between 1st V-V unit on right window and V-V unit at
boundary point.
Normalized duration of
syllabic segments zl10 0.028
Mean of smoothed z-score for 10th V-V unit on the left window.
Fundamental
frequency skf0d 0.025 Skewness of F0 medians: difference between right and left windows. Normalized
duration of
syllabic segments mzd 0.015
Mean of smoothed z-score: difference between right and left windows.
Fundamental
frequency skdf0d 0.011 Skewness of F0 first derivative medians: difference between right and left windows. Normalized
duration of
syllabic segments SDzl 0.010
Standard deviation of smoothed z-score: difference between V-V units on left window. Speech rate and
rhythm ard 0.003 difference between right and left windows.Rate of non-salient V-V units per second: Normalized
duration of
syllabic segments zdloc 0.001
Mean of smoothed z-score: difference between first V-V unit on right window and V-V unit at
boundary point
Intensity emphl 0.001 Mean spectral emphasis on left window The model for terminal boundaries is consistent with the description of prototypical “conclusive” boundaries found in the literature. The model presents a clear hierarchy of acoustic parameters and also describes their relative importance. Additionally, it highlights the relevance of global measurements. That reinforces the notion that prosodic boundaries are not a localized phenomenon, but are related to the prosodic structuring of the utterance.
4.3 Refining the LDA model for non-terminal boundaries
The first model for non-terminal boundaries included all 111 acoustic parameters extracted by BreakDescriptor. Frequency of non-terminal boundaries and the model predictive power are presented in Table 8. The LDA classifier produces 39% of hits and 61% of false alarms for non-terminal boundaries. LDA model showed 94.9% correct prediction for the absence of terminal boundaries.
TABLE 8 – Frequency of boundary identification and predictive power of model for non-terminal boundaries with 111 acoustic parameters
Non-terminal Boundary Frequency % Correct % Wrong
Presence 179 39 61
In comparison with the first model for terminal boundaries, this result indicates a lower predictive power, with a higher number or false boundary identification. Non-terminal boundaries seem to be signaled by more diverse parameters that appear not to fit into a single group, thus, they present greater variety of sub-types than terminal boundaries, thus corroborating the notion of boundary macrotypes.
By progressive elimination of boundaries according to phonetic criteria, we arrived at a second model with 9 parameters. Frequency of boundary identification and predictive power are presented in Table 9. We observe little improvement when comparing tests results in Tables 8 and 9. Although boundary hit frequency is now 50%, the number of false alarms decreased 11% in comparison with the previous model.
TABLE 9 – Frequency of boundary identification and predictive power of model for non-terminal boundaries with 9 acoustic parameters
Terminal boundary
Training Test
Freq. % Correct % Wrong Freq. % Correct % Wrong
Presence 60 37.2 62.8 32 50 50
Absence 685 95.1 4.9 257 92.8 7.2
Since the model could not be further improved, we decided to investigate the hypothesis that this dataset represents more than one sub-type of non-terminal boundary. We used the entire dataset for these last rounds of refinement (instead of using 70% for training and 30% for testing as in previous phases) and excluded instances of terminal boundaries (see Methods).
In the first round, we tested our dataset with Model 1 (9 parameters). On the next round, we took all instances of non-terminal boundaries and boundary absence that were not identified correctly by Model 1 to generate Model 2 (10 parameters). We applied the same procedure one more time, taking all instances of non-terminal boundaries and boundary absence that were not identified by Model 2 to generate Model 3 (8 parameters). These 3 models accounted for 220 (out of 225, see Table 2) of non-terminal boundaries in our dataset.
Table 10 shows the frequency of identification of prosodic boundaries and also the predictive power for the three models. With
this method, we increased the hits and decreased the number of false alarms in all three new models in comparison to the preceding models. The three new models capture, with more detail, the differences among distinct subtypes of non-terminal boundaries.
Model 1 identified more boundaries (69% of the total boundaries automatically assigned by all three models), but, at the same time, it had the worst convergence with human annotators, with 68% hits and 32% of false alarms, and also the worst performance identifying boundary absence. Model 2 identified 57 boundaries (26%) and had the best convergence with human annotators, with 78% of hits and 22% of false alarms. Model 3 identified very few boundaries (5%) and has the best convergence for boundary absence identification.
TABLE 10 – Frequency of boundary identification and predictive power of 3 models for non-terminal boundaries
Model
Boundary presence Boundary absence
Freq. % Correct% Wrong% Freq. % Correct% Wrong% Model 1 – 9 parameters 152 69 68 32 125 58 78 22 Model 2 – 10 parameters 57 26 78 22 52 24 80 20 Model 3 – 8 parameters 11 5 69 31 37 17 88 12
Table 11 presents the list of prosodic parameters selected by each model. The first column shows the rank for all parameters. For each model, the first column indicates the abbreviations assigned for predictors and the statistical weight for the measurement; the second column has a full description of the measurement calculated for each parameter. All models are composed by a different set of acoustic measurements.
TABLE 11–Models for identification of non-terminal boundaries – parameters ranked by statistical weight
Rank Model 1 – 9 parameters Model 2 – 10 parameters Model 3 – 8 parameters
1st zl0 4.5 Mean of smoothed z-score of V-V unit at boundary point srl 0.72 Rate of V-V units per second on the
left window prl 151.6 Peak rate of smoothed z-score on left window 2nd zr1
4.4 Mean of smoothed z-score 1st right sddf0l0.63
Standard deviation of F0 median first derivative on left window prd 150.6 Peak rate of smoothed z-score - difference between right and
left window 3rd zdloc 4.2 Mean of smoothed z-score - difference between 1st V-V on right window and and V-V unit at boundary point sdf0l 0.47 Standard deviation of F0 medians on left window prr 149.5 Peak rate of smoothed z-score on right window 4th psp
2.6 Pause presence ard (*)0.45
Rate of non-salient V-V units per second - difference
between right and left windows sdf0r 0.5 Standard deviation of F0 medians on right window 5th psdur
2.3 Pause duration f0medl0.37
Mean of F0 medians left window context SDzl 0.3 Standard deviation of smoothed z-score on left window 6th ard (*) 0.3 Rate of non-salient V-V units per second - difference between right and left windows
f0rd 0.21
Peak rate of smoothed F0 peaks per second difference of right and left windows
df0medr1 0.3 First derivative of F0 median for 1st V-V unit on the right 7th srd 0.3
Rate of V-V units per second - difference between right and left
windows f0meddloc 0.10 F0 median - difference between last V-V unit on the left window and first unit on the
right df0medl10 0.2 First derivative of F0 median for 10st V-V unit on the left 8th sdf0d 0.2 Standard deviation of F0 medians - difference
between right and left windows f0med0 0.09 F0 median of V-V unit at boundary point df0meddloc 0.1 F0 median - difference between first V-V
unit on the right window and V-V unit at boundary point 9th zl10 0.2 Mean of smoothed z-score for 10th V-V unit on the left window
f0medr1 0.05 F0 median of V-V unit at 1st V-V unit on the right 10th emphl 0.01 Mean spectral emphasis on the left window (*) measurement present in more than one Model.
Model 1 identifies boundaries signaled through parameters related mainly to the organization of phonetic syllables in time, like duration of phonetic syllables (zl0, zr1, zdloc, zl10), presence and duration of pause (psp, psdur) and speech and articulation rates (srd, ard), with only acoustic parameter related to pitch movements (sdf0). The most relevant measurements in Model 1 regard local, duration related, parameters. Model 2 identifies non-terminal boundaries based on pitch excursion, reset and prominence (sddf0l, sdf0l, f0medl, f0rd, f0medloc, f0med0, f0medr1), speech and articulation rates (srl, ard) and, in a lower degree, intensity (emphl). Global pitch parameters are the most relevant for Model 2.Model 3 identifies boundaries signaled mainly through saliences in syllabic durations (prl, prd, prr, SDzl) and local variations in pitch (sdf0r, dfmedr1, dfmedl10, dfmeddloc). Global duration parameters are the more relevant in Model 3.
Figure 5 shows the clusters obtained for each model, acoustic parameters are identified by the abbreviations shown in Table 11. Clusters allow us to detect subtypes of boundaries and a more detailed view of the relevant parameters for boundary identification through subgroups of boundary predictors. For each subgroup in each model, the division of parameters mostly falls into the broad classes of prosodic parameters: speech rate and rhythm; segment duration; fundamental frequency, intensity and silent pause.
Model 1 presents 2 main groups and 6 subgroups of parameters. On the left side, the first main group aggregates global parameters with lower weight that indicate speech and articulation rates and pitch variation. On the right side, the second main group presents local parameters with higher weight related to syllabic lengthening.
Model 2 has three main groups and 6 subgroups. The left main group contains global parameters that indicate speech and articulation rates and pitch prominences (related to pitch accents). The center main group includes two global parameters that indicate pitch variations. The right main group combines one local and three global parameters related to pitch movements and a global parameter of intensity.
Model 3 consists of 2 main groups and 5 subgroups. The first main group on the left aggregates local parameters that indicate abrupt changes in pitch. Finally, the last group on the right is composed only by global parameters. It combines four duration parameters related to duration saliences and rhythmic variations and one parameter indicating pitch variations.
The clusters corroborate the notion that prosodic boundaries are a complex and granular phenomenon, that is, the non-terminal category encompasses boundaries signaled by different sets of acoustic parameters, which probably correlate with different boundary sub-types.
5. Final remarks
The results indicate that the Linear Discriminant Analysis classifier provides better models for the terminal and non-terminal boundary macrotypes. After the refinement of the model generated by LDA, we were able to attest the adequacy of this method. Despite the number of false alarms, the models represent a good fit regarding the decisions made by annotators in our dataset.
Our results point to a higher degree of predictive performance related to terminal boundaries. The resulting model has a higher number of hits and fewer mistakes in relation to non-terminal boundaries. At least in the database used in this study, signalization of utterance conclusion seems to be more typified, while signalization of boundaries from the non-terminal macrotype appears to be more stratified. Another question that arises from this stratification is if there are linguistic or perceptual correlates for the different boundary Models and its subgroups. Further tests with more diverse data are needed to verify these hypotheses.
Other line of investigation refers to the analysis of errors for each model. These instances could reveal finer details regarding segmentation. Do these instances represent annotators ambiguity in boundary identification? Or are there other non-terminal boundary sub-types that are just under-represented in the sample? How many of these errors are due to disfluencies (interruption, time-taking, retracting) and is it possible to model those phenomena? Understanding the contexts where the model does not fit the human annotation would be useful to produce better models.
This research achieved its proposed goal to present models for the prediction of prosodic boundaries, based on spontaneous speech data. Next stages of this research would involve an increase in the database, so more extensive testing can be performed to produce robust models that can be used for the automatic segmentation of speech.
Authors’ Contributions
Both authors contributed to the design and implementation of the research, to the analysis of the results and to the writing of the manuscript.
References
AUER, P. Zum Segmentierungsproblem in der Gesprochenen Sprache.
InLiSt - Interaction and Linguistic Structures, Freiburg, v. 49, p. 1-19,
Nov. 2010. Available from: <http://www.inlist.uni-bayreuth.de/issues/49/ InList49.pdf>. Access on: 5 Dec. 2017.
AUSTIN, J. L. How to do things with words. Oxford: Oxford University Press, 1962.
BARBOSA, P. A. At least two macrorhythmic units are necessary for modeling Brazilian Portuguese duration. In: ETRW ON SPEECH PRODUCTION MODELING: FROM CONTROL STRATEGIES TO ACOUSTIC, 1., 1996, Autrans. p. 85-88. Available from: <http://www. isca-speech.org/archive_open/spm_96/sps6_085.html>. Access on: 5 Dec. 2017.
BARBOSA, P. A. BreakDescriptor. Script para o PRAAT. [Computer program]. 2016.
BARBOSA, P. A. Incursões em torno do ritmo da fala. Campinas: Pontes; Fapesp, 2006.
BARBOSA, P. A. Prominence-and boundary-related acoustic correlations in Brazilian Portuguese read and spontaneous speech. In: BARBOSA, P. A; MADUREIRA, S.; REIS, C. (Ed.). Speech Prosody. Campinas: ISCA, 2008. p. 257-260. Available from: <http://aune.lpl.univ-aix.fr/~sprosig/ sp2008/papers/id060.pdf>. Access on: 5 Dec. 2017.
BARBOSA, P. A. Conhecendo melhor a prosódia: aspectos teóricos e metodológicos daquilo que molda nossa enunciação. Revista de Estudos
da Linguagem, Belo Horizonte, v. 20, n. 1, p. 11-27, 2012.
BARBOSA, P. A. Semi-automatic and automatic tools for generating prosodic descriptors for prosody research. In: BIGI, B.; HIRST, D. (Eds.). Proceedings of the Tools and Resources for the Analysis of Speech
Prosody. Aix-en-Provence: Laboratoire Parole et Langage, 2013. v. 13, p.
86-89. Available from: <http://www.lpl-aix.fr/~trasp/Proceedings/19874-trasp2013.pdf>. Acess on: 22 Dec. 2015.
BARTH-WEINGARTEN, D. Intonation Units Revisited: Cesuras in talk-in-interaction. Amsterdam: John Benjamins, 2016.
BATLINER, A. et al. The Prosodic Marking of Phrase Boundaries: Expectations and Results. In: RUBIO AYUSO, A. J.; LOPEZ SOLER, J. M. (Org.). Speech Recognition and Coding: New advances and Trends. Berlin: Springer, 1995. v. 147, p. 89-92.
BIRKNER, K. Relative Konstruktionen zur Personenattribuierung. In: GÜNTHNER, S.; WOLFGANG, I. Konstruktionen in der Interaktion. Berlim: Mouton de Gruyter, 2006. p. 205-238.
BLAAUW, Eleonora. The contribution of prosodic boundary markers to the perceptual difference between read and spontaneous speech. Speech
Communication, Elsevier, v. 14, n. 4, p. 359-375, 1994. Available at:
<http://www.sciencedirect.com/science/article/pii/0167639394900280>. Access on: 10 Apr. 2015.
BOERSMA, P.; WEENINK, D. Praat: doing phonetics by computer. 2015. Available from: <http://www.praat.org/>. Access: 2 dec. 2015 BOLINGER, D. Around the edges of language. In: BOLINGER, D. (Ed.).
Intonation: Selected Readings. Harmondsworth: Penguin, 1972. p. 19-29.
BOSSAGLIA, G. Effects of speech rhythm on spoken syntax A corpus-based study on Brazilian Portuguese and Italian. CHIMERA: Romance
BROWN, G. et al. Questions of Intonation. London: Croom Helm, 1980. BYBEE, J. Language, usage and cognition. Cambridge: Cambridge University Press, 2010.
CHAFE, W. L. Discourse, consciousness and time: The flow and displacement of conscious experience in speaking and writing. Chicago: University of Chicago, 1994.
COLE, J.; SHATTUCK-HUFNAGEL, S.; MO, Y. Prosody production in spontaneous speech: Phonological encoding, phonetic variability, and the prosodic signature of individual speakers. The Journal of the Acoustical
Society of America, New York, v. 128, n. 4, p. 2429, 2010.
COOPER, W. E.; PACCIA-COOPER, J. Syntax and speech. Cambridge/ MA: Harvard University Press, 1980.
COUPER-KUHLEN, E. Prosodic Cues of Discourse Units. In: BROWN, Keith (Ed.). Encyclopedia of Language & Linguistics. Oxford: Elsevier, 2006. p. 178-182.
CRESTI, E. Corpus di Italiano parlato. Firenze: Accademia della Crusca, 2000. v. 1.
CRESTI, E. Syntactic properties of spontaneous speech in the L-AcT framework: data on Italian complement and relative clauses through the IPIC Data Base. In: RASO, T.; MELLO, H.; PETTORINO, M. (Ed.).
Spoken Corpora and Linguistic Studies. Philadelphia; Amsterdam: John
Benjamins, 2014.
CRESTI, E.; MONEGLIA, M. Informational patterning theory and the corpus-based description of spoken language: The compositionality issue in the topic-comment pattern. In: MONEGLIA, M.; PANUNZI, A. (Ed.). Bootstrapping Information from Corpora in a Cross-Linguistic
Perspective. Firenze: Firenze University Press, 2010. p. 13-45.
CROFT, W. Intonation units and grammatical structure. Linguistics, De Gruyter, v. 33, n. 5, p. 839-882, 1995.
CRUTTENDEN, A. Intonation. 2. ed. Cambridge: CUP, 1997.
CRYSTAL, D. Prosodic Systems and Intonation in English. Cambridge: CUP, 1969.
DU BOIS, J. W; CUMMING, S; SCHUETZE-COBURN, S; PAOLINO, D. (Ed.). Santa Barbara Papers in Linguistics. v. 4: Discourse Transcription.
Santa Barbara Papers in Linguistics, Santa Barbara, v. 4, 224p., 1992.
DU BOIS, J. Rhythm and Tunes: The notation Unit in the Structure of Dialogic Engagement. Conference Prosody and Interaction. University of Potsdam, 2008.
FON, J.; JOHNSON, K.; CHEN, S. Durational patterning at syntactic and discourse boundaries in Mandarin spontaneous speech. Language
and Speech, Kansas, v. 54, n. Pt 1, p. 5-32, 2011.
FOWLER, C. A. Segmentation of coarticulated speech in perception.
Attention, Perception & Psychophysics, New York, v. 36, n. 4, p.
359-368, 1984.
FUCHS, S.; KRIVOKAPIC, J.; JANNEDY, S. Prosodic boundaries in German: Final lengthening in spontaneous speech. The Journal of the
Acoustical Society of America, New York, v. 127, n. 3, p. 1851, 2010.
HALLIDAY, M. A. K. Speech and Situation. London: University College, 1965.
IZRE’EL, S. Intonation Units and the Structure of Spontaneous Spoken Language : A View from Hebrew. In: AURAN, C; BERTRAND, R; CHANET, C; COLAS, A; DI CRISTO, A; PORTES, C; REYNIER; A; VION, M. (Ed.) Proceedings of the IDP05 International Symposium on
Discourse-Prosody Interfaces. Aix-en-Provence: 2011. Available from:
<http://aune.lpl.univ-aix.fr/~prodige/idp05/actes/izreel.pdf>. Access at: 20 Nov. 2017.
KOHLER, K. J; PETERS, B.; WESENER, T. Interruption Glottalization in German Spontaneous Speech. Proceedings of Disfluency
in Spontaneous Speech, DiSS01, 2001. p. 45-48. Available from:
<http://www.isca-speech.org/archive_open/archive_papers/ diss_01/dis1_045.pdf>. Access at: 20 Nov. 2017.
LIAW, A.; WIENER, M. Classification and Regression by randomForest.
The R News Journal, [s.l.], v. 2, n. 3, p. 18-22, 2002. Available from:
MITTMANN, M. M. et al. Utterance as the minimal pragmatic entity in spontaneous speech perception. In: CONFERÊNCIA LINGUÍSTICA E COGNIÇÃO, V., 2010, Florianópolis. Anais... Florianópolis: Universidade Federal de Santa Catarina, 2010. Available from: <http://www.nupffale. ufsc.br/lincognition/anais.htm>. Access on: 20, Nov. 2017.
MITTMANN, M. M.; BARBOSA, A. An automatic speech segmentation tool based on multiple acoustic parameters. CHIMERA. Romance
Corpora and Linguistic Studies, Madri, v. 32, p. 133-147, 2016.
MO, Y.; COLE, J.; LEE, E-K. Naïve listeners’ prominence and boundary perception. In: BARBOSA, P. A; MADUREIRA, S.; REIS, C. (Org.).
Speech Prosody. Campinas: ISCA, 2008. p. 735-738. Available from:
<http://www.isca-speech.org/archive/sp2008/papers/ sp08_735.pdf>. Access on: 20, Nov. 2017.
MO, Y. Duration and intensity as perceptual cues for naïve listeners’ prominence and boundary perception. In: BARBOSA, P. A; MADUREIRA, S; REIS, C. (Ed.). Speech Prosody. Campinas: ISCA, 2008. Available from: <http://www.isca-speech.org/archive/sp2008/sp08_739.html>. Access on: 20 Nov. 2017.
MONEGLIA, M.; CRESTI, E. C-ORAL-ROM: Prosodic boundaries for spontaneous speech analysis. In: KAWAGUCHI, Y.; ZAIMA, S.; TAKAGAKI, T. (Ed.). Spoken Language Corpus and Linguistics
Informatics. Amsterdam; Philadelphia: John Benjamins, 2006. p. 89-112.
MONEGLIA, M. Units of Analysis of Spontaneous Speech and Speech Variation in a Cross-linguistic Perspective. In: KAWAGUCHI, Y.; ZAIMA, S.; TAKAGAKI, T. (Ed.). Spoken Language Corpus and
Linguistics Informatics. Amsterdam; Philadelphia: John Benjamins,
2006. p. 153-179.
MONEGLIA, M. Spoken Corpora and Pragmatics. Revista Brasileira
de Linguística Aplicada, Belo Horizonte, v. 11, n. 2, p. 479-519, 2011.
PETERS, B.; KOHLER, K. J.; WESENER, T. Phonetische Merkmale prosodischer Phrasierung in deutscher Spontansprache. In: KOHLER, J.; KLEBER, F.; PETERS, B. (Ed.). Prosodic Structures in German
PIERREHUMBERT, J. B. The Phonetics and Phonology of English
Intonation. 1980. 401 f. Thesis (PhD) – Dept. of Linguistics and
Philosophy, Massachusetts Institute of Technology, Cambridge/MA, 1980. Available from: <http://hdl.handle.net/1721.1/16065>. Access on: 20 Nov. 2017.
PIKE, K. L. The intonation of American English. Ann Arbor: University of Michigan, 1945.
R CORE TEAM (2017). R: A language and environment for statistical computing. R Foundation for Statistical Computing, Vienna, Austria. [Computer program] Available from: <https://www.R-project.org/>. Access on: 15 Dec. 2017.
RASO, T.; MELLO, H. (Ed.). C-ORAL-BRASIL I: Corpus de referência do português brasileiro falado informal. Belo Horizonte: UFMG, 2012. RASO, T.; MITTMANN, M. M.; MENDES, A. C. O. O papel da pausa na segmentação prosódica de corpora de fala. Revista de Estudos da
Linguagem, Belo Horizonte, v. 23, n. 3, p. 883-922, 2015.
RASO, T.; VIEIRA, M. A description of Dialogic Units/Discourse Markers in spontaneous speech corpora based on phonetic parameters.
CHIMERA: Romance Corpora and Linguistic Studies, Madri, v. 3, p.
221-249, 2016.
SANDERS, L. D.; NEVILLE, H. J. Lexical, Syntactic, and Stress-Pattern Cues for Speech Segmentation. Journal of Speech, Language, and
Hearing Research, ASHA Association, v. 43, n. 6, p. 1301-1321, 2000.
SCHUETZE-COBURN, S.; SHAPLEY, M.; WEBER, E. G. Units of intonation in discourse: a comparison of acoustic and auditory analyses.
Language and Speech, Kansas, v. 34, n. 3, p. 207-234, 1991.
SELKIRK, E. O. Comments on Intonational Phrasing in English. In: FROTA, S.; VIGARIO, M.; FREITAS, M. J. (Ed.). Prosodies. Berlin: Mouton de Gruyter, 2005. p. 11-58.
SWERTS, M.; COLLIER, R.; TERKEN, J. Prosodic predictors of discourse finality in spontaneous monologues. Speech Communication, Elsevier, v. 15, n. 1-2, p. 79-90, Out. 1994.
SWERTS, M. Prosodic features at discourse boundaries of different strength. The Journal of the Acoustical Society of America, New York, v. 101, n. 1, p. 514-521, 1997.
SZCZEPEK REED, B. Turn-final intonation in English. In: COUPER-KUHLEN, E.; FORD, C. (Ed.). Sound Patterns in Interaction. Amsterdam: John Benjamins, 2004. p. 97-118.
SZCZEPEK REED, B. Prosody, syntax and action formation: Intonation phrases as “action components”. In: BERGMANN, P. et al. (Ed.).
Prosody and Embodiment in Interactional Grammar. Berlin: Mouton de
Gruyter, 2012. p. 142-170.
TSENG, C.-Y. Y. et al. Fluent speech prosody: Framework and modeling. Speech Communication, Elsevier, Anais... jul. 2005. Available from: <http://www.sciencedirect.com/science/article/pii/ S0167639305000919>. Access on: 26 May 2015.
TSENG, C.-Y.; CHANG, C.-H. Pause or no pause?: Prosodic phrase boundaries revisited. Tsinghua Science and Technology, Tsinghua, v. 13, n. 4, p. 500-509, ago. 2008.
VENABLES, W N; RIPLEY, B D. Modern Applied Statistics with S. 4. ed. New York: Springer, 2002. Available from: <http://www.stats.ox.ac. uk/pub/MASS4>. Access on: 10 Jan. 2018.