Engenharia
Airport Performance Analysis and Forecasting
Nuno Rafael Valente
Dissertação para obtenção do Grau de Mestre em
Engenharia Aeronáutica
(Ciclo de estudos integrado)
Orientador: Prof. Doutor Jorge Miguel dos Reis Silva
Acknowledgements
I would like to express my deep gratitude, first and foremost, to Professor Jorge Reis Silva, my research supervisor, for sharing with me his time and expertise and for his patient guidance. I would also like to thank Eng. Emília Baltazar for her advice and assistance during this research. My grateful thanks are also extended to all the other members of NIT (Transportation Research Team) with whom I shared mutual aid the same “little” space during last months.
I am particularly grateful to Professor José Alberto Fuinhas, who received me with great en-thusiasm and commitment, and gave a fundamental contribution to the methodology applied as well as pertinent advice.
The knowledge provided by all the professors with whom I have come across as a valuable tool to carry out this research and was greatly appreciated.
I would like to thank my closest friends, that I met in Covilhã, for their help and compan-ionship that made this five-year journey at the university much easier.
Finally, my special thanks to my family, particularly to my parents, for their support not only during my study but throughout all the path that I have walked so far.
List of Publications
Articles produced as a result of this dissertation research (see annexe A.6):
1. Modelling and Forecasting Airport Performance
Nuno Valente, Maria E. Baltazar, Jorge Silva (2017) 24th APDR Congress - Intellectual Cap-ital and Regional Development: New landscapes and challenges for space planning, 6-7 July, Covilhã (Portugal)
2. Airport Performance Analysis and Forecasting
Nuno Valente, Maria E. Baltazar, Jorge Silva (2017) ICEUBI2017 – International Congress on Engineering – A Vision for the Future, 5-7 November, Covilhã (Portugal) (Manuscript accepted for presentation).
Resumo
Os aeroportos constituem uma parte essencial do sistema de transporte aéreo, disponibilizando infraestruturas que permitem a transferência de passageiros e carga entre a superfície terrestre e veículos aéreos, o armazenamento e a manutenção de aeronaves e a acomodação de outros fornecedores de serviços essenciais ao mesmo. Os aeroportos têm ainda um elevado valor es-tratégico para as regiões em que estão instalados, uma vez que criam riqueza, oportunidades de emprego, promovem o turismo regional e incentivam o desenvolvimento económico. Desde o início da aviação civil, o tráfego aéreo tem crescido de forma exponencial sem ter sido acompan-hado por um investimento correspondente nas infraestruturas aeroportuárias, atingindo recen-temente um ponto em que os aeroportos começam a enfrentar problemas de congestionamento devido à falta de capacidade. Devido a estes fatores, há uma pressão crescente sobre os ge-stores aeroportuários, companhias aéreas e entidades que regulam o espaço aéreo para uma gestão mais eficiente do sistema do setor. A análise do desempenho aeroportuário, bem como a previsão dos fatores de que este depende, assumem-se então como tarefas essenciais.
Este estudo aborda o desempenho aeroportuário tentando prever o mesmo através da projeção do crescimento de passageiros e movimentos de aeronaves. Para tal, o desempenho é aferido através da metodologia MACBETH (Measuring Attractiveness by a Categalized Based Evaluation Technique) na qual se baseia o modelo PESA-AGB (Performance Efficiency Support Analysis – Air-port Global Benchmarking) adotado neste estudo. O método utilizado na previsão consiste numa técnica de alisamento exponencial, que permitiu a construção de três cenários de crescimento e que pode ser facilmente aplicado pelos gestores aeroportuários.
Os resultados apresentam os valores previstos de passageiros e movimentos de aeronaves num aeroporto fictício - representativo de um dos principais aeroportos em Portugal, bem como as pontuações de desempenho. É também mostrado que o peso do indicador de desempenho aero-portuário considerado o mais importante pelos especialistas, acaba por ter um menor impacto no computo geral quando se considera em simultâneo a influência direta sobre outros indicadores.
Palavras-chave
Resumo alargado
Introdução
Esta secção serve o propósito de resumir, em língua portuguesa, o conteúdo da presente dis-sertação. Inicialmente é feito o enquadramento da dissertação e são identificados o objeto e objetivos do estudo. O resumo prossegue com apresentação dos principais resultados e con-clusões retiradas e termina com a enumeração dos aspetos sugeridos para objeto de trabalhos futuros.
Enquadramento
Um aeroporto mais do que uma infraestrutura que serve uma gama de necessidades crescentes relacionadas com o transporte aéreo, é um sistema que incorpora um conjunto heterogéneo de componentes interligados e que, além disso, tem uma forte interação com o meio em que está inserido.
Um dos principais problemas enfrentados pelos aeroportos atualmente é o volume crescente de tráfego aéreo. De facto, este tem crescido de forma praticamente exponencial e tem-se mostrado resiliente a fatores externos negativos mais acentuados, como ataques terroristas, conflitos e crises financeiras. Este crescimento do tráfego aéreo não tem sido acompanhado por um investimento correspondente ao nível das infraestruturas de transporte aéreo levando a que os principais aeroportos mundiais enfrentem atualmente períodos de forte congestion-amento que colocam em risco a operacionalidade e a segurança da infraestrutura. Devido a estes fatores, há uma pressão crescente sobre os gestores aeroportuários, companhias aéreas e entidades que regulam o espaço aéreo para uma gestão mais eficiente do sistema de transporte aéreo.
Para melhorar o desempenho aeroportuário, é necessário analisar e modelar as dinâmicas de um aeroporto no sentido de facilitar o entendimento, definição, quantificação e simulação das mesmas.
É esperado pela generalidade da indústria da aviação civil, que o crescimento do tráfego aéreo se mantenha no futuro. Tendo em conta que o transporte aéreo assume uma influência cada vez maior sobre os cenários económicos, é importante assegurar que as necessidades futuras deste setor são asseguradas. Como tal, o desenvolvimento de previsões sobre tráfego aéreo e atividades de gestão do transporte aéreo assume um papel critico nos processos de planeamento das várias organizações envolvidas com esta indústria.
Objeto e Objetivos
O objeto de estudo desta dissertação é o desempenho aeroportuário, sendo o principal obje-tivo a modelação e previsão do mesmo. Para tal, foram traçados dois objeobje-tivos secundários. Primeiro, é necessário definir desempenho aeroportuário através da identificação dos aspetos avaliados e dos indicadores através dos quais este deve ser medido. É necessário conhecer e distinguir os diferentes conceitos associados ao desempenho aeroportuário (eficiência,
desem-Airport Performance Analysis and Forecasting
que são utilizados neste tipo de estudos.
Em segundo lugar, é necessário identificar a metodologia que melhor se adequa ao problema, à natureza dos dados e aos recursos disponíveis. Este princípio é valido tanto para a análise de desempenho como para a construção da previsão.
Pretende-se que este estudo se aplique a um aeroporto Português, geralmente adotado como referência.
Casos de Estudo
Este estudo adota o modelo PESA-AGB para quantificar o desempenho aeroportuário e recorre a uma base de dados parcialmente constituído por dados relativos a diferentes áreas de de-sempenho publicados em relatórios públicos referentes a 3 aeroportos portugueses do grupo VINCI/ANA S.A.: Lisboa, Porto e Faro. Este trabalho de investigação utiliza apenas os dados ref-erentes ao aeroporto de Lisboa. Tendo em conta que os dados em falta foram inferidos a partir de aeroportos mundiais semelhantes em dimensão (passageiros e movimentos) e categoria, as simulações apresentadas nesta dissertação aplicam-se a um aeroporto fictício representativo do aeroporto de Lisboa.
Três casos de estudo são apresentados, correspondendo à análise da evolução do desempenho aeroportuário em função do crescimento de:
• passageiros (Caso I);
• movimentos de aeronaves (Caso II);
• passageiros e movimentos de aeronaves em simultâneo (Caso III).
Para os dois primeiros casos são consideradas 3 hipóteses a fim de aferir quais as condições mais adequadas para avaliar o impacto do crescimento de cada um dos indicadores no desempenho do aeroporto:
• hipótese 1 - previsão por projeção de tendência para o indicador considerado aplicando a condição “ceteris paribus” para todos os outros indicadores;
• hipótese 2 – previsão por projeção de tendência para o indicador em estudo, considerando, adicionalmente, o possível impacto diretamente observável do seu crescimento sobre out-ros indicadores;
• hipótese 3 – previsão aplicando a técnica de alisamento exponencial assumindo as condições de uma das hipóteses anteriores que sejam consideradas as mais adequadas.
Principais conclusões
A revisão bibliográfica conduzida para a análise de desempenho aeroportuário mostra que as técnicas de Stochastic Frontier Analysis (SFA) e Data Envelopment Analysis (DEA) são as mais populares. No entanto, para modelar o desempenho aeroportuário apenas o SFA é aplicável juntando-se as técnicas baseadas no método dos mínimos quadrados. O DEA por si só não fornece uma medida de desempenho. Uma forma encontrada na literatura para contornar esta questão
consiste em atribuir um peso a cada medida de desempenho através de modelos híbridos como DEA/Analytic Hierarchy Process (AHP).
Relativamente às técnicas de previsão, os métodos mais populares consistem em técnicas de séries temporais e métodos econométricos. A seleção da ferramenta de previsão mais ade-quada depende, no entanto, de uma série de fatores identificados nesta dissertação.
Os resultados obtidos da primeira hipótese para o Caso I e para o Caso II confirmam o maior impacto do número de passageiros no desempenho aeroportuário medido, através da pontu-ação obtida do modelo PESA-AGB, resultante do maior peso atribuído pelos especialistas a este indicador. No entanto, quando se considera o impacto direto que a alteração do número de passageiros e movimentos de aeronaves podem ter sobre outros indicadores, o segundo acaba por ter maior impacto no desempenho aeroportuário uma vez que a soma do seu peso com os pesos dos indicadores afetados acaba por ser maior do que no caso dos passageiros, mostrando que as suposições estabelecidas na segunda hipótese têm uma influência considerável na análise desempenhada.
Na terceira hipótese, é introduzida a técnica Exponential Triple Smoothing (ETS) que permite a construção de três cenários de crescimento (expectável, otimista e pessimista) para cada indi-cador, com base nos limites de confiança. O cenário expectável mostra, para ambos os casos, um crescimento contínuo ainda que abaixo da taxa média registada entre 2003 e 2013. O cenário otimista mostra, no caso dos passageiros, um número ligeiramente acima da capacidade máx-ima projetada para 2013. Apesar de tais projeções não serem totalmente precisas, os números previstos mostram que o aeroporto teria de realizar um esforço adicional para ter a capacidade de dar resposta a essa procura.
No caso III, a performance do aeroporto é estimada para o cenário expectável de passageiros e movimentos de aeronaves, uma vez que a correlação entres os dois indicadores é muito elevada. As pontuações mostram que o aumento do tráfego aéreo (passageiros e movimentos) não leva, por si só, a um aumento significativo do desempenho quando comparado com as flutuações da pontuação registadas entre 2003 e 2013. Significa isto que, se os gestores aeroportuários pre-tendem obter aumentos significativos de desempenho global, mais do que lidar com o aumento do tráfego aéreo sem piorar o desempenho relativo às diferentes áreas, este último teria que ser melhorado.
Perspetivas de trabalhos futuros
A diversidade de técnicas de análise e previsão de desempenho e eficiência deixam ainda margem para explorar outras metodologias, permitindo o aumento da eficiência das mesmas.
Também o conjunto de indicadores de desempenho e respetivas variáveis explicativas poderão ser alvo de estudos mais aprofundados que contribuam para um melhor entendimento da anato-mia do desempenho aeroportuário, isto é, refinando a sua especificidade e eventual aplicabili-dade para aquele fim.
Airport Performance Analysis and Forecasting
lações adicionais entre todos eles para se obter uma perspetiva mais alargada e consistente das dinâmicas desse desempenho;
• análises econométricas que identifiquem as vaiáveis explicativas que têm uma relação causal com os diferentes indicadores;
• aplicação de metodologias de previsão diferentes que possam fornecer previsões mais ex-atas;
• considerar processos de consulta de especialistas e atribuição de pesos aos indicadores mais direcionados para o modelo em causa, que permitam uma distribuição mais consis-tente dos pesos aos indicadores das diferentes áreas;
• incorporar metodologias quantitativas ou outras alterações no modelo PESA-AGB que per-mitam aumentar a objetividade da avaliação da performance e tornar o modelo mais pre-ciso em análises comparativas entre diferentes aeroportos.
Abstract
Airports are an essential part of air transport system, providing infrastructures to enable the transfer of passengers and freight between the land surface and air vehicles, to store and main-tain aircraft and to accommodate other service providers needful to air transportation. More-over, airports have strategic importance to the regions they serve as they bring wealth, em-ployment opportunities, promote regional tourism and encourage economic development. Over the years, air traffic has grown exponentially without a corresponding investment in airport infrastructures and is now reaching a stage where airports may face congestion due to lack of capacity. Due to these facts, there is a growing pressure to manage the air transport system more efficiently. Therefore, it is of utmost importance to analyse airport performance and pre-dict the development of the factors that may affect it.
This study addresses airport performance by predicting it through the passengers and aircraft movements forecasts. For this purpose, airport performance is measured through Measuring At-tractiveness by a Categorical Based Evaluation Technique (MACBETH) methodology by adopting Performance Efficiency Support Analysis – Airport Global Benchmarking (PESA-AGB) model. The forecasting method consists of an exponential smoothing technique that could be easily used by airport managers and that allow creating three different scenarios of development.
Results show the forecasted number of passengers and aircraft movements at a fictitious air-port representative of a major Portuguese airair-port as well as its consequent performance score. Moreover, it is shown that the weight, empirically assigned by experts, that each indicator has on airport performance may invert when considering the direct impact on other indicators.
Keywords
Contents
1 Introduction 1
1.1 Motivation . . . 1
1.2 Object and Objectives . . . 2
1.3 Dissertation Structure . . . 3
2 Airport Performance Analysis 5 2.1 Introduction . . . 5
2.2 Airport - A Complex Organization . . . 5
2.3 Performance and Efficiency Analysis . . . 7
2.4 Conclusion . . . 13 3 Forecasting 15 3.1 Introduction . . . 15 3.2 Methodologies . . . 15 3.3 Conclusion . . . 20 4 Case Study 21 4.1 Introduction . . . 21 4.2 Case I - Passengers . . . 23 4.2.1 Hypothesis 1 . . . 23 4.2.2 Hypothesis 2 . . . 26 4.2.3 Hypothesis 3 . . . 30
4.3 Case II - Aircraft Movements . . . 40
4.3.1 Hypothesis 1 . . . 40
4.3.2 Hypothesis 2 . . . 43
4.3.3 Hypothesis 3 . . . 45
4.4 Case III - Passengers and Aircraft Movements . . . 48
4.5 Conclusion . . . 49
5 Conclusions 51 5.1 Dissertation Summary . . . 51
5.2 Concluding Remarks . . . 52
5.3 Prospects for Future Work . . . 53
Bibliografia 55 A Annexes 61 A.1 KPI metrics . . . 61
A.2 PESA-AGB Model Flowchart . . . 63
A.3 Database . . . 64
A.4 ETS Forecast Software Parameters . . . 67
A.5 ETS Forecast Statistics . . . 68
A.6 Regression Analysis Attempts . . . 69
List of Figures
1.1 World annual traffic growth over last crisis. . . 1
1.2 Long-term air traffic demand forecast. . . 2
2.1 Performance Indicators in Six Key Performance Areas. . . 7
2.2 Quantitative methodologies to assess productivity and efficiency. . . 9
3.1 Alternative forecasting techniques. . . 16
4.1 PESA-GB model building tasks. . . 21
4.2 Case studies process. . . 22
4.3 Core Key Performance Indicators’ weights. . . 22
4.4 Process used to conduct Hypothesis I. . . 23
4.5 Projection of the number of passengers in Airport 1 for the years 2014-2016. . . . 24
4.6 Value function for Passengers KPI of the Airport 1 Core KPA. . . 24
4.7 Airport Score as a function of the number of passengers (Hypothesis I). . . 26
4.8 Process used to conduct Hypothesis II. . . 27
4.9 Value function for Passengers Per Employee KPI of the Airport 1 Core KPA. . . 28
4.10 Airport Score as a function of the number of passengers (Hypothesis II). . . 30
4.11 Passengers ETS forecast for Airport 1. . . 32
4.12 Projection of the number of aircraft movements in Airport 1 for the years 2014-2016. 41 4.13 Airport Score as a function of aircraft movements (Hypothesis I). . . 43
4.14 Airport Score as a function of aircraft movements (Hypothesis II). . . 45
4.15 Aircraft movements ETS forecast. . . 45
List of Tables
2.1 Summary of airport performance studies. . . 11
3.1 Performances of airport demand forecasting methods. . . 18
3.2 Summary of forecasting studies on airports. . . 19
4.1 Historical and predicted no. of passengers and KPA’s score (hypothesis I.) . . . . 25
4.2 Core KPIs’ scores and KPA’s score. . . 25
4.3 KPAs’ scores and Airport 1 performance score. . . 26
4.4 Historical and predicted no. of passengers per employee and KPA’s scores for the hypothesis II. . . 27
4.5 Productivity/Cost Effectiveness KPIs’ scores and KPA’s score. . . 29
4.6 KPAs’ scores and Airport 1 performance score (hypothesis 2). . . 30
4.7 Values predicted by passengers’ ETS forecast for Airport 1. . . 32
4.8 Passengers KPI’s scores for three growth scenarios (hypothesis 3). . . 33
4.9 Passengers per Employee KPI’s values and score (hypothesis 3). . . 33
4.10 Core KPIs’ scores and KPA’s score obtained for the expected scenario. . . 34
4.11 Productivity/Cost-Effectiveness Key Performance Indicators scores and Key Per-formance Area score for the expected scenario. . . 35
4.12 KPAs’ scores and Airport 1 performance score for the expected scenario. . . 36
4.13 Core KPIs’ scores and KPA’s score obtained for the best-case scenario. . . 36
4.14 Productivity/Cost-Effectiveness KPIs’ scores and KPA’s score for the best-case sce-nario. . . 37
4.15 KPAs’ scores and Airport 1 performance score for the best-case scenario. . . 38
4.16 Core KPIs’ scores and KPA’s score obtained for the worst-case scenario. . . 38
4.17 Productivity/Cost-Effectiveness KPIs’ scores and KPA’s score for the worst-case scenario. . . 39
4.18 KPAs’ scores and Airport 1 performance score for the worst-case scenario. . . 40
4.19 Historical and predicted nos. of aircraft movements and KPA’s score (hypothesis I). 41 4.20 Core KPIs’ scores and KPA’s score obtained in Case II. . . 42
4.21 KPAs’ scores and Airport 1 performance score ontained in Case II. . . 42
4.22 Historical and predicted nos. of aircraft movements per gate and aircraft move-ments per employee and own KPI’s scores at Airport 1 (hypothesis II). . . 43
4.23 KPAs’ scores and Airport 1 performance score. . . 44
4.24 Predicted values and scores from aircraft movements’ ETS forecast for Airport 1. 46 4.25 Aircraft Movements per Gate KPI’s values and scores (hypothesis 3). . . 46
4.26 Aircraft Movements per Employee KPI’s values and scores (hypothesis 3). . . 47
4.27 Core and Productivity/Cost-Effectiveness KPAs’ scores and Airport 1 performance score (hypothesis 3). . . 47
4.28 Core and Productivity/Cost-Effectiveness KPAs’ scores and Airport 1 performance score obtained in Case III). . . 48
List of Acronyms
ACI Aiport Council International AHP Analytic Hierarchy Process
ARIMA Autoregressive Integrated Moving Average
ARIMAX Autoregressive Integrated Moving Average with additional explanatory variables ARMA Autoregressive Moving Average
DEA Data Envelopment Analysis DMU Decision Making Unit
ETS Exponential Triple Smoothing
ICAO International Civil Aviation Organization KPA Key Performance Area
KPI Key Performance Indicator
MACBETH Measuring Attractiveness by a Categorical Based Evaluation Technique MCDA Multi-Criteria Decision Analysis
MSE Mean Squared Error
PESA-AGB Performance and Efficiency Support Analysis for Airport Global Benchmarking PLS Partial Least Squares
SARIMA Seasonal Autoregressive Integrated Moving Average SFA Stochastic Frontier Analysis
List of Symbols
y observation S smoothed observation b trend factor I seasonal index L periodst time period index
α estimated constant
β estimated constant
γ estimated constant
Chapter 1
Introduction
1.1
Motivation
Most common problems faced by the air traffic control system are primarily related to the volume of air traffic demand placed on the system and those related to the weather. Focusing on air traffic demand, it has been recorded a high growth rate and it has proven to be resilient to external factors (see Figure 1.1).
Figure 1.1: World annual traffic growth over last crisis. Source: [1].
Several world major airports are already facing periodic congestion, which may cause oper-ational constraints to the airport. For example, Lisbon airport is often reported to be facing congestion problems at the same time of year [2] [3] which affects not only the airport itself but also some stakeholders like airlines [4], [5]. Despite several reports of the intentions to expand the airport, the air traffic growth has been faced essentially, through operational adjustments to improve airport performance and efficiency.
Several factors dictate the amount of traffic that can land at an airport in a given amount of time. Due to the increasing demand for air transportation, which is expected to continue in the following years (see Figure 1.2), in conjunction with different kind of constraints on providing capacity, there has been increasing political pressure for improvements in airport performance through better and sustainable management of existing resources.
Airport Performance Analysis and Forecasting
Figure 1.2: Long term air traffic demand forecast. Source: [1].
This study intends to contribute to the assessment of the most suitable tools and criteria to analyse and forecast airport performance and, consequently, provide managers and/or decision-making units (DMUs) with useful tools and knowledge to improve airport performance as a means to respond to air traffic growth.
1.2
Object and Objectives
The object of this study is airport performance and the model to measure and predict it. There-fore, this work has two main objectives: model and forecast airport global performance.
Other specific objectives are inherent to the framework of this study. Firstly, it is necessary to define “airport performance”. The objective is to identify the criteria/indicators from which we can quantify or qualify this performance; this may be achieved through a literature review where attention is paid to the object of previous studies on airports and to the indicators (or inputs and outputs) selected.
To analyse airport performance is then necessary to identify the methodology that best suits the problem and data nature. The problem refers to what the object is in specific (commercial performance, productivity, etc.) and to the main objective, which in this study is to describe airport performance through a cost function or a scoring system.
The same happens for forecasting, which has seen several techniques being applied. The se-lection of the most suitable forecast depends on several features that must be identified. This study is intended to be applied to a Portuguese benchmark airport.
1.3
Dissertation Structure
The subjects and sequence of the main chapters of this dissertation can be summarised as fol-lows:
Chapter 1 contains an introduction where it is described the theme of this work, the study’s object and objectives are identified, and the dissertation structure is detailed.
In Chapter 2, airport is regarded as a complex system composed of several interconnected subsystems and that also must deal with demanding stakeholders and external factors; thus a literature review on airport performance and efficiency analysis is presented depicting the characteristics of some methodologies to do so. The choice of study objects and indicators or inputs and outputs made by previous studies on this subject is referred too.
Chapter 3 presents the state-of-the-art of air traffic and airport performance forecasting. It is identified the aspects that must be considered before starting the process of forecasting and the different techniques developed so far.
Chapter 4 presents first an explanation of the MCDA model adopted to measure airport per-formance. The chapter continues by identifying the case studies. For each case study, it is presented the scores obtained for each of the hypotheses that are formulated as well as the related analysis. The results are compared to assess the impacts of different indicators and assumptions on airport performance score.
Lastly, Chapter 5 concludes by pointing out the major findings of this work and presenting the dissertation summary. Also, some aspects that may be the object of future work are identified.
Chapter 2
Airport Performance Analysis
2.1
Introduction
To analyse airport performance, firstly, one needs to understand the dynamics of such an or-ganisation. Airports embody a range of services, must deal with several stakeholders and have a significant impact on the regional economies. Also, it is necessary to identify the several methodologies available to carry out this kind of analysis.
In this chapter, an airport is seen as a complex organisation encompassing the previous aspects. In addition to the analysis of the economic impact of an airport in a region, it is identified the several factors on which the economic self-sufficiency of an airport depends. This chapter also offers an overview of the several performance analysis methodologies available as well as an extensive literature review.
2.2
Airport - A Complex Organization
Airports are intermodal hubs and natural interfaces between ground and air transport. However, more than an interchange of transport modes, an airport is a system that serves a broad and com-plex range of needs related to the movements of people and cargo worldwide [6] and embodies several interconnected heterogeneous components. It must be efficient, secure, pleasant to its users, have a capacity greater than demand, have a profitable commercial exploitation, etc.
Airports accommodate manoeuvre area, passenger’s terminals, cargo terminals, control tower, meteorological service, flight information centre, communication services, commercial area, etc.
A system is considered to be complex when it is composed of a group of interrelated com-ponents and subsystems, for which the degree and nature of the relationships between them is imperfectly known, with varying directionality, magnitude and timescales of interactions [7].
Running a complex organisation such as an airport involves dealing with divergent interests between different stakeholders; this means that stakeholders may seek to influence or even become involved in route development decisions at an airport so that airport managers may prioritise and clarify organisational goals. For example, airlines require airports to capacity at low costs, efficient services, flexibility to deal with different kind of companies, elevated levels of safety and security, etc. Hossain and Alam [8, pp. 1] consider an air transportation system as “probably one of the most complex man-made systems that operates on the edge of chaos and exhibits emergent behaviour whereby small changes in one part of the system can cause major changes in another or in the system as a whole”.
Airport Performance Analysis and Forecasting
Planning and management at an airport are not easy tasks. Authorities invest large sums in equipment for a specific purpose to respond to a demand on which airports only have an indi-rect control. An airport manager is required to have a clear perception of costs and revenues structure to obtain profits or at least minimize losses depending on the ownership form.
Airports are often viewed as spheres of influence for regional development [9],[10] as they can enhance the growth potential of a region. It is accepted that transports infrastructures are potentially influential on the economic performance of the region by expanding the use of ex-isting resources (labour, capital, etc.), attracting additional resources, and making economies more productive [11]. However, as it stressed by European Investment Bank, infrastructures of this kind contribute only indirectly to this aim, acting as a catalyst in promoting development [12].
The economic self-sufficiency of any airport depends on many factors, like its size and loca-tion, current infrastructure conditions, maintenance costs, investment in future development and efficiency of capital goods utilisation [13]. The importance of the location of an airport to attract passenger services and air freight services is supported by the studies of Dennis [14] and Zhang [15], respectively. Halpern and Graham [16] found that market growth has a significant positive effect on route development performance while airport constraints have a significant negative effect. Using Data Envelopment Analysis to determine the relative quality of several airports, Adler and Berechman [17] found that aspects regarding delay times, runway capacity, airport charges, etc. were important for passenger airlines location. Gardiner et al. [18] iden-tified and evaluated the factors that influence cargo airlines’ choice of airport and concluded that the ability of an airport to operate at night and the quest to minimise costs were the most important factors. Regarding efficiency, Oum et al.[19] concluded that airports owned and/or controlled by majority private firms, autonomous public corporations or independent authori-ties are more efficient than those owned and/or controlled by government branch (city/state), multiple level governments, or ports authorities.
Doganis and Graham [20] surveyed the use of performance measures in Europe and found that most airports relied on purely financial measures of performance. The range of circumstances regarding aviation activities, commercial activities, site constraints, governance and ownership structure, etc., in which airports operate results in a mismatch between different airports to define most relevant performance indicators. ACI [21] defined a useful set of performance measures across some categories. The forty-two individual measures are referred to as Key Performance Indicators (KPIs). These indicators are divided into six categories called Key Per-formance Areas (KPAs) (see Figure 2.1) which can be described as follows:
• Core – core measures used to characterise and categorise airports, such as the number of passengers and operations;
• Safety and Security – safety indicators used to track airfield and other portions of the airport safety issues related to the operations while security indicators are used to monitor security violations, criminal acts and responsiveness;
• Service Quality - service quality indicators focus both on how passengers perceive the level of service provided by the airport;
• Productivity/Cost Effectiveness – these indicators measure the resources used to produce a certain volume of activity;
• Financial/Commercial – these indicators are used to track the airport’s financial perfor-mance, including airport charges, airport financial strength and sustainability, and the performance of individual commercial functions;
• Environmental – used to monitor an airport’s progress in minimising the environmental impacts of its operations.
The metrics of the KPI’s can be observed in Annex A.1.
Figure 2.1: Performance Indicators in Six Key Performance Areas. Adapted from [21].
Also, ICAO [22, 23] recommends that States (i.e., national governments) ensure that airports have performance management systems prepared, and that those systems include one or more performance indicators but only in four specified KPAs (Safety, Quality of service, Productivity and Cost-effectiveness).
2.3
Performance and Efficiency Analysis
Airport Performance Analysis and Forecasting
day; this represents a major problem for the airports since efficiency and safety problems may derive from operating near to the capacity limit. Besides, “congestion and the lack of slot avail-ability at international hubs were found to drive carriers and integrators to secondary airports” [18, pp. 394].
In 2016, over 140 countries added 5% or more capacity than in 2015 while 80% added more than 10% [1]. However, to overcome this problem, more than simply adding capacity, world’s airports are also seeking to improve its efficiency.
First, it necessary to analyse and model the dynamics within an airport with the aim of making it easier to understand, define, quantify and simulate.
This kind of activity is widely used in many industries and was introduced to the airport sector in the mid-1990’s, being the number of studies in this field still relatively modest [24].
The emergent interest from airport managers and governments in measure airport performance has the assessment or monitoring of the following features as main goals [25]:
• Financial and operational efficiency;
• Alternative investment strategies;
• Airport safety;
• Environmental impact.
Performance has many dimensions, and its definition is not clear in the literature as well as its components’ distinction. Lai et al. stated that “the research on airport performance can be classified into two main types: the efficiency evaluation approach and the productivity evalua-tion approach”; they consider that “efficiency does take the maximum potential output which can be produced with the available inputs, into account, while productivity considers actual outputs” [26, pp. 2]. It was also verified that the two terms have been used interchangeably and considered equivalent. Hooper and Hensher [27] distinguished efficiency and effectiveness defining the first as the way the physical inputs are used to produce the physical services, be-ing concerned with supply-side relationships; while the other one relates service levels to a large extent under their control, given passenger levels and/or landings, and is concerned with demand-side relationships. This study addresses the global performance of the airport encom-passing the several areas of airport operations.
As stated before, airports are complex and dynamic organisations which can have different priorities and ownership forms resulting in a diversity of methods used in its performance and efficiency analysis. Although previous studies [6], [28] on airport performance frequently clas-sify these methods into two groups (parametric methods and non-parametric methods) there is a greater diversity of tools used (see Figure 2.2).
The literature review conducted for this study only addresses the multidimensional tools which can be divided into average approaches, frontier approaches and Multi-Criteria Decision Analysis (MCDA) (see Table 2.1).
Frontier approaches have been widely used in the literature. A review of the same shows that DEA is the most used non-parametric approach while Stochastic Frontier Analysis (SFA) is the most studied parametric method.
Figure 2.2: Quantitative Methodologies to Assess Productivity and Efficiency. Adapted from [29].
Data Envelopment Analysis (DEA) has been appointed as the most popular method in airport benchmarking [30]. It consists of a linear programming-based method (non-parametric) to con-struct an efficiency frontier based on the sample. If the organisation is on the frontier it is efficient and if it is inside the frontier then it is inefficient. DEA handles multiple outputs eas-ily, but it can be influenced by noise assuming away measurement error and impermissibility as factors affecting the outcome. It is fair to say that DEA provides a measure of inefficiency rather than an explanation of it. Barros and Dieke [31] and Barros [32] used DEA to analyse the financial and operational performance of 31 Italian airports and to estimate Argentina’s airports’ relative technical efficiency, respectively. Barros and Sampaio [33] used DEA to determine the technical and allocative efficiency (a comparative measure of how well an airport adopts prices that suit its marginal productivity) of Portuguese airports.
Stochastic Frontier Analysis (SFA) is one of the main parametric approach used by researchers to evaluate efficiency or, more specifically, technical efficiency. This method can deal with random shocks and measurement errors. Environmental variables are also easier to deal with. Although the parametric approaches take these errors into account, its methods still face chal-lenges on separating random error from efficiency. Also, most papers focusing on the parametric frontier approach estimated a production frontier function, while ignoring multi-output nature of airports [6]. For example, Diana [34] used stochastic frontier models to assess technical effi-ciency at 3 New York airports, and Barros [35] estimated the technical effieffi-ciency of UK airports using a random stochastic frontier model.
Airport Performance Analysis and Forecasting
Airport productivity is frequently analysed using Total Factor Productivity (TFP). This method “requires an aggregation of all outputs into a weighted output index and all inputs into a weighted input index using pre-defined weights” [26, pp.4]. Cahill et al. [36] used TFP and labour productivity indicators, as well as basic financial indicators to analyse Dublin Airport Authority’s economic performance. TFP has also been combined with other methodologies to evaluate airports’ productivity. Tovar and Martín-Cejas [6] used a stochastic distance function to measure Spanish airports’ productivity changes and calculated the evolution and decompo-sition of the Total Factor Productivity (TFP) for those airports, while Fung et al. [28] used the non-parametric method of DEA to compute the relative efficiency of airports in China in each year of the study period, and Malmquist productivity change indices were used to estimate vari-ations in the overall productivity of each airport over time.
Regression analysis has been used to analyse commercial performance. Appold and Kasarda [37] used simple regressions to impact of passenger demography on the volume and nature of airport retail sales to later evaluate appropriate capital investments for terminal retail expan-sions. Fasone et al. [38] address the business performance of German airports using regression and partial least squares (PLS) allowing to use simultaneously variables that were dropped by past contributors because of collinearity.
Also, Multi-Criteria Decision Analysis (MCDA) has been applied in air transportation field. MCDA evaluates multiple conflicting criteria in decision-making and “consider evaluation criteria de-rived from a literature review or expert opinions, which might be subjective due to the vagueness of human judgements and preferences” [39, pp. 3]. Also, different weighting may be obtained by querying different experts. Analytic Hierarchy Process (AHP) is amongst the most popular techniques in this kind of analysis. AHP does not provide a measure of performance of a unit. Instead, it is used to assess the relative importance of the factors or criteria. For example, Yoo and Choi [40] utilised an AHP analysis on surveyed data about the relative importance of the factors and elements concerned with the improvement of passenger screening. Because of that, AHP is frequently combined with other techniques to analyse airport performance. Chao and Yu [41] developed a quantitative evaluation model for analysing air cargo competitiveness of airports by combining Delphi method and AHP. Others methods include MACBETH presented by Bana e Costa and Vansnick [42]. Baltazar et al. [43] used and compared the results of MACBETH and DEA in the efficiency analysis of 3 Iberian airports and found MACBETH to be more accurate than DEA and easily applicable in managerial practice involving stakeholders.
Further approaches have been used to analyse the performance of airports. Xiao et al. [44] modelled airport capacity investment using real options. Agent-based was also indicated as a promising tool to model and analyse a complex and sociotechnical system like an airport since it represents the interaction among system components [45]. However, Agent-based have been mostly used to model traffic system [46], [47].
Table 2.1: Summary of airport performance studies. Source: own elaboration.
Paper Method Object Units Inputs Outputs
Hooper and Hensher (1997) [27] TFP Productivity 6 Australian airports Capital stock,
labor Deflated revenue
Barros and Sampaio (2004) [33] DEA Technical and allocative efficiency 12 Portuguese airports No. of employees, capital No. of planes, no. of passengers, general cargo, mail cargo, sales to planes, sales to passengers Appold and Kasarda (2006) [37] Simple regression Commercial performance 75 American
airports No. of passengers
Food and beverage sales, non-food sales, total domestic sales, total sales (including duty-free)
Barros and Dieke (2007) [31]
DEA Performance 31 Italian airports Labour costs, capital invested, operational costs No. of planes, no. of passengers, general cargo, handling receipts, aeronautical sales, commercial sales Barros (2008a) [48] DEA Technical efficiency 13 Portuguese airports Operating costs, price of capital, price of labour Sales to planes, sales to passengers, non-aeronautical fees Barros (2008b) [32] DEA Technical efficiency 32 Argentina airports No. of labour, no. of runways, aprons area, passenger terminal area No. of planes, no. of passengers, cargo Barros (2008c) [35] SFA Technical efficiency 27 UK airports Operational cost, price of workers, price of capital-premises Price of capital investment, no. of passengers, aircraft movs. Fung et al. (2008) [28] DEA and TFP Productivity 25 Chinese airports Runway length, passenger terminal area No. of passengers, aircraft movs, tonnes of cargo
Airport Performance Analysis and Forecasting
Paper Method Object Units Inputs Outputs
Diana (2010) [34] SFA Technical efficiency 3 New York airports Airport operations, taxi-out delays, block delays, airborne delays, taxi-in delays, arrival delays, departure delays, arrival and departure rates System airport efficiency rates (SAER) Tovar and Martín-Cejas (2010) [6] SFA and TFP Technical efficiency and productivity 26 Spanish airports Labor, airport area, no. of gates Aircraft movs., average size of aircraft, share of non-aeronautical revenue Chao and Yu (2013) [41] Delphi/AHP and simple additive weight Cargo competitiveness 10 Asian-Pacific airports No. of airlines operating at airports, no. of flights, no. of source and destination cities, airport charges, airport opening hours, cargo clearance times, cargo volumes, cargo growth, GDP Competitiveness subtotal Baltazar et al. (2014) [43] MACBETH (MCDA) Productivity Passenger terminal area, cargo terminal area, aircraft parking stands, no. of runways, no. of boarding gates, no. of check-in desks, no. of baggage claim belts Aircraft movs., no. of passengers, tonnes of cargo Coto-Millan et al. (2014) [49] DEA Technical efficiency 35 Spanish airports Labour cost, capital invested, other expenses No. of passengers, aircraft movs., tonnes of cargo Lai et al. (2015) [50] AHP and DEA Productivity 25 European and Asian-Pacific airports No. of employees, no. of gates, no. of runways, terminal area, length of runway, operational expenditure Aircraft movs., no. of passengers, amount of freight and mail
Paper Method Object Units Inputs Outputs Da Rocha et al. (2016) [51] De Borda and AHP Operational performance 12 Brazilian airports Access, check-in, emigration, security inspection, immigration, customs, access airport facilities Performance score Fragoudaki and Giokas (2016) [30]
DEA Performance 38 Greek airports Runway length, apron size, passenger terminal area No. of passengers, aircraft movs., tonnes of cargo Fasone et al. (2016) [38] Ridge regression and PLS Commercial performance 15 German airports Nos. of passengers, %’s of passengers, aircraft movs., no. of operating airlines, surface of commercial activities, surface of non-aviation activities, no. of retail shops, no. of restaurants and food/beverage shops Non-aviation revenues per passenger, non-aviation revenues per square meter Cahill et al. (2017) [36] TFP Performance Dublin Airport Authority (DAA) Non-capital inputs (labour costs, cost of other inputs)
No. of passenger, deflated revenues
2.4
Conclusion
Airports not only serve a range of increasing needs related to transportation, but also encompass several services in a single infrastructure. Moreover, an airport accommodates several stake-holders with divergent interests that put pressure on its management units.
The network of influences of an airport is very complex, and it is not yet perfectly known, and its sustainability and success end up in depending in part on factors on which airport managers only have an indirect control. Added to this is the variety of ownership forms of the airports.
These complexities result in uncertainty in the definition most relevant performance indicators. International regulatory entities have set up a framework of performance measures, addressing that issue.
Due to air traffic’s exponential growth and the threat of congestion, it has been verified an increasing growth in airport performance and efficiency analysis in which several methods have been applied. From these, DEA and SFA are the most popular. However, alternative methods have shown promising results.
Chapter 3
Forecasting
3.1
Introduction
The rapid growth experienced by air transport industry over the most recent decades is expected to remain in the following years without a corresponding increase of investment in airport in-frastructures, resulting in a growing pressure to manage air transport system more efficiently [52]. Additionally, civil aviation is closely associated with the economic development of regions, and because of its increasing role in economic scenarios, it is necessary to ensure that future air transport needs are adequately assessed [53].
Keeping in mind the above considerations, reliable forecasts of civil aviation and airport man-agement activities play a critical role in the planning processes of the several organisations working in this industry. Forecasting is the process of making predictions of the future based on past and present data. It helps to make decisions regarding the development of infrastructures and evaluating air transport demand resulting in an improvement of services to passengers and reduced organisation’s risks. In civil aviation field, forecasts are used to [53]:
• Assist in the planning of airspace and airport infrastructure;
• Assist airlines in the long-term planning of equipment and route structures;
• Assist aircraft manufacturers in planning future specifications
So, after we analyse airport performance and efficiency considering past data relative to its indicators, we must then be able to predict its development in the following years. To do it, forecasters use any one of a range of forecasting techniques, of varying mathematical complex-ity and ,each of which, presenting different advantages and disadvantages.
Following, forecasting methodologies are presented as well as other aspects to be considered when predicting the future.
3.2
Methodologies
Over past decades, several applications of forecasting field to various sectors of civil aviation planning were developed resulting nowadays in a choice of ways to perform forecasts, ranging from purely intuitive approaches to structured and complex quantitative methods, like time-series techniques or econometric modelling, for representing air travel market.
ICAO refers that the first consideration about a forecast is its time horizon, which can be short-term (1 year), medium-short-term (1 to 5 years) or long-short-term (more than 5 years), depending on the
Airport Performance Analysis and Forecasting
Short-term forecasts involve some form of scheduling. Tactical or operational decisions stems from short-term traffic forecasts. For example, to determine best months to do repairs and maintenance in an airport it is necessary to predict its air passengers demand. Since it can be stated that this demand tends to follow a cyclical pattern, a short-term forecast may be enough since it is just necessary to determine peaks in each year.
Medium-term forecasts are prepared for planning, scheduling, budgeting and resource require-ment purposes, and trend factor join cyclical components as a key feature.
Lastly, long-term forecasts are used mostly in strategic planning to determine the level and direction of capital expenditures with the trend element dominating in these situations. Deci-sions on aircraft procurement, the opening-up of new routes and markets, the training of new flight crews and other similar decisions are all results from longer-term forecasts.
Forecasting methods can be divided into three broad categories: quantitative, qualitative and decision analysis (see Figure 3.1).
Figure 3.1: Alternative forecasting techniques. Adapted from [53].
Most common quantitative methods include time series techniques and econometric modelling.
Time-series approaches include trend projection and decomposition methods, which are the most used techniques for forecasting the traffic demand [54]. However, these methods are not able to identify causes of market growth neither can explain the impact of economic develop-ment or future regulations. Specifically, using trend projections the forecaster assumes that factors that determined the historical development and steady-state conditions will continue to be verified in the future. Due to air transportation industry’s complex nature, records of trend extrapolation forecasts have not been impressive [54]. Decomposition methods, by its turn, depict the various components of the problem, being particularly relevant when strong seasonality or cyclical patterns are verified in the historical data. These methods cannot also identify economic factors among others, making it more suitable for short-term forecasts.
Econometric analysis stands for multiple regression analysis with a price-income structure. Us-ing econometric analysis, analysts try to estimate the change in demand from year to year, which makes it more suitable for medium-term and long-term forecasts. It is a useful tool if we want to understand better the way an economic system works and for testing and evaluating alternative policies. However, it requires consistent historical data and good knowledge of the causative factors underlying traffic growth. Ahmadzade [55] identifies five steps involved in an econometric forecast:
• Selection of the relevant causal factors (independent variables);
• Collection of data;
• Specification of the type of functional relationship that exists between the dependent and the independent variables;
• Statistical estimating and testing of the proposed relationship between the dependent and independent variables. Statistical estimating and testing of the proposed relationship between the dependent and independent variables;
• Forecasting of the future development of variables from which the traffic forecast is sub-sequently derived.
Other quantitative methods include simultaneous equations models and spatial equilibrium.The first one addresses the issue of supply-demand interactions. An advantage of a simultaneous equations model is that it provides the values of several explanatory variables from within the model itself. However, estimation of the parameters of the equations involves more complex issues than those encountered in a single equation model [53]. Spatial equilibrium models es-tablish a relationship for the movement of traffic between any two traffic centres or regions which is, in a simplistic analysis, proportional to a characteristic related to the size and/or de-velopment of one or both regions and inversely proportional to the distance between regions.
Quantitative methods require historical data that represents some underlying pattern. When such data are short or not available, qualitative methods are used. Also, these methods are par-ticularly useful if one wants to assess how alternative developments would affect the forecast. However, qualitative methods are based on the judgment of experts being largely intuitive. The state of the art of these methods is not so consistent as in quantitative analysis as shown below.
Most widely used qualitative method is Delphi technique. Delphi is a method for attaining consensus among experts. Initial estimates are obtained from each expert. These estimates are arranged in a composite that shows each participant how his forecast compares to the group and a new forecast based on this information may be submitted [56]. After one or more rounds a consensus forecast may be obtained. Other qualitative methods include technological forecast-ing or specialists’ evaluation. Also, executive judgements are widely used, usually to modify and adapt more mathematical forecasts. Such judgement is based on the insight and assessment of a person, who may have the expertise of the route or market in question.
Airport Performance Analysis and Forecasting
a forecast. It is particularly useful in the assessment of uncertainty and risk analysis. Decision Analysis is used by major corporations to make multimillion-dollar capital investments but it has seen a limited application in airport performance academic research.
To sum up, different methods have been used depending on the forecasting time horizon and data availability among other features. Table 3.1 shows how some of these methods meet these criteria.
Table 3.1: Performances of airport demand forecasting methods. (H: high, M: medium, L: low). Adapted from [57]. Specialists’ evaluation Delphi method Market surveys Scenario writing Time-trend projections Econo-metrics Gravity methods Time-range of the forecast ability 1 year H H H H H H H 2-3 years M H M H H-M H H 5 years L M M M M-L H H 10 years L L L M L M M Required expertise H M H M M-L H H Required time L H L M L H H Data availability and accuracy M M M M H-M H H Cost M H M L L H H
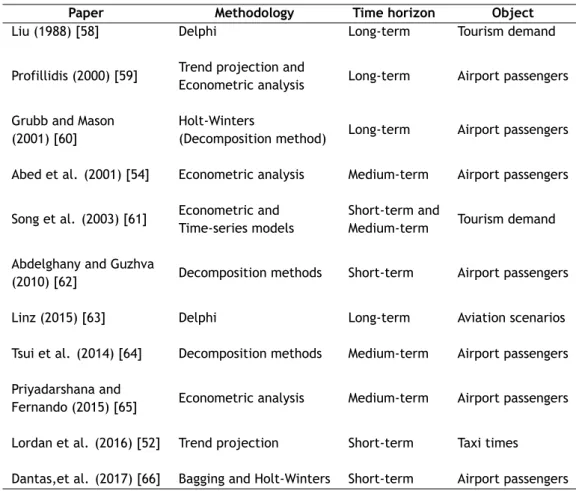
Forecasting researchers have been mainly focused on air traffic growth instead of airport per-formance. Three main methods have been used: decomposition, econometric methods and industry surveys (see Table 3.2).
Econometric analysis has been by far the most popular technique on air passenger demand fore-casting. For example, Abed et al. [54] and Priyadarshana and Fernando [65] used econometric methods to predict airport passenger demand. Econometrics models’ accuracy was examined by Song et al. [61] by using six econometric models and two univariate time series models for benchmark comparison purposes to predict Denmark tourism demand. They obtained more ac-curate short-term forecast from a TVP model while the static model generated more acac-curate forecasts for medium-term forecasts. Maximum-likelihood approach and ARIMA models gener-ated the least accurate forecasts.
Table 3.2: Summary of forecasting studies on airports. Source: own elaboration.
Paper Methodology Time horizon Object
Liu (1988) [58] Delphi Long-term Tourism demand
Profillidis (2000) [59] Trend projection and
Econometric analysis Long-term Airport passengers
Grubb and Mason (2001) [60]
Holt-Winters
(Decomposition method) Long-term Airport passengers
Abed et al. (2001) [54] Econometric analysis Medium-term Airport passengers
Song et al. (2003) [61] Econometric and Time-series models
Short-term and
Medium-term Tourism demand
Abdelghany and Guzhva
(2010) [62] Decomposition methods Short-term Airport passengers
Linz (2015) [63] Delphi Long-term Aviation scenarios
Tsui et al. (2014) [64] Decomposition methods Medium-term Airport passengers
Priyadarshana and
Fernando (2015) [65] Econometric analysis Medium-term Airport passengers
Lordan et al. (2016) [52] Trend projection Short-term Taxi times
Dantas,et al. (2017) [66] Bagging and Holt-Winters Short-term Airport passengers
Profillidis [59] used a conventional regression method (trend projection) to forecast future de-mand of the airport of Rhodes by extrapolating past passenger growth trends using a polynomial trend as well as an econometric model and a fuzzy regression method for comparison. Lordan et al. [52] used log-linear regression analysis to estimate taxi times which proved to have a strong predictive validity.
Decomposition methods have also seen several applications in air passengers demand forecasts. Abdelghany and Guzhva [62] used an autoregressive moving average model (ARMA) for fore-casting short-term airport demand and emphasise that “while the model is more appropriate for short-term prediction (0–2 years), its use can be extended for longer-term forecasting (2–5 years)” [62, pp.86] Tsui et al. [64] employed the Box-Jenkins Seasonal ARIMA (SARIMA) model and the ARIMAX model to forecast airport passenger traffic for Hong Kong and projecting its fu-ture growth trend to 2015. Another particularly popular decomposition method is Holt-Winters method which consists of an exponential smoothing technique that depicts three components: level, trend and seasonal. Grubb and Mason [60] introduced a modification to the Holt–Winters method that greatly improves forecasting performance for long lead-times, by damping the fu-ture trend towards the historical average trend. Dantas et al. [66], by their turn, introduced a combination of the Bootstrap aggregating (Bagging) method with the exponential smoothing Holt-Winters method to the air industry to predict future demand for air transportation.
Delphi method has been used for many years, and it has been mainly applied in long-term forecasts. Liu [58] used this technique to forecast tourism to Hawaii, particularly Oahu, by the
Airport Performance Analysis and Forecasting
anticipate probable and wildcard scenarios on the future of aviation in 2025 using a Delphi panel of aviation experts.
3.3
Conclusion
Forecasts play a fundamental role in the planning activities, not only in airports but several organisations working in the aviation industry.
Several forecasting methods have emerged over the past years. These can be classified into quantitative, qualitative and decision analysis.
The most accurate forecasting technique may differ from study to study depending on several criteria, such as the intended time horizon, data nature and availability, forecaster expertise, etc.
The literature review presented in this chapter shows that econometric analysis and decompo-sition methods are among the most popular. The first one becomes notorious when longer-term forecasts are needed or when the forecaster intends to infer a cause-and-effect relationship. The second one has been mainly used in short-term and medium term-forecasts and when time series present cyclical or seasonal patterns. Also, trend-projections have been used for shorter-term forecasts. Among qualitative methods, Delphi is the most popular, and it has been mostly employed in long-term forecasts.
Chapter 4
Case Study
4.1
Introduction
This chapter depicts the attempts to predict and model the impact that changes that may occur in core indicators have on airport performance.
In this study, airport performance is measured through the score obtained from PESA-AGB model [67] (see Figure 4.1) built to assess airports performance and efficiency through a self and peer benchmark for three main international airports managed by the same group - Airport 1, Airport 2 and Airport 3 being, respectively representative of Humberto Delgado Airport, Francisco Sá Carneiro Airport and Faro Airport operated by the airport group VINCI/ANA S.A.
Figure 4.1: PESA-GB model building tasks. Source: [67].
This model is based on MACBETH methodology. Its decision tree, from which performance de-scriptors stem, was built upon the KPAs and KPIs mentioned above and it uses expert’s judgement to obtain an ordinal value scale. The descriptors and the ordinal value scales are used to derive the value functions and weight ponderations which, by their turn, are used to get the score. An overview of the PESA-AGB model is shown in Annexe A.2.
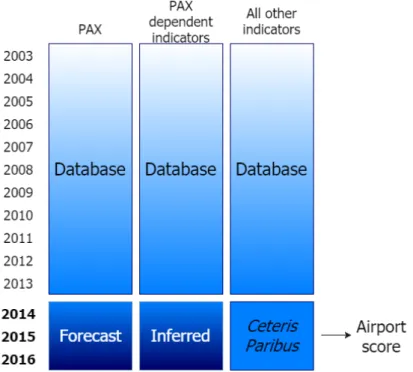
This model is fed by a database gathering data for the three airports for all KPIs of each KPA re-trieved from airports annual public sustainability reports for the years 2003 to 2013 [68, 69, 70]
1. It contains partial data collected from the public reports for the mentioned airports. Missing
data were inferred from world airports similar in category and scale (passengers and move-ments). Database can be consulted in Annexe A.3.
Three case studies were developed consisting of the analysis of passengers’ growth, aircraft
1
Airport Performance Analysis and Forecasting
movements’ growth and simultaneous passenger and aircraft movements’ growth on the airport score as described in Figure 4.2. The choice of these indicators is explained by their weight in the Core area (see Figure 4.3).
Figure 4.2: Case studies process. Source: own elaboration.
Figure 4.3: Core Key Performance Indicators’ weights. Adapted from [67].
These case studies intended to answer the following questions:
“What is the impact of passengers/movements growth in airport score keeping the ce-teris paribus? Is there a direct, quantifiable relationship?”
Firstly, medium-term forecasts (3 years) were performed on the considered indicators for the Airport 1. All the other indicators were held constant, assuming what in economics is named
ceteris paribus condition. A ceteris paribus assumption is often key to scientific inquiry, as
scientists seek to screen out factors that perturb a relation of interest [2]. This new scenario is inserted on PESA-AGB to observe the changes in the KPA’s score and airport score. The relation-ship between the number of passengers or aircraft movements and the airport score is analysed to figure out if it can be quantified through a cost function as follows:
yt= b0+ b1× xt+ ... + e (4.1)
• y is the dependent variable (airport score in the case of this study);
• b is a constant;
• X is the independent variable (passengers or aircraft movements);
• e is the error;
• t is the year;
4.2
Case I - Passengers
4.2.1
Hypothesis 1
For passengers’ growth impact analysis, it was first considered to vary the numerical values only for the passengers’ indicator, keeping all other indicators unchanged, and observe the corresponding changes in the airport score as shown in Figure 4.4.
Figure 4.4: Process used to conduct Hypothesis I. Source: own elaboration.
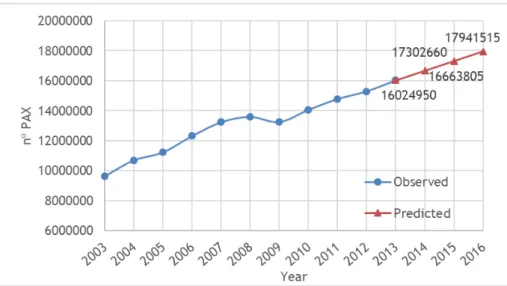
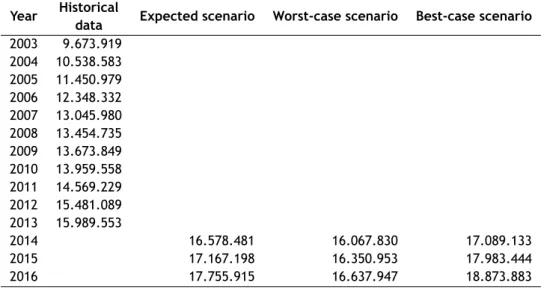
The forecast process adopted in this hypothesis consists merely in the projection of the number of passengers for the following three years maintaining the same average growth rate verified during the historical data time span. The values obtained are presented in Figure 4.5.
The behaviour of the curve changes slightly from 2013 once it was applied the constant in-crease corresponding to the average growth observed in the previous years. The number of passengers obtained from the trend projection was assumed as achievable since the capacity of Lisbon airport projected for 2013 was about 18 million passengers [2]. The Value Function of the PESA-AGB model allows comparing the scores obtained from the projected number of
Airport Performance Analysis and Forecasting
Figure 4.5: Projection of the number of passengers in Airport 1 for the years 2014-2016. Source: own elaboration.
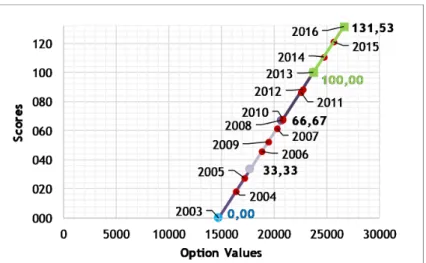
Figure 4.6: Value function for Passengers KPI of the Airport 1 Core KPA. Source: own elaboration.
Originally, Value Function consists in the characterisation of the criteria values in a set of 3 linear equations, working like thermometers. For this analysis, a fourth set was created to keep the previous score scale and to identify better the years in which the best score registered was exceeded. The scores obtained for the forecasting period overtook the previous best result recorded in 2016 as expected, since the growth rate for the years 2003-2013 is positive (see 4.1).
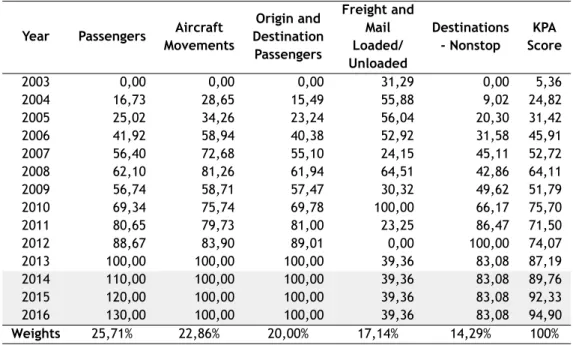
The increase of Passengers KPI’s score led the corresponding KPA’s score to annual increases of 2,86%, 2,79% and 2,71% in the 3 years forecasted, resulting in an increase of 5,42% from 2013 to 2016 (see Table 4.2).
Table 4.1: Historical and predicted no. of passengers and KPA’S score (hypothesis I). Source: own elaboration.
Year Value Score
2003 9.636.400 0,00 2004 10.705.000 16,73 2005 11.234.700 25,02 2006 12.314.314 41,92 2007 13.239.756 56,40 2008 13.603.620 62,10 2009 13.261.203 56,74 2010 14.066.534 69,35 2011 14.788.480 80,65 2012 15.301.176 88,67 2013 16.024.950 100,00 2014 16.663.805 110,00 2015 17.302.660 120,00 2016 17.941.515 130,00
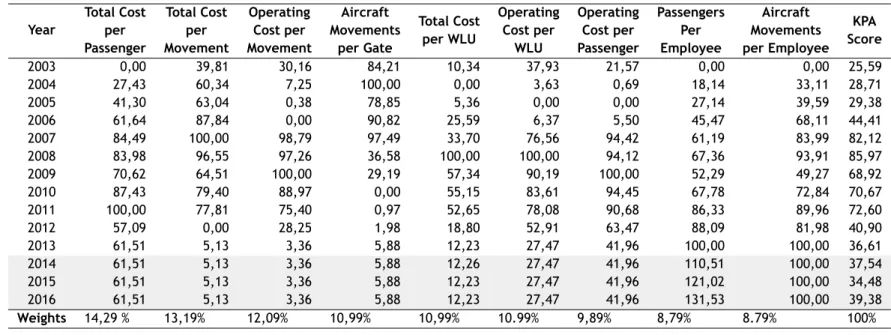
Table 4.2: Core KPIs’ scores and KPA’s score. Source: own elaboration.
Year Passengers Aircraft Movements Origin and Destination Passengers Freight and Mail Loaded/ Unloaded Destinations - Nonstop KPA Score 2003 0,00 0,00 0,00 31,29 0,00 5,36 2004 16,73 28,65 15,49 55,88 9,02 24,82 2005 25,02 34,26 23,24 56,04 20,30 31,42 2006 41,92 58,94 40,38 52,92 31,58 45,91 2007 56,40 72,68 55,10 24,15 45,11 52,72 2008 62,10 81,26 61,94 64,51 42,86 64,11 2009 56,74 58,71 57,47 30,32 49,62 51,79 2010 69,34 75,74 69,78 100,00 66,17 75,70 2011 80,65 79,73 81,00 23,25 86,47 71,50 2012 88,67 83,90 89,01 0,00 100,00 74,07 2013 100,00 100,00 100,00 39,36 83,08 87,19 2014 110,00 100,00 100,00 39,36 83,08 89,76 2015 120,00 100,00 100,00 39,36 83,08 92,33 2016 130,00 100,00 100,00 39,36 83,08 94,90 Weights 25,71% 22,86% 20,00% 17,14% 14,29% 100%
The increases observed for airports performance score are mild with annual increases of 0,83% for the first forecasted year and 0,82% for each of the other two years (see Table 4.3). The percentage increase between 2013 and 2016 was 1,63% which is lower than, for example, the percentage increase recorded between 2012 and 2013.
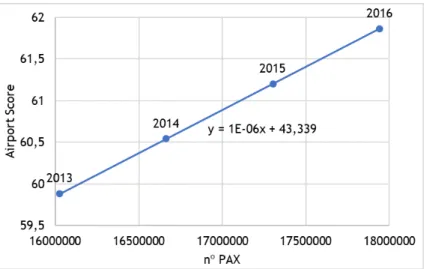
As could be expected, the airport score variation according to the number of passengers is described by a linear function as shown in Figure 4.7. The function equation was obtained through a trend line whose R squared is 1, which means that describes the totality of the origi-nal function.
Airport Performance Analysis and Forecasting
Table 4.3: KPAs’ scores and Airport 1 performance score. Source: own elaboration.
Year Safety and Security Core Productivity/ Cost effectiveness Service Quality Financial/ Commercial Envirom mental Airport Score 2003 69,37 5,36 25,59 24,64 68,27 5,81 34,95 2004 44,14 24,82 28,71 25,83 49,34 12,15 31,92 2005 58,67 31,42 29,38 31,09 53,32 38,56 41,08 2006 75,22 45,91 44,41 37,23 45,58 40,03 50,05 2007 87,06 52,72 82,13 50,50 46,43 40,65 62,56 2008 81,75 64,11 85,97 44,32 40,15 37,92 62,12 2009 58,15 51,79 68,92 41,72 52,19 53,95 54,96 2010 50,99 75,70 70,67 59,34 42,98 45,50 58,55 2011 72,51 71,50 72,60 62,66 55,71 57,48 66,60 2012 56,95 74,07 40,90 58,06 42,36 69,55 57,11 2013 73,47 87,19 36,61 65,64 15,81 70,29 59,88 2014 73,47 89,76 36,61 65,64 15,81 70,29 60,38 2015 73,47 92,33 36,61 65,64 15,81 70,29 60,89 2016 73,47 94,90 36,61 65,64 15,81 70,29 61,39 Weights 21,95% 19,51% 17,07% 14,63% 14,63% 12,20% 100%
Figure 4.7: Airport Score as a function of the number of passengers (Hypothesis I). Source: own elaboration.
4.2.2
Hypothesis 2
Identifying which indicators could be affected directly or indirectly by the passengers’ growth may be an arduous task, and it may require a deeper econometric analysis to establish the re-lationships between different KPIs from different KPAs. However, it is possible to observe that some indicators are directly influenced by passengers’ indicator being easy to determine the in-crease of the correspondent value without interfering with ceteris paribus condition. Observing the indicators’ metrics, we can see, for example, that the value of passengers per employee rate is given by dividing the number of passengers by the number of employees of the airport. Metrics of some other indicators include the number of passengers in the denominator. Those indicators were kept unchanged since the increase of the number of passengers would result in its decrease. Such assumption would imply a drop of the airport performance. Considering this, for this second hypothesis it was decided to work only on the Passengers Per Employee KPI in addition to Passengers indicator (see figure 4.8). For this, it was determined the number of
![Figure 2.1: Performance Indicators in Six Key Performance Areas. Adapted from [21].](https://thumb-eu.123doks.com/thumbv2/123dok_br/18037779.861883/31.892.252.685.357.879/figure-performance-indicators-key-performance-areas-adapted.webp)
![Figure 2.2: Quantitative Methodologies to Assess Productivity and Efficiency. Adapted from [29].](https://thumb-eu.123doks.com/thumbv2/123dok_br/18037779.861883/33.892.203.728.210.605/figure-quantitative-methodologies-assess-productivity-efficiency-adapted.webp)