Modelos de crescimento não-lineares para girinos de rã-touro
Cleber Fernando Menegasso Mansano1, Marta Verardino De Stéfani2, Marcelo Maia Pereira2, Beatrice Ingrid Macente3
ABSTRACT
Describing animal growth rate using non-linear models allows a detailed evaluation of growth behavior. Four non-linear models were used to fit weight gain and total length data of bullfrog (Lithobates catesbeianus) tadpoles, as follows: Gompertz, Y =
A exp (-exp (-b (t-T))); Von Bertalanffy, Y = A (1 - K exp (-B t))3; Logistic, Y = A (1+ K exp (-B t))-1 and Brody, Y=A (1 - K exp
(-B t)). We used 3,240 tadpoles, with average initial weight 0.044 g and average total length 12.79 mm, stage 25 Gosner. The measurements were conducted every ten days on 10% of the animals in every tank. The criteria used to select the model that best described the growth curve were: Residual Mean Square (RMS); determination coefficient (R²); residual graphical analysis; residual mean absolute deviation (MAD). Brody mathematical model was not a good fit for weight gain and total length, while Von Bertalanffy model underestimated tadpole initial weight, thus showing the difficulty of mathematical models to describe biological data at this growth stage. However, the Gompertz and Logistic models were considered to be an adequate fitting to describe growth rate and total length of bullfrog tadpoles in captivity.
Index terms: Frog farm, growth curve, Lithobates catesbeianus.
RESUMO
Descrever o crescimento animal em modelos não lineares permite uma avaliação criteriosa desse comportamento, além de revelar informações importantes da resposta a um determinado tratamento. Neste estudo objetivou-se avaliar o ajuste do crescimento em peso e comprimento total de girinos de rã-touro (Lithobates catesbeianus) em quatro modelos não lineares: Gompertz, Y = A
exp (-exp (-b (t-T))); Von Bertalanffy, Y = A (1 - K exp (-B t))3; Logístico, Y = A (1+ K exp (-B t))-1 e Brody, Y=A (1 - K exp (-B t)).
Foram utilizados 3.240 girinos, com peso médio inicial de 0,044g e comprimento total médio de 12,79 mm, no estágio 25 de Gosner. Os critérios utilizados para selecionar o modelo que melhor descreveu a curva de crescimento foram: o quadrado médio do resíduo (QMR); o coeficiente de determinação (R2); análise gráfica dos resíduos; desvio médio absoluto dos resíduos (DMA). Os dados
apresentados para peso e comprimento total não se ajustaram ao modelo de Brody, assim como o modelo de Von Bertalanffy subestimou os pesos iniciais, mostrando dificuldade de interpretação biológica, indicando que esses modelos não são apropriados para essa espécie na fase aquática. Os modelos de Gompertz e Logístico são adequados para descrever o crescimento e comprimento de girinos de rã-touro em cativeiro.
Termos para indexação: Ranicultura, curva de crescimento, Lithobates catesbeianus.
(Received in june 21, 2012 and approved in july 20, 2012)
1Universidade Estadual Paulista/UNESP – Centro de Aquicultura – Via Professor Paulo Donato Castellane – s/n – 14884-900 – Jaboticabal – SP – Brasil –
2Universidade Estadual Paulista/UNESP – Centro de Aquicultura – Jaboticabal – SP – Brasil
3Universidade Estadual Paulista/UNESP – Departamento de Reprodução e Obstetrícia – Jaboticabal – SP – Brasil
INTRODUCTION
Frog culture in Brazil has shown, over the years, a great potential to produce good quality animal protein with low fat content. However, this area needs to be further explor ed by developing tools to assist researchers, technicians and producers to maximize production and minimize expenses in order to make frog breeding a more lucrative and attractive business (DIAS et al., 2010), and sustainable as well (BOSMA; VERDEGEM, 2011) to fulfill the need for a growing food demand with decreasing use of natural resources (SCHNEIDER et al., 2011).
Non-linear models consist of mathematical functions that are capable of describing growth rates during animal life span, making the growth rate more predictable and condensing the information of a data series into a small set of biologically interpretable parameters (SANTOS et al., 2007). The main models used to describe non-linear growth of aquatic animals are: Gompertz, Von Bertalanffy, Logístico and Brody (GOMIERO et al., 2009).
types of frogs (HOTA, 1994). In addition, the same non-linear models were a good fit for the terrestrial phase, while Gompertz and Logistic were the best fit for bullfrog in captivity (RODRIGUES et al., 2007) and Von Bertalanffy for pepper-frog (Leptodactylus labyrinthicus)
(AGOSTINHO et al., 1991).
It is, therefore, necessary to apply mathematical models to better describe growth rates and characteristics, and how they relate to each other. This information is crucial to understand the processes involved in the growth of tadpoles and contributes to more effective use of nutrients to gain biomass.
This study was conducted to determine the best fittings of non-linear models for average growth pattern regarding body weight and total length of bullfrog tadpoles in captivity.
MATERIAL AND METHODS
The experiment was conducted at Aquaculture Center, CAUNESP, Jaboticabal, São Paulo, Brazil, from November, 2010 to January, 2011.
We used 3,240 bullfrog tadpoles (Lithobates
catesbeianus) with average initial weight and total length
of, respectively, 0.044g and 12.79 mm, stage 25 (GOSNER, 1960). These tadpoles originated from the same spawn in the Raniculture Section of the Aquaculture Center, UNESP. The tadpoles were housed in 18 asbestos tanks with 100 L capacity. These tanks were filled up with 90 L of water, equipped with individual water supply and drainage directly from the bottom. The water was supplied by a well and it was fully renewed (100%) every 24 hours. In order to maintain water quality, the tanks were siphoned every other day to remove feces and uneaten food.
Highest and lowest temperatures of both, room and water, were measured daily using a digital thermometer (maximum and minimum digital thermometer, Incoterm). Dissolved oxygen values (YSI professional oxygen meter), conductivity (handset conductivity meter Model CD-203 – PHTEK) and pH (handset pHmeter model pH100 -PHTEK) were determined weekly.
The tadpoles were fed a diet containing 26.23% digestible protein (Table 1). Feed was offered freely three times a day, but avoiding surplus, so it was assumed that all the food was consumed (SOLOMON; TARUWA, 2011). Live weight and total length data were obtained on days 1 (stage 25 of GOSNER, 1960), 13, 23, 33, 42, 55 and 64. The experiment finished when 20% of the tadpoles reached metamorphosis climax (stage 42 of GOSNER, 1960), that is, when they stopped feeding and started using the accumulated reserves (WRIGHT; RICHARDSON; BIGOS,
2011). Subsequently, samples consisting of 10% of the tadpoles from each tank were weighed on a digital scale (0.01g) and measured using digital caliper (0.001mm).
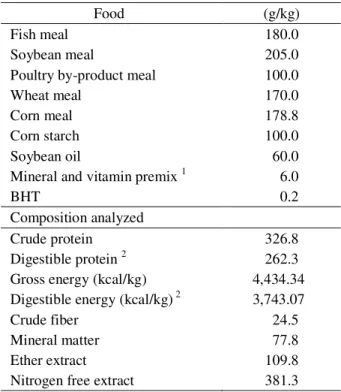
Table 1 – Formula and nutritional composition of the diet used.
Food (g/kg)
Fish meal 180.0
Soybean meal 205.0
Poultry by-product meal 100.0
Wheat meal 170.0
Corn meal 178.8
Corn starch 100.0
Soybean oil 60.0
Mineral and vitamin premix 1 6.0
BHT 0.2
Composition analyzed
Crude protein 326.8
Digestible protein 2 262.3
Gross energy (kcal/kg) 4,434.34
Digestible energy (kcal/kg) 2 3,743.07
Crude fiber 24.5
Mineral matter 77.8
Ether extract 109.8
Nitrogen free extract 381.3
1Moisture (%) 2.0; Ash (%) 71.6442; Choline (mg/kg) 30,000;
Magnesium (%) 0.0085; Sulfur (%) 1.1589; Iron (mg/kg) 25,714; Copper (mg/kg) 1,960; Manganese (mg/kg) 13,345; Zinc (mg/kg) 30,000; Iodine (mg/kg) 939; Selenium (mg/kg) 30; Vitamin A (UI/kg) 600,000; Vitamin D3 (UI/kg) 600,000; Vitamin E (mg/kg) 12,000; Vitamin K3 (mg/kg) 631; Thiamin B1 (mg/kg) 1,176; Riboflavin B2 (mg/kg) 1,536; Pyridoxine B6 (mg/kg) 1,274; Vitamin B12 (mcg/kg) 4,000; Niacin (mg/ kg) 19,800; Pantothenic Acid B3 (mg/kg) 3,920; Folic Acid (mg/kg) 192; Biotin (mg/kg) 20; Vitamin C (mg/kg) 40,250.
2Calculated from digestibility by Secco, Stéfani and Vidotti
(2005).
Four non-linear models were used to find the best fit to the average growth rate curves, as follows: Gompertz, Y = A exp (-exp (-b (t-T))); Von Bertalanffy, Y = A (1 - K exp (-B t))3; Logistic, Y = A (1+ K exp (-B t))-1 and Brody, Y=A (1 - K exp (-B t)).
Bertalanffy, Logistic and Brody models; “b” and “B” = growth rate at maturity; “T”= growth rate at maturity for the Gompertz model, where it represents the day of maximum growth. When the parameters were adjusted, we used the NLIN procedure of Statistical Analyses System-SAS (2001), and the parameter estimates were obtained by iterative modified Gauss-Newton method, developed by Hartley (1961), for non-linear models.
The criteria used to select the model that best described the growth curve were: Residual Mean Square (RMS); determination coefficient (R2) calculated as the square of the correlation between the observed and the estimated weights, which is equivalent to 1 - (SSR-TSSc) (SOUZA, 1998), wherein SSR is the sum of squares of the residue and TSSc the total sum of squares corrected by the average; residual graphical analysis; residual mean absolute deviation (MAD) (SARMENTO et al., 2006), calculated as: MAD = n
i=1 [Yi – ˆYi] /n, where Yi is the observed value, ˆYi , the estimated values and n, sample size. The lower the MAD value, the better the fit; the curve shape; the number of iterations and biological interpretation of the parameters.
Distribution of studentized residuals, ti* = ti (n – p – 1 / n – p - ti2) 1/2 where t
i*= studentized residual, ti= standardized residual, n= number of observations, p= equation estimators, these diagnostic measures were used for detect aberrant points (LEMONTE, 2008).
RESULTS AND DISCUSSION
Lowest and highest water temperatures during the experimental period were 24.2 ± 1.4 and 26.0 ± 1.2° C, respectively. These values are within the optimal range for growing tadpoles (24.5 to 29.1º C) (LIMA; CASALI;
AGOSTINHO, 2003; BAMBOZZI et al., 2004; HAYASHI et al., 2004; SEIXAS FILHO et al., 2008). Water temperature directly affects tadpole metabolism due to its ectothermic quality, that is, favorable thermal conditions speed up growth rate and body weight gain (Hoffman et al., 1989).
Average levels of dissolved oxygen in the water (3.07±0.92 mg/L) were within the acceptable limit for growing tadpoles, according to Hailey et al. (2006). Water conductivity in the tanks (38±0.26 µm/cm) was also within the range established by Sipaúba (1994), between 23.0 and 71.0 µS/cm, for aquatic organisms in earthen ponds. Average pH of the water (6.17±0.34) was also close to the value of 6.5 determined by Albinati, Lima and Donzele (2001).
In order to validate the mathematical model, several precautions were taken during the experimental period such as, adequate population density and feed supply and constant water temperature as well, following recommendations by Browne, Pomering and Hamer et al. (2003).
The growth parameter values, body weight and total length, given by the mathematical models are shown in table 2. It can also be seen that the convergence criteria was reached in the Gompertz, Von Bertalanffy and Logistic models. The Brody model did not converge to the data set for weight and length observed in this paper.
The asymptotic or mature weight (A) (Table 2) found for the Logistic model displayed the lowest value, followed by the Gompertz and Von Bertalanffy models. For total length at maturity, parameter A displayed the same behavior. The values of A for the models studied here are biologically interpretable for bullfrog tadpoles.
Table 2 – Parameter estimates and standard error of the models studied for body weight and total length of bullfrog tadpoles.
Model Estimates of the parameters
A b K T B
Body Weight
Gompertz 10.66±1.052 0.0558±0.0088 - 38.19±2.2963 -
V. Bert. 13.36±1.964 - 1.216±0.1543 - 0.033±0.0060
Logistic 8.90±0.410 - 98.422±8.0619 - 0.112±0.0119
Total Length
Gompertz 119.0±3.570 0.0338±0.0020 - 22.01±0.9691 -
V. Bert. 131.2±5.578 - 0.568±0.0098 - 0.028±0.0019
Logistic 104.7±1.881 - 6.710±0.3482 - 0.068±0.0027
Similar behavior of A was observed when these same nonlinear models were used to describe the growth rate of Santa Inês sheep (SARMENTO et al., 2006), tilapia
(Oreochormis niloticus) (SANTOS et al., 2007) and
piracanjuba (Brycon orbignyanus) (GOMIERO et al.,
2009).
The body weight (8.17g) observed at the end of 64 experimental day was reached when 20% of the animals displayed metamorphic climax, but the remaining animals continued to grow until metamorphosis was complete. Therefore, the Gompertz model estimated 10.66 g body weight at the end of metamorphosis for these animals, close to the value reported by Castro and Pinto (2000) of 10.73g on the 90th day, when temperature ranged between 24.5 and 27.5º C.
The parameters b of Gompertz and B of Von Bertalanffy and Logistic models (Table 2), represent the growth rate at maturity, where the lowest value of these parameters represents the highest weight and total length at maturity (FREITAS, 2005). The Logistic model yielded the highest value, among the three models, and the lowest body weight and total length at maturity. The opposite was observed for the Von Bertalanffy model that displayed the lowest K value and, consequently, the highest body weight and total length at maturity.
The values of R2 (Table 3) found for all models were excellent, with minor differences for both body weight and total length. However, R2 is not reliable to determine the best fit for nonlinear models (SILVA et al., 2011). The values found for RMS for all models, show no significant differences among them for both body weight and total length (Table 3), which can also be observed from the MAD values (Table 3).
As for the number of iterations, the lower value is the better, since it shows whether the curve parameters adjusted all the data together. Among the models, the Gompertz yielded the lowest number of iterations to adjust weight gain, which shows how easy it was to obtain a good fit between the estimated and observed data (Table 3).
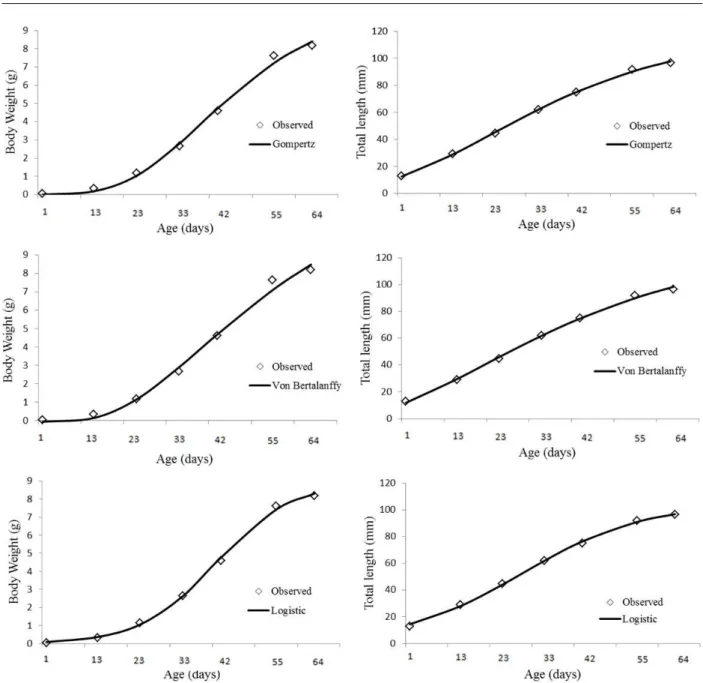
The Von Bertalanffy model yielded negative values and consequently, it underestimated tadpole initial weight (Figure 1). The Logistic model displayed the final value closest to the one observed; however, it overestimated the initial value (Figure 1). The Gompertz model overestimated slightly the final value compared to the Logistic model, but the initial values were better and the overall fitting was also better (Figure 1).
The growth curves for body weight estimated by the models displayed sigmoidal shape (Figure 1). According to Vargas et al. (2005), when the curve displays a higher and longer plateau, animal growth is more efficient. The estimated curves for total length (Figure 1) do not display the characteristic sigmoidal shape of those found for body weight.
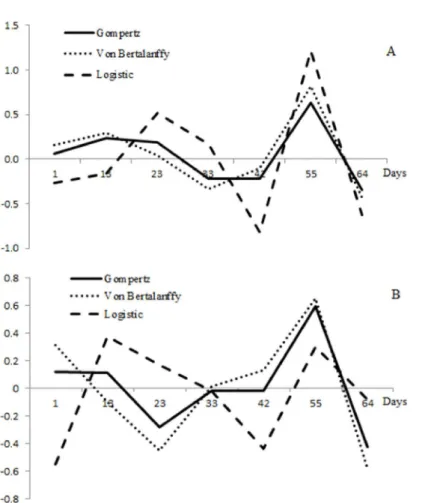
As for total length, the Gompertz and Von Bertalanffy models displayed similar characteristics and both were good fit. The Logistic model, despite its particularities regarding residual dispersion, has shown fairly homogeneous characteristics. Therefore, these three models are reliable to predict the total length of tadpoles (Figure 2).
The models used in this study had advantages and disadvantages. The Logistic model had the lowest residual dispersion for body weight, but the discrepancies between 33 and 64 days old were accentuated (Figure 2). According to Guedes et al. (2004), the Logistic model describes adequately laboratory growth rate of live organisms with simple life cycles, but it does not describe adequately complex life cycles.
Residual dispersion (Figure 2) shows similar adjustment for these three models. It alternates along the period the best fit. The residual dispersion of the Von Bertalanffy model was close to the values observed for the Gompertz model (Figure 2); however, it underestimated animal initial weight and overestimated the weight and length total at maturity (Figure 1). The Von Bertalanffy model is used by several authors due their versatile, because describe of growth of many species of animals studied (FREITAS, 2005). However, it has the disadvantage of not describing adequately initial growth (GAMITO, 1998).
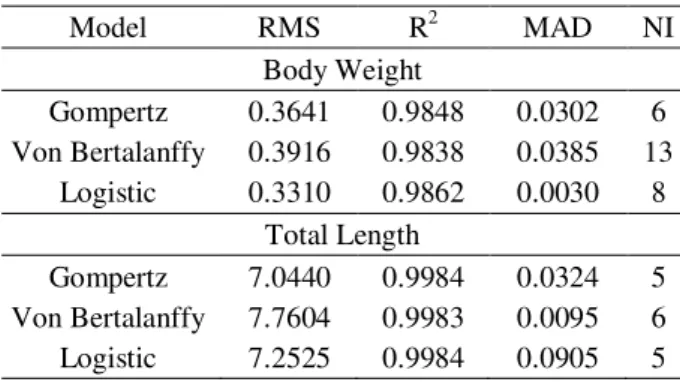
Table 3 – Residual mean square (RMS), coefficient of determination (R²), mean absolute deviation (MAD) and number of iterations (NI), according to the models studied to body weight and total length of bullfrog tadpoles.
Model RMS R2 MAD NI
Body Weight
Gompertz 0.3641 0.9848 0.0302 6
Von Bertalanffy 0.3916 0.9838 0.0385 13
Logistic 0.3310 0.9862 0.0030 8
Total Length
Gompertz 7.0440 0.9984 0.0324 5
Von Bertalanffy 7.7604 0.9983 0.0095 6
Figure 1 – Mean weights and total length observed and pre-determined in relation to age. Gompertz, Von Bertalanffy and Logistic models.
The Gompertz model had lower r esidual scattering for body weight and total length (Figure 2) and displayed good fit for initial weight and total length; however, it overestimated weight and total length at 64 days old. Anuran tadpoles have rapid growth and short life cycle (MONELLO et al., 2006) and the Gompertz model is considered to adequately describe the species growth (GAMITO, 1998). These
characteristics allow excellent fitting to nonlinear models, such as Gompertz, Von Bertalanffy and Logistic (HOTA, 1994), mainly for weight as a function of time (days) (SOCKMAN et al., 2008).
The data presented in this study did not fit adequately the Brody and Von Bertalanffy models, the latter underestimated initial weight, thus showing the difficulty of biological interpretation and the inadequacy of the models to describe this species during the aquatic phase.
CONCLUSION
Among the four models evaluated, the Gompertz and Logistic models were found to adequately describe the body weight and total length of bullfrog tadpoles raised in captivity.
ACKNOWLEDGMENTS
The authors thank FAPESP funding the study and for the M. S. scholarship.
REFERENCES
AGOSTINHO, C.A. et al. Curvas de crescimento de rãs-pimenta, Leptodactylus labyrinthicus (Spix, 1824).
Revista Sociedade Brasileira de Zootecnia, Viçosa, v.20, n.1, p.47-54, 1991.
ALBINATI, R.C.B.; LIMA, S.L.; DONZELE, J.L. Níveis de energia digestível na ração de girinos de rã-touro. Revista Brasileira de Saúde e Produção Animal, Salvador, v.2, n.2, p.48-52, 2001.
BAMBOZZI, C.A. et al. Efeito do fotoperíodo sobre o desenvolvimento de girinos de rã-touro (Rana
catesbeiana Shaw, 1802). Revista Brasileira de
Zootecnia, Viçosa, v.33, n.1, p.1-17, 2004.
BOSMA, R.H.; VERDEGEM, M.C.J. Sustainable aquaculture in ponds: Principles, practices and limits. Livestock Science, Amsterdam, v.139, n.1, p.58-68, 2011. BROWNE, R.K.; POMERING, M.; HAMER, A.J. High density effects on the growth, development and survival
of Litoria aurea tadpoles. Aquaculture, Amsterdam,
v.215, n.1, p.109-121, 2003.
CASTRO, J.C.; PINTO, A.T. Qualidade da água em tanques de girinos de rã-touro, (Rana catesbeiana
Shaw, 1802), cultivados em diferentes densidades de estocagem. Revista Brasileira de Zootecnia, Viçosa, v.29, n.6, p.1903-1911, 2000.
DIAS, D.C. et al. Haematologic and immunologic parameters of bullfrogs, Lithobates catesbeianus, fed
probiotics. Aquaculture Research, Malden, v.41, n.7, p.1064-1071, 2010.
FREITAS, A.R. Curvas de crescimento na produção animal. Revista Brasileira de Zootecnia, Viçosa, v.34, n.3, p.786-795, 2005.
GAMITO, S. Growth models and their use in ecological modelling: an application to a fish population. Ecological Modelling, Amsterdam, v.113, n.1, p.83-94, 1998.
GOMIERO, J.S.G. et al. Curvas de crescimento morfométrico de Piracanjuba (Brycon orbignyanus).
Ciência e Agrotecnologia, Lavras,v.33, n.3, p.882-889, 2009.
GOSNER, K. L. A simplified table for staging anuran embryos and larvae with notes on identification. Herpetologica, Emporia, v.16, n.2, p.183-190, 1960. GUEDES, M.H.P. et al. Estudo da curvas de crescimento de cordeiros das raças Santa Inês e Bergamácia
considerando heterogeneidade de variância. Ciência e Agrotecnologia, Lavras, v.28, n.2, p.381-388, 2004. HAILEY, A. et al. Factors affecting tadpole growth: Development of a rearing system for the Neotropical leptodactylid Physalaemus pustulosus for
ecotoxicological studies. Applied Herpetology, Paleiden, v.3, n.1, p.111-128, 2006.
HAYASHI, C. et al. Desenvolvimento de girinos de rã-touro (Rana catesbeiana Shaw, 1802) cultivados em
diferentes densidades de estocagem em tanque-rede. Revista Brasileira de Zootecnia, Viçosa, v.33, n.1, p.14-20, 2004.
HARTLEY, H.O. The modified Gauss Newton method for the fitting of non linear regression functions by least squares. Thechnometrics, Alexandria, v.3, n.2, p.269 280, 1961.
HOFFMANN, D.F.; LEBOUTE, E. M.; SOUZA, S.M.G. Efeito da temperatura e desenvolvimento de girinos de rã-touro (Rana catesbeiana Shaw, 1802). Revista Sociedade Brasileira Zootecnia, Viçosa, v.18, n.6, p.557-566, 1989. HOTA, A.K. Growth in amphibians. Gerontology, Basel, v.40, n.2, p.147-160, 1994.
LEMONTE, A.J. Diagnóstico em regressão normal linear: princípios e aplicação. Revista Brasileira de Biometria, São Paulo, v.26, n.2, p.7-26, 2008.
LIMA, S.L.; CASALI, A.P.; AGOSTINHO, C.A. Desempenho zootécnico e tabela de alimentação de girinos de rã-touro (Rana catesbeiana) criados no
sistema anfigranja. Revista Brasileira de Zootecnia, Viçosa, v.32, n.3, p.512-518, 2003.
MONELLO, R.J. et al. Growth and behavioral responses of tadpoles of two native frogs to an exotic competitor,
Rana catesbeiana. Journal of Herpetology, Saint Louis,
v.40, n.3, p.403-407, 2006.
RODRIGUES, M.L. et al. Growth curve of bull frog during post-metamorphic stage. Archivos de Zootecnia, Córdoba, v.56, n.214, p.125-136, 2007.
SANTOS, V.B. et al. Evaluation of morphometric growth curves of tilapia of Nilo (Oreochromis niloticus) strains.
Ciência e Agrotecnologia, Lavras, v.31, n.5, p.1486-1492, 2007.
SARMENTO, J.LR. et al. Analysis of the growth curve of Santa Ines sheep. Revista Brasileira de Zootecnia, Viçosa, v.35, p.435-442, 2006.
SECCO, E.M.; STÉFANI, M.V.; VIDOTTI, R.M. Apparent digestibility of different ingredients in diets for bullfrog
Rana catesbeiana tadpoles. Journal of the World
SCHNEIDER, U.A. et al. Impacts of population growth, economic development, and technical change on global food production and consumption.
Agricultural Systems, Oxford, v.104, n.2, p.204-215, 2011.
SEIXAS FILHO, J.T. et al. Alterações histopatológicas em girinos de rã-touro alimentados com rações comerciais de diferentes níveis protéicos. Revista Brasileira de Zootecnia, Viçosa, v.37, n.12, p.2085-2089, 2008.
SILVA, F.L. et al. Growth curves in beef cows of different biological types. Pesquisa Agropecuária Brasileira, Brasília, v.46, n.3, p.262-271, 2011.
SIPAÚBA-TAVARES, L.H. Limnologia aplicada à aquicultura. Jaboticabal: FUNEP, 1994. 70p. SOCKMAN, K.W. et al. Sex-specific effects of yolk-androgens on growth of nestling American kestrels. Behavioral Ecology and Sociobiology, New York, v.62, n.4, p.617-625, 2008.
SOLOMON, R.J.; TARUWA. S.M. The growth comparison of two catfishes (C. Gariepinus and
Heteroclarias). Nature and Science, New York, v.9, n.8,
p.138-148, 2011.
SOUZA, G.S. Introdução aos modelos de regressão linear e não-linear. Brasília: Serviço de Produção de Informação. 1998. 505 p.
STATISTICAL ANALYSES SYSTEM-SAS. Version Release 8.2. for Windows, 2001. CD ROM. VARGAS, G. D. et al. Modelo de simulação do crescimento e desenvolvimento de frangos de corte: descrição e implementação. Ciência Rural, Santa Maria, v.35, n.2, p.440-445, 2005.
WAFA, A.H.; PIERRE, D.; DANIEL, B. Modelling growth and food intake rhythms of brook trout
Salvelinus fontinalis under the effects of density and
ration. Ecological Modelling, Amsterdam, v.175, n.4, p.385-394, 2004.
WILBUR, H.M. Complex life cycles. Annual Review of Ecology and Systematics, Palo Alto, v.11, p.67-93, 1980. WRIGHT, M.L., RICHARDSON, S.E.; BIGOS, J.M. The fat body of bullfrog (Lithobates catesbeianus) tadpoles