Vol.56, n.3: pp. 447-456, May-June 2013
ISSN 1516-8913 Printed in Brazil BRAZILIAN ARCHIVES OF
BIOLOGY AND TECHNOLOGY
A N I N T E R N A T I O N A L J O U R N A L
Spirulina
as a Protein Source in the Nutritional Recovery of
Wistar
Rats
Lidiane Muniz Moreira
1*, Bruna del Sacramento Behling
2, Rosane da Silva Rodrigues
2,
Jorge Alberto Vieira Costa
1and Leonor Almeida de Souza Soares
11Programa de Pós-Graduação em Engenharia e Ciência de Alimentos; Escola de Química e Alimentos;
Universidade Federal do Rio Grande; Rua Engenheiro Alfredo Huch, 475; 96200-970; Rio Grande - RS - Brasil.
2
Centro de Ciências Química; Farmacêutica e de Alimentos; Universidade Federal de Pelotas; Campus Universitário, S/N; 96010-900; Pelotas - RS - Brasil
ABSTRACT
This study was aimed at evaluating the effects of Spirulina (Arthrospira) as a protein source in the nutritional recovery of rats subjected to protein malnutrition. In order to understand such effects, responses of the developing body, serum biochemical profile, and blood count of animals were analyzed. A total of, 23 Wistar Rattus norvegicus were given a proteic diet (AIN-93G adapted) in malnutrition phase (phase I) for 10 days. After this period, the rats were separated into four groups according to the protein source (recovery phase): Control (C), casein 12%; Spirulina level I (S1), Spirulina 8.8% + casein 5.0%; Spirulina level II (S2), Spirulina 17.6% + casein 0.15%, and Spirulina level III (S3), Spirulina 26.4%. Recovery phase (phase II) lasted 30 days. In both the phases, the consumption and body weight of the rats were monitored daily and weekly, respectively. The S1 treatment showed the highest values of Feed Efficiency Ratio (FER) and Quotient of Protein Efficiency Ratio (QPE) (p≤0.05). Significant differences among the treatments were found mainly in the levels of serum lipids, and S2 diet caused an increase in such responses (p≤0.05). These results demonstrated that the nutritional recovery of animals was enabled by different concentrations of Spirulina.
Key words: Protein malnutrition, rats, nutritional recovery, Rattus norvegicus, Spirulina
*Author for correspondence: [email protected]
INTRODUCTION
According to the World Health Organization (WHO), approximately 30% of the world’s population is malnourished and 40,000 children die every day due to malnutrition and related diseases (WHO 2011). In the last two decades, according to figures provided by the Household Budget Survey, the Northeast region of Brazil decreased more than three times the rates of malnutrition with children aged five to nine, yet this problem remains interfering with the
development of these children (Ministry of Health of Brazil 2011).
The metabolism of carbohydrates and proteins also suffer from nutritional deficiency, leading to a reduction of glycogen and protein stores in the muscle and liver. At the same time, higher concentrations of hepatic lipids can be observed due to the difficult transport of fats. The metabolic changes produced by protein insufficiency may be a number of possibilities in the body, from a reduced body weight to a decreased immune system (Quevedo et al. 2002).
According to Alves et al. (2005), authorities within the fields of public health, particularly the WHO, have been concerned with the malnutrition for decades. Technicians of the WHO have discussed the discovery and use of new protein sources as well as rules to use them in the food. In that sense, micro-organisms have been studied as possible sources of protein. Use of cyanobacteria as a source of protein has certain advantages in relation to other microorganisms due to their rapid growth in addition to the quantity and quality of protein (Molina et al. 2002).
Among the microalgae, the genus Spirulina
(Arthrospira) contains about 60-70% of the
proteins, nucleic acids, and amino acids (Pelizer et al. 2003). It also contains beta-carotene and absorbable iron, among other minerals, and high levels of vitamins, phenolic compounds, gamma-linolenic acid, as well as other essential fatty acids (Belay et al. 1993; Von Der Weid et al. 2000; Colla et al. 2008).
The essential amino acids, isoleucine, leucine, lysine, methionine, phenylalanine, threonine, tryptophan and valine were found in the biomass of LEB-18, strain grown at the Federal University of Rio Grande, south of Brazil. Strain LEB-18 generally presented larger amounts of essential amino acids than the theoretical quantities recommended in dietary protein for children aged 2-5 years (FAO 1990), the exception being lysine which accounted for 2.95% of the dry biomass of LEB-18 as against the 5.8% recommended in the dietary protein of children by FAO (Morais et al. 2009).
Currently in Brazil, Spirulina is classified as a new ingredient whose daily intake should not exceed 1.6 g/person (Brazil 2009). The Food and Drug Administration (FDA), after rating this microalga as Generally Recognized as Safe (GRAS), suggested an average daily intake of 3 g/person (FDA 2003). According to Becker (2007), among the factors that limit the use of single cell protein in food there is the presence of cell wall, which
can influence the digestibility and absorption, and also the high content of nucleic acids, whose intake in excess can lead to its accumulation in the human body with potential negative consequences. Therefore, this work aimed to evaluate the effects of using Spirulina in the nutritional recovery of rats subjected to protein malnutrition on the growth and the biochemical and hematological aspects of the blood.
MATERIAL
AND
METHODS
Microalgal biomass
Microalga Spirulina strain LEB-18 was used, produced by the Federal University of Rio Grande, Brazil (Morais et al. 2008).
Biological models
Twenty three male, recently weaned (21 days)
Wistar Rattus norvegicus/UFPel weighing 70 g
were used, which were kindly supplied by the Central Animal Facility of the Federal University of Pelotas, Brazil. The choice of the number of animals (n) per group and the use of randomization were based on Berndtson (1991) and Kilkenny (2009).
Diets
Five diets (Table 1) based on the formulation for growing the rodents (AIN93G) described by Reeves et al. (1993) were prepared weekly: control diet (C): AIN93G adapted to 12% of protein; aproteic diet (A): no added protein; diet S1:
Spirulina 8.8% (w/w); diet S2: Spirulina 17.6%
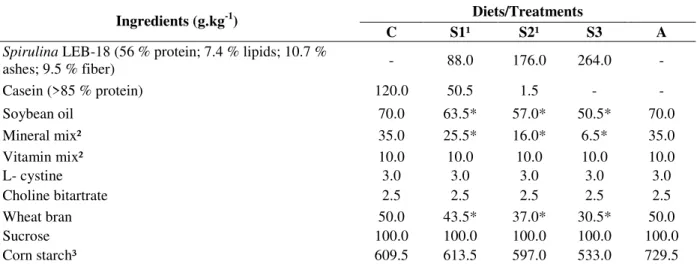
Table 1 - Formulation of diets C (control), S1 (Spirulina 8.8%), S2 (Spirulina 17.6%), S3 (Spirulina 26.4%), and A
(aproteic).
Ingredients (g.kg-1) Diets/Treatments
C S1¹ S2¹ S3 A
Spirulina LEB-18 (56 % protein; 7.4 % lipids; 10.7 %
ashes; 9.5 % fiber) - 88.0 176.0 264.0 -
Casein (>85 % protein) 120.0 50.5 1.5 - -
Soybean oil 70.0 63.5* 57.0* 50.5* 70.0
Mineral mix² 35.0 25.5* 16.0* 6.5* 35.0
Vitamin mix² 10.0 10.0 10.0 10.0 10.0
L- cystine 3.0 3.0 3.0 3.0 3.0
Choline bitartrate 2.5 2.5 2.5 2.5 2.5
Wheat bran 50.0 43.5* 37.0* 30.5* 50.0
Sucrose 100.0 100.0 100.0 100.0 100.0
Corn starch³ 609.5 613.5 597.0 533.0 729.5
¹ To obtain 12% protein, minimum necessary for the development of rodents, the S1 and S2 diets were supplemented with casein; ² Prepared according to AIN-93G (Reeves et al. 1993); ³ Added to supplement the diet; * Deducting the intrinsic amount present in microalgae.
In vivo experiment
The experiment lasted 45 days, with the top five for adaptation to the environment. At the end of the adaptation period, the rats were weighed and Phase I of the experiment (malnutrition) was begun. In this phase, each rat received daily 20 g of aproteic diet (A) and water ad libitum for 10 consecutive days. After this period, the rats were weighed and redistributed at random into four groups (Berndtson 1991; Kilkenny, 2009): C (n = 6), S1 (n = 5), S2 (n = 6), and S3 (n = 6), and Phase II was initiated. In this phase, which comprised 30 days of study, each rat received 20 g of their daily diet with protein for nutritional recovery. Throughout the in vivo experiment, the rats were kept in metabolic stainless steel cages with air exhaust system and 12 h photoperiod at 22 ± 2 °C. The positions of the cages were changed weekly to normalize the impact of the environmental conditions. The implementation of the experiment followed the guidelines of the Brazilian College of Animal Experimentation – COBEA, and was approved by the Ethics Committee of Federal University of Pelotas, Brazil (Case No. 23110. 008077/2009-22).
Weight parameters
During the experiment (phases I and II), daily weighing of the diet remaining at the feeder was performed to determine the food consumption. Likewise, the rats' body weight was registered weekly to assess the weight gain. At the end of the
experiment, the rats were evaluated biometrically by measuring the body weight, vertex-coccyx length, forelimb length, waist circumference, weight, body fat (mesenteric, renal, and inguinal) and liver (Águila et al. 1997).
Analyses of diets and feces
The microalgal biomass, diets and feces of the corresponding groups were analyzed following the methods described by the Association of Official Analytical Chemists (AOAC 1995). Total lipids were determined on biomass and diets by the method of Bligh and Dyer (1959). The factor for the conversion of nitrogen was 6.25 for all the samples. The feces collected were analyzed during the last seven days of the experiment.
Nutricional evaluation
The following determinations were performed to evaluate the protein quality of the diets in the study: Feed Efficiency Ratio (FER), given by the ratio between the weight gain (g) and total dietary intake during the experiment (g), and Quotient of Protein Efficiency Ratio (QPE), calculated as the ratio of weight gain (g) and total protein consumed (g) (Sgarbieri 1996).
Biochemical and blood count analyses
puncture. Approximately 1.0 mL of the blood was placed in eppendorf with EDTA and a portion was analysed for blood count in automatic system (POCH-100IVDIFF, SYSMEX®). The remaining portion of the blood was centrifuged at 1000 g at 4 ° C for 15 mins in test tubes to obtain the serum that was stored at -18 °C for further analysis in automated equipment (LabMax 240,LABTEST DIAGNOSTIC SA®).
Statistical analyses
The analysis of variance (ANOVA) was performed, followed by the Tukey test for
comparison between the means at a significance level of 5% (p ≤ 0.05), using the software Statistica 7.0 (Statsoft, USA).
RESULTS
AND
DISCUSSION
As seen in Table 2, after the period of malnutrition (Phase I), rats from different groups had similar initial weights, showing an even distribution among the four treatments for subsequent protein recovery (Phase II). There was no significant difference in the weights and weight gains.
Table 2 - Weight and nutritional responses of malnourished Wistar rats after recovery for 30 days with
diet C (control), S1 (8.8% Spirulina), S2 (17.6% Spirulina), and S3 (26.4% Spirulina)
Determination Treatments
C S1 S2 S3
Initial weight (g)* 56.00±7.80a 54.40±4.95a 56.33±3.90a 54.65±13.30a
Final weight (g) 189.35±11.50a 200.00±40.65a 165.00±12.25a 188.00±15.45a
Weight gain (g) 118.35±13.30a 130.00±34.35a 97.00±11.20a 117.00±14.10a
Food intake (g) 407.95±46.20a 439.20±66.40a 560.65±16.60ab 626.45±34.30b
Vertex-rump (cm) 19.30±0.90a 19.90±1.15a 19.35±0.60a 20.05±1.15a
Foreleg (cm) 12.35±0.70a 12.30±0.85a 11.65±1.05a 12.50±0.80a
Waist circumference (cm) 13.75±0.70ab 14.90±1.15b 12.50±1.00a 12.60±1.15a
Body fat / weight 0.012±0.005a 0.022±0.013a 0.020±0.007a 0.019±0.008a
Liver / weight 0.035±0.004a 0.035±0.002a 0.030±0.006a 0.033±0.001a
FER 0.18±0.01a 0.25±0.05b 0.15±0.02a 0.17±0.01a
QPE 2.10±0.13a 2.75±0.40b 2.00±0.25a 1.60±0.15c
Mean ± standard deviation; Different letters in the same row indicate significant difference among groups by Tukey test (p≤0.05); *After 5 days of adaptation; FER: Feed Efficiency Ratio; QPE: Quotient of Protein Efficiency Ratio.
In relation to food intake, S3 showed higher values than C group (p≤0.05); however, differed negatively for QPE. Although the consumption was lower in S1 treatment, this differed from the others positively (p≤0.05) for FER and QPE, indicating improved efficiency. According to Chaud et al. (2008), reduced feed efficiency occurred due to a decreased body metabolism after a specific diet, which caused stagnation or reduction in body weight.
Mitchell et al. (1990) treated male Wistar rats for 60 days to evaluate the effect of different concentrations (0, 2.7, 10.7, 18.7 and 26.7%) of
Spirulina maxima with vitamins A and E and
found that the FER was inversely proportional to biomass intake. Rogatto et al. (2004) analyzed a diet with 17% of Spirulina as total replacement of the control diet protein (casein) in young male
Wistar rats for five weeks and FER was found to
be 0.21, a value similar to those in the treatments
with 17.6 % and 26.4% of Spirulina (0.23 and 0.22, respectively) in this study. According to Vieira and Bion (1998), proteins originating from different mixtures and used in different proportions result in variations in the the concentrations of amino acids, which interfere with its efficiency and use by the humans and animals.
length, measured from the forelimbs, and liver weight/body weight).
After five weeks of study with male Wistar rats fed with Spirulina, Rogatto et al. (2004) found average values of vertex-coccyx equal to 24.6 cm. Silva (2009) obtained the measures of the forelimbs around 11.90 cm for the female Wistar rats fed with AIN93G. In order to verify some hepatocellular damage from the diet, the ratio of the liver weight (g)/body weight (g) was determined and values ranged from 0.033 ± 0.003 to 0.034 ± 0.003, which showed no significant difference and were in agreement with other studies (Caballero-Cordoba 1997; Shons et al. 2009; Silva 2009). Overall, the results given in Table 2 showed that a diet with less Spirulina, despite lower consumption, had higher nutritional responses and consequently higher values in the responses related to the development of animals, even if not significant.
Microalgal biomass has high levels of nucleic
acids, which have been reported as about 4-6%. Due to the inability of human body to metabolize uric acid from purine metabolism, an increased consumption of nucleic acids can lead to high levels of uric acid in the serum. This may promote the emergence of diseases such as gout (Becker 1988; Araújo et al. 2003).
Values of uric acid (Table 3) were all within the range of normality, if taken as reference the variation range from 1.2 to 7.5 mg.dL-1 described
as standard for the rats (Mitruka and Rawnsley 1981), similar to the values obtained (1.77 mg.dL -1) in a study with male
Wistar rats by Vilela and Sgarbieri (2000). The fraction of non-protein nitrogen in the serum or blood is composed of all the nitrogenous substances other than proteins. Its main component is urea, which is synthesized in the liver from ammonia derived primarily from the protein and amino acids and is the most used resource for the evaluation of renal function in mammals (Devlin 2007).
Table 3 - Responses of blood biochemical levels of malnourished Wistar rats after recovery for 30 days with diet C
(control), S1 (8.8% Spirulina), S2 (17.6% Spirulina), and S3 (26.4% of Spirulina).
Determination Treatments
C S1 S2 S3
Uric acid (mg.dL-1) 1.55±1.00a 1.90±0.90a 1.30±0.90a 1.40±1.45a
Urea (mg.dL-1) 69.00±10.70a 66.20±23.70a 66.65±14.40a 55.50±8.00a
Creatinine (mg.dL-1) 0.32±0.05abc 0.37±0.04b 0.27±0.04c 0.38±0.06ab
Total proteins (g.dL-1) 6.10±0.15bc 6.60±0.25b 5.85±0.50c 5.85±0.30c
Albumin (g.dL-1) 3.22±0.15a 3.45±0.15a 3.20±0.30a 3.17±0.20a
AST (u.L-1) 33.15±1.35a 32.20±7.50a 47.33±3.40a 32.00±7.95a
ALT (u.L-1) 392.50±27.70a 424.20±24.25a 296.15±20.25a 232.85±11.15a
Glucose (mg.dL-1) 68.00±15.45a 83.20±18.80a 65.85±9.80a 69.00±22.65a
Total cholesterol (mg.dL-1) 80.50±14.65a 74.00±18.45a 103.50±10.50b 86.85±11.95ab
HDL-chol (mg.dL-1) 32.85±3.50a 29.80±6.10a 35.65±4.05a 31.35±3.70a
LDL-chol (mg.dL-1) 29.50±10.70a 30.25±15.60a 51.95±6.70b 40.80±8.35ab
LDL/HDL 0.85±0.23a 0.95±0.35a 1.45±0.25b 1.30±0,15ab
VLDL-chol (mg.dL-1) 17.85±4.60a 13.95±2.60a 16.10±5.30a 14.70±5.30a
Triacylglycerols (mg.dL-1) 89.35±2.30a 69.80±12.75a 80.50±26.50a 73.50±26.55a
Iron (µg.dL-1) 93.33±13.25a 116.40±28.35a 93.15±52.25a 79.85±17.15a
Mean ± standard deviation; Different letters in the same row indicate significant difference among groups by Tukey test (p≤0.05); AST: aspartate aminotransferase; ALT: alanine aminotransaminase.
According to Miller (1993), low levels of urea could indicate severe liver failure, nephrosis, malnutrition, and/or hemodilution, which were not observed in this study. Although the rats belonging to the groups that consumed diets with Spirulina contain urea serum levels lower than the control
since they increase as kidney function decreases (Miller 1993). Table 3 showed that all the treatments with Spirulina had creatinine levels statistically similar to the control; however, when comparing the treatments with Spirulina with each other, S2 showed significantly lower values (p ≤ 0.05). In this study, creatinine levels were between 0.27 and 0.38 mg.dL-1, values considered normal by Mitruka and Rawnsley (1981).
The determination of plasma proteins in serum provides important information about the health conditions and their loss may indicate restriction in the intake of amino acids by eating low-protein diets or food with good protein content, but containing the factors that hinder the digestion and absorption (Campello et al. 2009). The values found for the total plasma proteins were in the range from 6.85 to 6.60 g.dL-1, in which all the treatments with Spirulina were similar to the control, but with some differences among themselves (p≤0.05). Regarding albumin, groups did not differ among themselves. These results were close to those obtained by Quevedo et al. (2002) and Rogatto et al. (2004) in the studies with male rats fed with the diets with Chlorella vulgaris and Spirulina, respectively.
Serum levels of the activities of aspartate aminotransferase (AST) and alanine aminatransaminase (ALT) revealed no values statistically different from the control group. However, all the groups, including the control had AST values higher than reference values from other studies under similar conditions (Caballero-Córdoba 1997; Vilela and Sgarbieri 2000; Anthony et al. 2006; Melo et al. 2008). With respect to the ALT, results were very similar to those of the authors cited previously. According to Devlin (2007), ALT in hepatocytes occurs at concentrations higher than AST; therefore, the determination of its activity in serum is a more effectively diagnosis of liver injury.
The groups did not differ in the levels of blood glucose, with responses between 65.65 and 83.20 mg.dL-1. In a similar study, Alves et al. (2005) evaluated the effect of Spirulina on the skeletal muscle of malnourished rats and values were around 105 mg.dL-1 after 30 days of treatment. Rogatto et al. (2004) found in male Wistar rats fed with Spirulina about 73 mg.dL-1 blood glucose. According to Mitruka and Rawnsley (1981),
Rattus norvegicus that have glucose levels
included in the interval 50 – 135 mg.dL-1 can be considered healthy.
Among the biochemical responses of the blood of the rats analyzed in this study, those related to serum lipids had the most significant difference (p≤0.05) among the treatments. The S2 treatment showed higher values (p≤0.05) than the control for total cholesterol, LDL, and LDL/HDL ratio. The levels of total cholesterol for this treatment were higher than those reported as normal (56 to 76 mg.dL-1) by Souza-Soares et al. (2009) and those obtained by Bertolin et al. (2009). The latter authors, after dealing with male Wistar rats for 60 days with hypercholesterolemic diet and Spirulina, found 99.1 and 65.1 mg.dL-1 for total cholesterol in the rats with 30 days of hypercholesterolemic diet and 30 days of a diet with Spirulina, respectively. As for total cholesterol, the values for LDL were elevated (p≤0.05) in the rats of the S2 treatment. However, this was expected, since this fraction represented about two-thirds of the total cholesterol (Miller 1993). The values of HDL (29.80 to 35.65 mg.dL-1) obtained in this study did not differ among themselves and were similar to those found by Bertolin et al. (2009) for the rats with hypercholesterolemic diet and the diet with
Spirulina (32.3 mg.dL-1).
The LDL/HDL ratio is commonly calculated to assess the risk of coronary heart disease. Ho et al. (2003) reported that high concentration of LDL showed atherogenic processes, whereas high HDL had a cardioprotective effect. In this study, the LDL/HDL ratio were 0.85, 0.95, 1.45, and 1.30 for the groups C, S1, S2, and S3, respectively. Although the relation between LDL and HDL for the rodents has not been determined and the value set for human cannot be compared directly, the convention is that the LDL/HDL ratio is as small as possible (Smith 2007). Therefore, the ratio obtained for the rats fed with diet S2 was increased in relation to C diet (p≤0.05). The values of VLDL and triglycerides did not differ among the treatments. As shown in Table 3, the values for the VLDL fraction were 17.85, 13.25, 16.10, and 14.703 mg.dL-1 for the treatments C, S1, S2, and S3, respectively. The highest levels of VLDL (C and S2) coincided with the values of total cholesterol and triglycerides, yet no significant difference was found. The levels of VLDL are proportional to total cholesterol and triglycerides, as they comprise a fraction of 60% and 20%, respectively.
difference among the four treatments. The mean TAG among the groups was 78.28 mg.dL-1, which was lower than those obtained by Cerqueira et al. (2008) and Bertolin et al. (2009) for the male
Wistar rats. The study groups showed no
significant difference in the iron content. According to the Vivarium of the Faculty of Medicine, Universidade de São Paulo, adult
Wistar rats (Rattus norvegicus) must have high
iron content in the range of 154 to 279 µg.dL-1 (FMUSP 2011). These data were confirmed by Santos et al. (2004), who found a 254 µg.dL-1 of iron in the rats subjected to protein recovery with casein diet for 28 days.
Hematocrit value reflects the total mass of the cells in unit of blood volume, showing crucial importance in the study of all types of anemia. In
addition, their results are less subject to error than the count of red blood cells (Miller 1993). In this study, the treatments did not differ in the levels of hematocrit (Table 4), and the results were similar to other studies (Boaventura et al. 2003; Duarte et al. 2009) and within the range described by Harkness and Wagner (1993) for the rodents, (between 36 and 48%). The groups did not differ with regard to hemoglobin, whose levels were considered normal when compared with other studies. Harkness and Wagner (1993) reported that the mean hemoglobin values for the rats ranged from 11 to 18%. Kappor and Mehta (1993) tested the use of Spirulina in a concentration similar to the S3 treatment (24%) in association with the plant and found increased levels of hemoglobin.
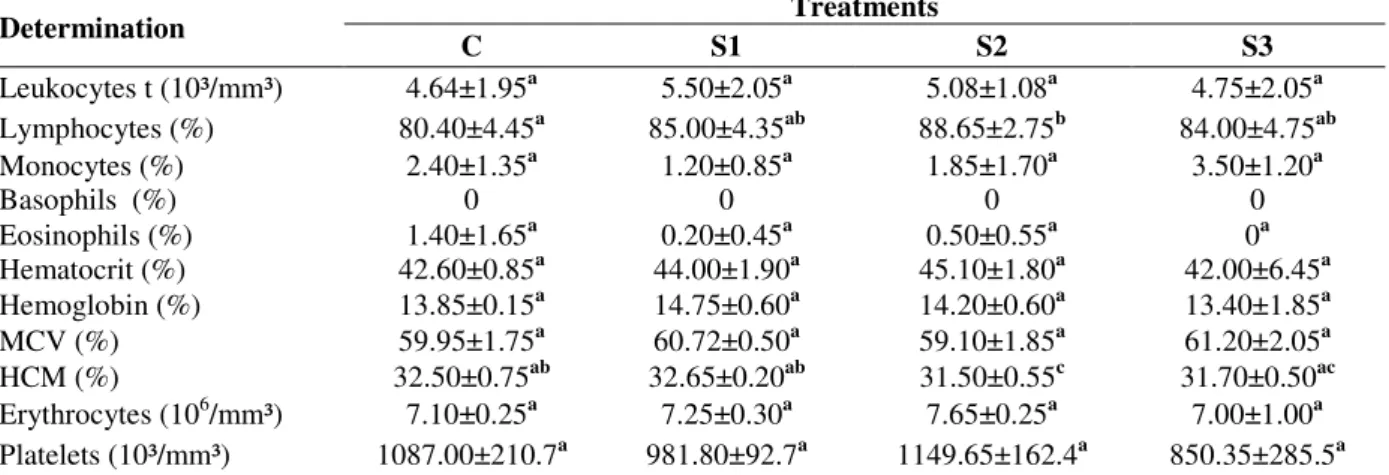
Table 4 - Responses of hematological indices of the blood of malnourished Wistar rats after recovery for 30 days
with diet C (control), S1 (8.8% Spirulina), S2 (17.6% Spirulina), and S3 (26.4% of Spirulina).
Determination Treatments
C S1 S2 S3
Leukocytes t (10³/mm³) 4.64±1.95a 5.50±2.05a 5.08±1.08a 4.75±2.05a
Lymphocytes (%) 80.40±4.45a 85.00±4.35ab 88.65±2.75b 84.00±4.75ab
Monocytes (%) 2.40±1.35a 1.20±0.85a 1.85±1.70a 3.50±1.20a
Basophils (%) 0 0 0 0
Eosinophils (%) 1.40±1.65a 0.20±0.45a 0.50±0.55a 0a
Hematocrit (%) 42.60±0.85a 44.00±1.90a 45.10±1.80a 42.00±6.45a
Hemoglobin (%) 13.85±0.15a 14.75±0.60a 14.20±0.60a 13.40±1.85a
MCV (%) 59.95±1.75a 60.72±0.50a 59.10±1.85a 61.20±2.05a
HCM (%) 32.50±0.75ab 32.65±0.20ab 31.50±0.55c 31.70±0.50ac
Erythrocytes (106/mm³) 7.10±0.25a 7.25±0.30a 7.65±0.25a 7.00±1.00a
Platelets (10³/mm³) 1087.00±210.7a 981.80±92.7a 1149.65±162.4a 850.35±285.5a
Different letters in the same row indicate significant difference among groups by Tukey test (p≤0.05); MCV: mean corpuscular
volume; MCH: mean corpuscular hemoglobin; Normal values of basophils: maximum 1% (Anthony et al. 2006).
The mean corpuscular volume (MCV) and mean corpuscular hemoglobin (HCM) indicate the size of red blood cells and hemoglobin inside red blood cells, respectively. The groups did not differ and the values for MCV were similar to those found for the rats fed with the diets added with S. platensis by Marco (2008). In relation to the levels of HCM, the S2 diet resulted in lower values (p≤0.05) than in groups C and S1. Santos et al. (2004), Marco (2008) and Duarte et al. (2009) found lower values than those of this study. Erythrocytes or red blood cells are formed by the elements present in larger amounts in the blood and its low count indicates iron deficiency and anemic status. For groups C, S1, S2, and S3, there
were values included in the range suggested by Souza-Soares et al. (2009), 7 to 10 million/mm³. Marco (2008) added only 2% of S. platensis to the diets offered to female Wistar rats, and concluded that it was possible to use the microalgae added with multimixtures for the prevention of iron deficiency anemia.
with the blood of the rats. Considering that the platelet counts were automated (CAP) this technique was more precise and accurate than counting of the platelets by microscopy (COM), although according to Van der Meer et al. (2003) and Comar et al. (2009), there would be a potential risk to falsely low or high counts. . Erythrocyte fragments, cytoplasmic fragments of leukemic cells, microcytes with volume close to the cutting limit, bacteria and yeasts can lead to falsely increased values.
The colorless formed elements of the blood of the mammals are known as leukocytes, which play an essential role in the mechanism of defense against the infectious actions (Miller 1993). The treatments did not differ for the total leukocytes; however, the figures were slightly below the lower limit recommended by Souza-Soares et al. (2009), i.e. 6000 to 17000 leukocytes/mm³, and also when compared with the study of Santos et al. (2004), who found 6350 leukocytes/mm³. Of the total white blood, lymphocytes are present at higher levels, accounting for about 50 to 95% (Anthony et al. 2006). Thus, the values fit with as recommended, since the groups C, S1, S2, and S3 had 80.4, 85.0, 88.65, and 84.0%, respectively. The results found in this study for the levels of monocytes showed no significant difference among the groups. According to Souza-Soares et al. (2009), monocytes represent 0-3% of total leukocytes. Santos et al. (2004) and Duarte et al. (2009) assessed white levels of young male Wistar rats, and found values ranging from 1.2 to 2.7%. Basophils play an important role in the body immune responses, since the slightest contact with an allergenic substance release chemical mediators such as histamine, which attracts other immune cells (Miller 1993). Souza-Soares et al. (2009) and Anthony et al. (2006) mentioned as the normal values the range between 0 and 1% of basophils, which were not detected in the animals under study for all the treatments. According to Feldman et al. (2000), the primary function of eosinophils is combating the toxic substances, and therefore, be present in greater quantities in the places where there are antigen-antibody reactions and at points of penetration of strange substances into the body. According to Souza-Soares et al. (2009) and Anthony et al. (2006), eosinophils must be present around 0-3%. The results obtained were within the range considered normal, with no difference among the treatments.
CONCLUSIONS
The results of this study showed that different concentrations of Spirulina strain LEB-18 (8.8, 17.6, and 26.4%) enabled the nutritional recovery
of Wistar rats/UFPel for physiological,
biochemical and hematological characteristics. The diet with 8.8% of Spirulina was the most efficient, with equivalent responses to the control and superior to others.
ACKNOWLEDGEMENTS
This research was supported by project PRÓ-ENGENHARIA of CAPES (Coordination of Improvement of Higher Educational Personnel). The English version of this manuscript was carried out by Rodrigo da Rosa Pereira through the English Language Support to Student Scientific Production at Federal University of – FURG.
REFERENCES
Águila MB, Apfel MIR, Mandarim-de-Lacerda CA. Comparison between morphological and biochemical aged rats fed high-fat diet and canola oil. Braz Arch Cardiol. 1997; 68 (3): 155-161.
Alves CR, Voltarelli FA, Mello MAR. Spirulina as a protein source in the recovery of undernourished rats: effect on skeletal muscle. Rev Dig Lecturas, Educación Física y Deportes [Internet] 2005. [cited 2011 Oct. 19] 10 (86). Available from: http://www.efdeportes.com/efd86/spirulin.htm Anthony JCM, Merriman TN, Heimbach JT. 90-Day
oral (gavage) study in rats with galactooligosaccharides syrup. Food Chem Toxicol.
2006; 44: 819-826.
AOAC (1995), Official methods of analysis. 16. ed. Association of Official Analytical Chemists. Arlington.
Araújo KGL, Facchinetti AD, Santos CP. Influence of intake of biomass of Spirulina (Arthrospira sp.) On body weight and food intake in rats. Cienc Tecnol Alim. 2003; 23 (1): 6-9.
Becker EW. Microalgae for human and animal comsumpition. In Microalgal biotechnology. Cambridge: Cambridge University Press, 1988. p. 222-255.
Becker EW. Micro-algae as a source of protein. Biotech Advan. 2007; 25: 207–210.
Berndtson WE. A simple rapid and reliable method for selecting or assessing the number of replicates for animal experiments. J Anim Sci. 1991; 69:67-76.
Bertolin TE, Pilatti D, Giacomini ACVV, Bavaresco CS, Colla LM, Costa JAV. Effect of microalga Spirulina platensis (Arthrospira platensis) on hippocampus lipoperoxidation and lipid profile in rats with induced hypercholesterolemia. Braz Arch Biol Technol. 2009; 52 (5):1253-1259.
Bligh EG, Dyer WJ. A rapid method of total lipid extraction and purification. Can J Biochem Phys.
1959; 37:911-917.
Boaventura GT, Silva RHL, Tostes LF, Azeredo VB. Weight gain, hemoglobin and hematocrit of rats receiving diet Quissimã, RJ, with or without an alternative food supplement. Rev Nutr. 2003; 16
(3):321-331.
Brasil. Alimentos com Alegações de Propriedades Funcionais e ou de Saúde, Novos Alimentos/Ingredientes, Substâncias Bioativas e Probióticos - Lista dos Novos Ingredientes aprovados pela Agência Nacional de Vigilância Sanitária em maio de 2009 [cited 2011 Oct. 19]. Avaiable from: http://www.anvisa.gov.br/legis/index.htm
Caballero-Córdoba GB. Yeast for brewing: composition, protein value and subchronic toxicity assessment in intact cells, mechanically disrupted cells and protein concentrate [PhD Thesis]. Campinas, Brazil: Federal University of Campinas; 1997.
Campello CC, Carvalho VL, Vieira KM. Performance and serum parameters of rats fed diets containing raw soybean. Braz J Vet Res Anim Sci. 2009; 46
(3):188-198.
Cerqueira PM, Freitas MCJ, Pumar M, Santangelo SB. The pumpkin (Cucurbita maxima, L.) seed flour effect on the rat glucose and lipid metabolism. Rev Nutr. 2008; 21 (2):129-136.
Chaud SG, Sgarbieri VC, Vicente E. Influence of yest (Saccharomyces cerevisiae) cell wall fractions on some nutritional parameters of growing rats. Rev Nutr. 2008; 21 (2):137–147.
Colla ML, Muccilo-Baisch AL, Costa JAV. Spirulina platensis effects on the levels of total colesterol, HDL and triacylglycerols in rabbits fed with a hypercholesterolemic diet. Braz Arch Biol Technol.
2008; 51 (2):405-411.
Comar SR, Danchura HSM, Silva PH. Platelet count: evaluation of manual methodologies and application in the laboratory routine. Rev Bras Hematol Hemoter.
2009; 31 (6):1-6.
Devlin TM. Textbook of biochemistry – with clinical correlations. São Paulo: Edgard Blucher, 2007. p. 1186.
Duarte SMS, Abreu CMP, Menezes HC, Paula FBA, Pereira RGFA, Gouvea CMCP. Peeled coffee brew effect in the antioxidant activity hematological and biochemical parameters in rats. Cienc Tecnol Alim.
2009; 29 (4):703-708.
FAO. UNITED NATIONS ORGANIZATION FOR FOOD AND AGRICULTUR. Protein Quality Evaluation, Report of a joint FAO/WHO Expert Consultation. Rome, 1990.
FDA - Food and Drug Administration. [cited 2011 Oct. 19]. Avaiable from:http://www.fda.gov/Food/ FoodIngredientsPackaging/GenerallyRecognizedasSa feGRAS/GRASListings/ucm153674.htm.
Feldman BF, Zinkl IG, Jain NC. Schalm’s – Veterinary Hematology. Filadélfia: Lippincott Willians and Wilkins, 2000. p. 1344.
FMUSP – Biotery Center School of Medicine, University of Sao Paulo. [cited 2011 Oct. 19]. Avaiable from: http://www.biot.fm.usp.br/site1/ index-2.html.
Harkness JE, Wagner JE. Biology and clinical of rabbits and rodents. São Paulo: Roca, 1993. p. 238. Ho HM, Leung LK, Chan FL, Huang Y, Chen ZY. Soy
leaf lowers the ratio of non-HDL to HDL cholesterol in hamsters. J Sci Food Agri. 2003; 51:4554-4558.
Jood S, Singh, M. Amino acid composition and biological evaluation of the protein quality of high lysine barley genotypes. Plant Foods Hum Nutr.
2001; 56 (2):145-155.
Kappor SJ, Mehta U. Iron Status and growth of rats fed different dietary iron sources. Plant Foods Hum Nutr.
1993; 44 (1):29-34.
Kilkenny C, Parsons N, Kadyszewski E, Festing MFW, Cutrhill IC, Fry D, Hutton J, Altamn DG. Survey of the Quality of Experimental Design, Statistical Analysis and Reporting of Research Using Animals. Survey of Anim Research. 2009; 4 (11):1-11.
Marco PL. Avaliação da biodisponibilidade de nutrientes em multimisturas acrescidas de Spirulina platensis. [PhD Thesis]. Rio Grande, Brazil: Federal University of Rio Grande; 2008.
Melo DS, Corrêa AD, Marcos FCA, Sousa RV, Abreu CMP, Santos CD. Effects of cassava leaves flour on the AST, ALT, ALP enzymes activity and hepatic lipids of Wistar rats. Cienc Tecnol Alimt. 2008;
28:32-37.
Miller DS, Bender AE. The determination of the net protein utilization of proteins by a hortened method.
Br J Nutr. 1955; 9:382–388.
Miller O. Laboratório para o clínico. Rio de Janeiro: Atheneu, 1993. p. 493.
Mitchell GV, Grundel E, Jenkins M, Blakely SR. Effects of graded dietary levels of Spirulina maxima on vitamins A and E in male rats. J Nutr. 1990;
120:1235-1240.
Mitruka MB, Rawnsley HM. Clinical, biochemical and hematological reference values in normal experimental animals and normal humans. New York: Masson Publishing, 1981. p.314.
Molina GE, Belarbi EH, Acién-Fernandez FG. Recovery of microalgal biomass and metabolites: process option and economics. Biotechnol Adv. 2002;
20:491–515.
Morais MG, Reichert CC, Dalcanton F, Durante AJ, Marins LFF, Costa JAV. Isolation and characterization of a new Arthrospira strain. Z. Naturforsch. 2008; 63:144-150.
Morais MG, Radmann EM, Andrade MR, Teixeira GG, Brusch LRF, Costa JAV. Pilot scale semicontinuous production of Spirulina biomass in southern Brazil.
Aquaculture. 2009; 294:60-64.
Ori M, Seguro CA, Rocha AS. Inhibitory effect of serum from rats with acute and chronic renal failure on the phagocytic activity "in vitro". Rev Inst Med.
1990; 32:409-413.
Pelizer LH, Danesi EDG, Rangel CO. Influence of inoculum age and concentration in Spirulina platensis cultivation. J Food Eng. 2003; 56:371–375.
Quevedo HJM, Quintana LB, Manrique CEM, Farnés OC. Aspectos bioquímicos de La recuperación de ratones Balb/C malnutridos com um hidrolizado protéico de Chlorella vulgaris. Rev Cub Alim Nutr.
2002; 16 (1):5-12.
Reeves PG, Nielsen FH, Fahey JR. AIN-93 Purified Diets for Laboratory Rodents: Final Report of the American Institute of Nutrition Ad Hoc Writing Committee on the Reformulation of the AIN-76 Rodent Diet. Rodent Diet. 1993; 123 (6):1939-1951.
Rogatto GP, Oliveira CAM, Santos JW, Machado F, Nakamura FY, Moraes C, Zagatto, et al. Influence of spirulina intake on metabolism of exercised rats. Rev Bras Med Esp. 2004; 10 (4).
Santos HB, Madruga MS, Bion FM. Studies in rat: biochemical and hematological on bioavailability of minerals in diet enriched with “multimixture”. Cienc Tecnol Alim. 2004; 24 (4):613-618.
Sgarbieri VC. Proteínas em alimentos protéicos: propriedades, degradação, modificação. São Paulo, Ed. Varela. 1996. p. 517.
Silva PV. Leite caprino: caracterização físico-química, perfil de ácidos graxos e avaliação biológica (ratos fêmeas Wistar). [PhD Thesis]. Pelotas, Brazil: Federal University of Pelotas; 2009.
Shons PF, Leite AV, Novello D, Bernardi DM, Morato PN, ROCHA LM, et al. Protein efficiency of lentil (Lens culinares) in developmente of Wistar rat. Alim Nutr. 2009; 20 (2):255-260.
Smith J. Drink up and later on goat’s Milk. Better Nutr.
2007; 69 (6): 40-45.
Souza-Soares LA, Machado MRG, Rodrigues RS. Experimentação com animais de laboratório: manual básico. Pelotas, Ed. Universitária – UFPel, 2009. p.468.
Statistica - Statsoft. (Data Analysis Software System), version 7 for Windows, 2004. Avaiable from: www.statsoft.com.2004.
Van der Meer W, Mackenzie MA, Dinnissen JW. Pseudoplatelets: a retrospective study of their incidence and interference with platelet counting. J Clin Pathol. 2003; 56 (10):772-774.
Vieira RL, Bion FM. Biological value of diet based on soybean (Glycine hispid) and mesquite (Prosopis juliflora). Boletim Ceppa. 1998 ; 16(1):85-98.
Vilela, ESD, Sgarbieri VC. Nutritive value of biomass of integral cells, autolisate and extract and yeast cells from beer. Rev Nutr. 2000; 16:127-134.
Von Der Weid D, DillonJC, Falquet J. Malnutrition: a silent massacre. Geneve: Antenna Technology, 2000. WHO – World Health Organization. [cited 2011 Oct.
19]. Avaiable from: http://www.who.int/en