Revista Brasileira de
Engenharia Agrícola e Ambiental
Campina Grande, PB, UAEA/UFCG – http://www.agriambi.com.br
v.20, n.10, p.874-879, 2016
Performance of evaporation estimation methods compared
with standard 20 m
2tank
Manoel C. M. Cabrera
1, Jamil A. A. Anache
2, Cristian Youlton
3& Edson Wendland
2DOI: http://dx.doi.org/10.1590/1807-1929/agriambi.v20n10p874-879
A B S T R A C T
The low reliability of evaporation estimates in reservoirs challenges the management of water resources, especially when drought occurs. The evaporation rates measured in buried
tanks (20 m2 evaporimeters) are close to that of lakes. However, there are few studies in
Brazil using long data sets with this type of tank. In this context, this study aimed to evaluate evaporation estimates of free water surface using the method of Penman (1948) and other
five empirical equations in comparison with data from a 20 m2 tank observed during 10
years. The annual relationship between rainfall and evaporation was 1.0, showing variations in dry years (0.7) and rainy years (1.3). Among all evaluated methods, Linacre (1993) shows the best performance. Camargo et al. (1999) has very good estimates using air temperature as input variable and is a simple and reliable alternative when data are missing.
Desempenho de métodos de estimativa da evaporação
em comparação com tanque padrão de 20 m
2R E S U M O
A baixa confiabilidade da quantificação da evaporação nos reservatórios desafia a gestão de recursos hídricos, principalmente em situações de escassez. A evaporação medida em
tanques enterrados (evaporímetro de 20 m2) se aproxima à de lagos, porém existem poucos
estudos no Brasil utilizando longas séries de dados com este tipo de tanque. Objetivou-se, neste trabalho, avaliar a estimativa de evaporação de superfície livre pelo método de Penman (1948) e outros cinco modelos (empíricos) em comparação com valores observados em
um tanque de 20 m2 durante dez anos. A relação anual entre a precipitação e a evaporação
medida foi igual a 1,0, apresentando variações em anos secos (0,7) e chuvosos (1,3). Dentre os métodos de estimativa avaliados o método de Linacre (1993) apresenta o melhor desempenho enquanto o método de Camargo et al. (1999) apresenta desempenho muito bom e utiliza a temperatura do ar como variável de entrada sendo alternativa eficaz na ausência de dados.
Key words:
water resources evaporimeters free water surface Penman
Palavras-chave:
recursos hídricos evaporímetros
superfície de água livre Penman
1 Universidade Estadual de Santa Cruz/Departamento de Ciências Exatas e Tecnológicas. Ilhéus, BA. E-mail: [email protected] (Corresponding author)
2 Universidade de São Paulo/Escola de Engenharia de São Carlos/Departamento de Hidráulica e Saneamento. São Carlos, SP. E-mail: [email protected];
3 Pontificia Universidad Católica de Valparaíso/Escuela de Agronomía. Quillota, Chile. E-mail: [email protected]
Introduction
Water evaporation under natural conditions (E) is an important component in the hydrological cycle, since it represents approximately 63% of the total rainfall in the continents (Trenberth et al., 2011). Water surfaces significantly contribute to the return of the water to the atmosphere. In the Brazilian semi-arid region, studies quantifying evaporation in reservoirs are common, due to the situations of drought (Pereira et al., 2009; Leão et al., 2013).
In the period from 2012 to 2014, per year, 56 billion m3
of water were not replenished in the Southeast and 49 billion m3 in the Northeast (Getirana, 2015). Details of the drought
in the Southeast region can be seen in Porto et al. (2014) and Coutinho et al. (2015). Studies quantifying evaporation are essential to Brazil. Evaporation is measured using tanks due to their easy handling (Kohler & Parmele, 1967). Evaporation in buried and large-surface tanks is close to that of lakes (Hounam, 1973).
In Brazil, there are six 20 m2 evaporimeters; besides the
tank of this research, two are located in São Paulo, two in Paraíba and one in Pernambuco (Leitão et al., 2007; Oliveira 2009). Studies with long data series using these tanks are rare and serve to assess or calibrate models and smaller evaporimeters (such as the Class A pan).
When there are no data of tanks, models that combine energy and aerodynamic balance, such as that of Penman (1948) and its simplifications, show good results for evaporation from data obtained above lawns in weather stations (Camargo & Sentelhas, 1997; Camargo & Camargo, 2000; Leitão et al., 2007; Oliveira, 2009; Pereira et al., 2009; Leão et al., 2013).
An analysis between the data obtained in the 20 m2 tank
with the method of Penman (1948) and its variations is necessary to identify which formulation is the most adequate in the management of water resources. The aim of this study was to evaluate the performance of the model of Camargo et al. (1999), methods of Penman (1948) and simplifications, compared with a standard tank (20 m2), in the high central
region of São Paulo (Itirapina, SP) in a period of ten years (2003-2014).
Material and Methods
The study was carried out in Itirapina, SP, Brazil, at the Climatological Station of the Center of Water Resources and Applied Ecology (CRHEA) of the School of Engineering of São Carlos – University of São Paulo (22º 01’ 22” S; 43º 57’ 38” W; 733 m). The region has mean temperature and relative air humidity of 21.6 °C and 71%, respectively; the mean annual rainfall between 1979 and 2014 is 1486 mm. The data of evaporation were collected in a buried tank, with diameter of 5 m and depth of 2 m (20 m2).
The water level in the tank was measured with micrometric screw. The daily evaporation in the tank (E20) results from the difference between subsequent readings corrected with the rainfall measured with a Ville de Paris pluviometer. Failures occurred in 16% of the days, due to the overflow of the tank.
Thus, the failures were filled with the mean evaporation of the previous and subsequent days, according to Collischonn & Tucci (2014).
The utilized meteorological data were: air temperature (ta), relative humidity (RH), hours of insolation (n) and wind speed (U2), collected at a height of 1.5 to 2.0 m above the grassed surface (Table 1).
For temperature, the monthly mean was calculated with the daily values; for E20 and rainfall, monthly accumulations were also calculated.
Methods of Penman (1948) and Kohler & Parmele (1967)
Using the relationship between the flux of sensible and latent heat and the evaporating power of the air, Penman (1948) elaborated the method without the need for measurements at two levels above the soil, of temperature and humidity. These measurements at two levels do not exist in weather stations and require high-resolution sensors (Pereira et al., 2013). This method (Kohler & Parmele) is based on the modification of the psychrometric coefficient and of the empirical function of the wind. The method uses an anemometer at height of 4 m; in this study, the anemometer is installed at height of 2 m above the soil, requiring the multiplication by the coefficient 1.15.
Methods of Priestley & Taylor (1972) and Stewart & Rouse (1976)
The method of Penman (1948) comprises two terms, diabatic and adiabatic. Priestley & Taylor (1972) eliminated the adiabatic term (aerodynamic) and corrected the diabatic term with a coefficient, α = 1.26 (Pereira et al., 2013).
Stewart & Rouse (1976) simplified the estimate of the net radiation (Rn) of the model of Priestley & Taylor (1972) with a linear regression from data of global solar irradiance, whose method was tested in Canada, in a shallow lake.
Methods of Linacre (1993) and Camargo et al. (1999)
The utilization of empirical relationships of net radiation and the evaporating power of the air, which showed satisfactory performance in various climates, are the basis of this methodology of Linacre (1993), in which the author substituted the aerodynamic function of the wind by 2.5U2.
Camargo et al. (1999) aimed to simplify the estimation of reference evapotranspiration (ETo) and proposed the effective temperature (Tef = 1.08tmax-0.36tmin); thus, the estimated ETo will be considered as equal to the evaporation. Camargo & Camargo (2000) pointed out that in a humid area the 20 m2 tank with buffer area presents optimal data of ETo.
Results and Discussion
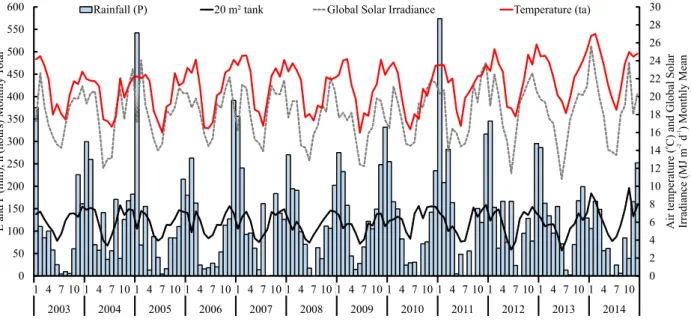
The monthly accumulations of rainfall and evaporation in the 20 m2 tank are shown in Figure 1. The t
a and Rs are also indicated
during the months. The mean annual E20 was equal to 4.0 mm d-1. Allen et al. (1998) cite that, in a humid tropical climate with
mean temperature close to 20 °C, the mean ETo remains between 3 and 5 mm d-1. The equation of Penman-Monteith is considered
as the standard method to estimate ETo (Pereira et al., 2015). Values of ETo become close to E20 as reported by Camargo & Camargo (2000). The monthly means during the entire period (2003-2014) did not exceed these values.
In Figure 1, the lowest E20 rates are observed in June (minimum accumulated value was 57 mm in June/2013)
due to the lower availability of Rs for the net radiation on the liquid surface. Hence, June is the month with the lowest mean of Rs (13 MJ (m² d)-1), which, along with a RH of 72%,
has a mean E20 of 72 mm month-1. The peaks of R
s that occur
in the summer months, November and February, show a monthly mean Rs of 21 MJ (m² d)-1, doubling E
20 to 144 mm
month-1. The highest monthly mean of R
s (26 MJ (m² d) -1) was
observed in January 2014, which showed the second highest accumulated value of E20 (184 mm), due to an anomalous dry spell. The maximum accumulation of E20 was 196 mm in October 2014; this month had Rs (24 MJ (m² d)-1) lower than
that of January/2014, but with lower RH (54%).
0 2 4 6 8 10 12 14 16 18 20 22 24 26 28 30
0 50 100 150 200 250 300 350
400 450 500 550 600
1 4 7 10 1 4 7 10 1 4 7 10 1 4 7 10 1 4 7 10 1 4 7 10 1 4 7 10 1 4 7 10 1 4 7 10 1 4 7 10 1 4 7 10 1 4 7 10
2003 2004 2005 2006 2007 2008 2009 2010 2011 2012 2013 2014
E and P
(mm), n (hours) Monthly
T
otal
Rainfall (P) 20 m² tank Global Solar Irradiance Temperature (ta)
Air temperature ( C) and Global Solar
o
Irradiance (MJ m
d
) Monthly Mean
-2 -1
Mean Rs observed in the months is shown in MJ m-2 d-1. Mean air temperature (ºC) is also indicated
Figure 1. Monthly accumulations, in millimeters, of evaporation (E) in the 20-m2 tank and rainfall (P) and air temperature and global solar irradiance
rainy summer, while the first month of the year had the lowest n (167 h month-1), resulting, in general, in R
s lower
(19 MJ (m² d)-1) than that in December and February. On the
other hand, August exhibits, in general, peaks of insolation with 263 h month-1, and the lowest rates of RH, with 64%,
indicate the dry winter of the region, with mean Rs of 19 MJ (m² d)-1. With the decrease in nebulosity, mean R
s equal
to that of November and for being the third month of the summer, February has the highest ta (24.3 °C).
Each year was divided into two periods, dry and rainy. The rainy period comprehends the months of October to December and January to March. The dry period refers to the months of April to September. The lowest E20 was equal to 1325 mm in 2013 and the highest one to 1613 mm in 2014, a difference of almost 300 mm between both years. The mean E20 was 1446 mm year-1. The mean annual relationship
between rainfall and E20 was equal to 1.0 during the analyzed period. In 2011, due to the excess of rainfall, especially in the months of January, March and December, this relationship increased to 1.3; two years later, with the dry period in the region of São Paulo, in 2014, this relationship reached the lowest value (0.7).
In some months with low rainfall in 2014, the atmospheric demand for water vapor increased, intensifying evaporation,
due to the inexistence of buffer area around the 20 m2 tank.
Thus, the energy balance above the tank is no longer only vertical (Oasis Evaporation), a fact that is not taken into account by the models. Table 2 shows statistical indices for the evaluation of the models.
Figure 2 shows the comparison between E20 and modeled values separated as dry and rainy periods; the index c is also indicated. Figure 3 shows the same comparison for the period
ECM – Camargo et al. (1999); EPN – Penman (1948); ELN – Linacre (1993); ESR – Stewart & Rouse (1976); EKP – Kohler & Parmele (1967); EPT Priestley & Taylor (1972); For the statistics, the
expected values are between parentheses
RMSE - Root mean square error; CRM - coefficient of residual mass; ME - Maximum error; BIAS - Mean difference, NSE - Nash-Sutcliffe efficiency
Statistic Data set ECM EPN ELN ESR EKP EPT
RMSE (0) Dry/Rainy 0.72/0.57 0.39/0.77 0.44/0.43 0.55/1.16 1.42/1.67 0.90/0.55
2003-2014 0.65 0.61 0.44 0.91 1.55 0.74
CRM (0) 2003-2014Dry/Rainy 0.18/0.060.11 0.03/-0.15-0.07 0.06/0.050.06 0.10/-0.23-0.09 -0.40/-0.36-0.38 0.22/0.030.11
ME (0) Dry/Rainy 2.00/1.83 1.78/1.68 1.63/1.02 1.97/2.11 2.22/2.49 2.24/2.30
2003-2014 2.00 1.78 1.63 2.11 2.49 2.30
BIAS (0) 2003-2014Dry/Rainy -0.61/-0.29-0.45 -0.11/0.670.28 -0.22/-0.22-0.22 -0.32/1.050.36 1.37/1.621.49 -0.76/-0.15-0.46
NSE (>0) Dry/Rainy 0.09/0.02 0.75/-1.11 0.67/0.45 0.50/-3.04 -2.61/-7.73 -0.38/0.09
2003-2014 0.46 0.51 0.76 -0.10 -2.17 0.20
Table 2. Statistical indices for the evaluation of the models of open-water evaporation compared with data observed in a 20 m2 tank
Figure 2. Comparison between E20 and evaporation estimated by the models for: (A) dry periods; (B) rainy periods; the index c for each method is indicated
Observed E (mm d )-1
M
ode
le
d
E
(
m
m
d
)
-1
0.0 2.0 4.0 6.0 8.0
ECM EPN ELN ESR EKP EPT
0.
0
2.
0
4.
0
6.
0
8.
0
0.0 2.0 4.0 6.0 8.0
ECM EPN ELN ESR EKP EPT
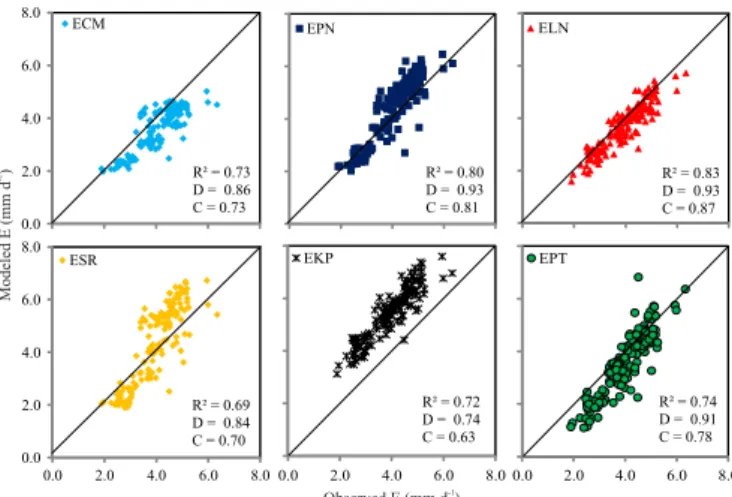
from 2003 to 2014. The evaporation estimation quality of the methods is evaluated by the coefficient of determination (R²) and the accuracy is represented by the coefficient of agreement (D), both presented in Figure 3.
EPN has the best indices for the dry period. The indices CRM and BIAS suggest that, during the dry period, only EKP overestimated, while the other methods underestimated E. EPN and ESR during the dry period exhibit acceptable results; however, in the rainy period, the estimates of these methods showed the lowest C values. In this humid period, EPN and ESR showed high evaporation, above the observed value. EPT shows the best accuracy during the rainy period; ELN has values closer to 1 in the rainy period and in the entire period. Except for ELN and EPT, the other methods showed C coefficient lower than 0.7 during the rainy period.
The methods that exhibited similar behavior under both analyzed conditions (rainy and dry) were: Camargo et al. (1999) and Linacre (1993), with underestimation, and Kohler & Parmele (1967), with overestimation. When the statistical index NSE has negative value, it is advisable not to use the model; instead, the observed mean should be used as estimate (Gupta et al., 2009).
Ultimately, the estimation quality of the methods is evaluated by the coefficient (C) presented in Table 3. The best statistical fit and accuracy are obtained by the methods ELN and EPN. ELN has the best accuracy, demonstrated by the indices RMSE and D.
In Piracicaba, SP, and Jaboticabal, SP, ELN showed good results with the 20 m2 tank with the coefficient C varying
from very good to optimal on the monthly scale (Oliveira, 2009). For Boqueirão, PB, and Patos, PB, it showed very good and good C factor, respectively (Leitão et al., 2007). Pereira et
0.0 2.0 4.0 6.0 8.0
R² = 0.73 D = 0.86 C = 0.73
ECM EPN
R² = 0.80 D = 0.93 C = 0.81
ELN
R² = 0.83 D = 0.93 C = 0.87
0.0 2.0 4.0 6.0 8.0
0.0 2.0 4.0 6.0 8.0 ESR
R² = 0.69 D = 0.84 C = 0.70
0.0 2.0 4.0 6.0 8.0 EKP
R² = 0.72 D = 0.74 C = 0.63
0.0 2.0 4.0 6.0 8.0 EPT
R² = 0.74 D = 0.91 C = 0.78
The coefficients of correlation (R2); agreement (D) and performance (C) are also described
Figure 3. Comparison between E20 and estimates for the entire period of 2003-2014
Table 3. Performance (C) of the analyzed methods of evaporation estimation
Method Performance during
the entire period Method
Performance during the entire period
ECM Very good (0.76 to 0.85) ESR Good (0.66 to 0.75)
EPN Very good (0.76 to 0.85) EKP Medium (0.61 to 0.65)
ELN Optimal (> 0.85) EPT Very good (0.76 to 0.85)
ECM – Camargo et al. (1999); EPN – Penman (1948); ELN – Linacre (1993); ESR – Stewart & Rouse (1976); EKP – Kohler & Parmele (1967); EPT – Priestley & Taylor (1972)
al. (2009) concluded that ELN overestimated the evaporation for the reservoir of Sobradinho in comparison to the measurements in the Class A pan corrected by the coefficient of 0.6. However, in this study, Qg was not estimated with data of insolation, making the accuracy of the model worse.
When Penman (1948) developed the method with lysimetric and evaporimetric data, he did not have a net radiometer; thus, he elaborated an equation that is adopted by FAO 56 and is the basis to estimate net radiation (Rn) of the estimates of EPN, EKP and EPT. Under the conditions of the present study, the evaporation measured in the 20 m2 tank
indicates that the equation used in the models overestimates the value of Rn.
In the simplification made by Priestley & Taylor (1972), the adiabatic term was suppressed and incorporated to the diabatic term through the multiplication by a coefficient α = 1.26; thus, a good estimation of evaporation depends even more on the correct estimation of Rn. Oliveira (2009) concluded that EPT showed results consistent with those of the 20 m2 tank in Piracicaba-SP; however, in this study the
author measured Rn above a lake.
Stewart & Rouse (1976) utilized the approach of Priestley & Taylor (1972) modifying the form of estimating Rn, by using the equation 0.38+0.30Rs, which was developed in temperate climate and does not show good results for the estimation of evaporation in the tropical climate.
The form of determination of net radiation through the method of Kohler & Parmele (1967) produced values underestimated by, on average, 2.38 MJ m-2 d-1 (~1.0 mm)
during the entire period, in comparison to those estimated by the method of Penman (1948). Thus, the estimation of the method showed unsatisfactory performance.
The difference between the height of the anemometer (2.0 m) and the recommendation of the authors (4.0 m) does not influence the estimation of evaporation, due to the correction performed by the logarithmic profile. According to Woodhead (1972), this occurs because the uncertainties in U4 measurements alter in at most 5% the calculated values of evaporation.
Local data, such as the aerodynamic resistance of the surface or the empirical function of the wind expressed as a linear function f(u), are rare. Pereira et al. (2013) point out that these functions must be determined locally to improve the efficiency of the method. Thus, given the various and increasing options found in the literature to estimate net radiation and establish f(u), the model proposed by Linacre (1993) simplifies these choices and does not require specific measurements.
If there are no data of insolation or Rs and UR, the method of Camargo et al. (1999), based only on the effective temperature, has a very good performance and should be used in the estimation of evaporation of the 20 m2 tank. Between
Conclusions
1. The method of Linacre (1993) is recommended to estimate open-water evaporation.
2. In the rainy period, the method of Priestley & Taylor (1972) provides evaporation estimates as good as those of the method of Linacre (1993).
3. The method of Camargo et al. (1999) is a simple alternative for the estimation of evaporation from the 20 m2
tank. The original method of Penman (1948) overestimates it. 4. The mean annual relationship between rainfall and the evaporation observed in the 20 m2 tank is unitary, varying
between 0.7 for a dry year (2014) and 1.3 for a rainy year (2011).
Literature Cited
Allen, R. G.; Pereira, L. S.; Raes, D.; Smith, M. Crop evapotranspiration: Guidelines for computing crop water requirements. Rome: FAO, 1998. 174p. Irrigation and drainage paper 56
Camargo, Â. P. D.; Camargo, M. B. P. D. Uma revisão analítica da evapotranspiração potencial. Bragantia, v.59, p.125-137, 2000. http://dx.doi.org/10.1590/S0006-87052000000200002
Camargo, A. P.; Marin, F. R.; Sentelhas, P. C.; Picini, A. G. Ajuste da equação de Thornthwaite para estimar a evapotranspiração potencial em climas áridos e superúmidos, com base na amplitude térmica diária. Revista Brasileira de Agrometeorologia, v.7, p.252-257, 1999.
Camargo, A. P; Sentelhas, P. C. Avaliação do desempenho de diferentes métodos de estimativas da evapotranspiração potencial no Estado de São Paulo, Brasil. Revista Brasileira de Agrometeorologia, v.5, p.89-97, 1997.
Collischonn, B.; Tucci, C. E. M. Relações regionais entre precipitação e evapotranspiração mensais. Revista Brasileira de Recursos Hídricos, v.19, p.205-214, 2014. http://dx.doi.org/10.21168/ rbrh.v19n3.p205-2014
Coutinho, R. M.; Kraenkel, R. A.; Prado, P. I. Catastrophic regime shift in water reservoirs and São Paulo water supply crisis. PLoS ONE, v.10, p.e0138278, 2015. http://dx.doi.org/10.1371/journal. pone.0138278
Getirana, A. C. V. Extreme water deficit in Brazil detected from space. Journal of Hydrometeorology, v.17, p.591-599, 2015. http://dx.doi.org/10.1175/JHM-D-15-0096.1
Gupta, H. V.; Kling, H.; Yilmaz, K. K.; Martinez, G. F. Decomposition of the mean squared error and NSE performance criteria: Implications for improving hydrological modelling. Journal of Hydrology, v.377, p.80-91, 2009. http://dx.doi.org/10.1016/j. jhydrol.2009.08.003
Hounam, C. E. Comparison between pan and lake evaporation. Geneva: World Meterological Organization, 1973. 52p.
Kohler, M. A.; Parmele, L. H. Generalized estimates of free-water evaporation. Water Resources Research, v.3, p.997-1005, 1967. http://dx.doi.org/10.1029/WR003i004p00997
Leão, R. A. de O.; Soares, A. A.; Teixeira, A. dos S.; Silva, D. D. Estimation of evaporation in the Banabuiú dam, in the state of Ceará, Brazil, by different combined methods, derived from the Penman equation. Engenharia Agrícola, v.33, p.129-144, 2013. http://dx.doi.org/10.1590/S0100-69162013000100014
Leitão, M. de. M. V. B. R.; Oliveira, G. M. de; Leitão, T. J. V. Avaliação do desempenho de diferentes métodos de estimativa da evaporação para duas regiões da Paraíba. Revista Brasileira de Engenharia Agrícola e Ambiental, v.11, p.585-593, 2007. http:// dx.doi.org/10.1590/S1415-43662007000600006
Linacre, E. T. Data-sparse estimation of lake evaporation using a simplified Penman equation. Agricultural and Forest Meteorology, v.64, p.237-256, 1993. http://dx.doi. org/10.1016/0168-1923(93)90031-C
Oliveira, G. X. S. Relações entre medidas de evaporação de superfícies de água livre por evaporímetros e estimativas por métodos meteorológicos em duas regiões do Estado de São Paulo. Piracicaba: ESALQ/USP, 2009. 108p. Tese Doutorado. http://dx.doi.org/10.11606/t.11.2009.tde-04082009-111344 Penman, H. L. Natural evaporation from open water, bare soil and
grass. Proceedings of the Royal Society A, v.193, p.120-145, 1948. http://dx.doi.org/10.1098/rspa.1948.0037
Pereira, A. R.; Villa Nova, N. A.; Sediyama, G. C. Evapotranspiração. Campinas: Fundag, 2013. 318p.
Pereira, L. S.; Allen, R. G.; Smith, M.; Raes, D. Crop evapotranspiration estimation with FAO56: Past and future. Agricultural Water Management, v.147, p.4-20, 2015. http://dx.doi.org/10.1016/j. agwat.2014.07.031
Pereira, S. B.; Pruski, F. F.; Silva, D. D. da; Ramos, M. M. Evaporação líquida no lago de Sobradinho e impactos no escoamento devido à construção do reservatório. Revista Brasileira de Engenharia Agrícola e Ambiental, v.13, p.346-352, 2009. http://dx.doi. org/10.1590/S1415-43662009000300018
Porto, R. L.; Porto, M. F. A.; Palermo, M. A ressurreição do volume morto do Sistema Cantareira na Quaresma. Revista DAE, v.197, p.18-25, 2014. http://dx.doi.org/10.4322/dae.2014.131
Priestley, C. H. B.; Taylor, R. J. On the assessment of surface heat flux and evaporation using large-scale parameters. Monthly Weather Review, v.100, p.81-92, 1972. http://dx.doi.org/10.1175/1520-0493(1972)100%3C0081:OTAOSH%3E2.3.CO;2
Stewart, R. B.; Rouse, W. R. A simple method for determining the evaporation from shallow lakes and ponds. Water Resources Research, v.12, p.623-628, 1976. http://dx.doi.org/10.1029/ WR012i004p00623
Trenberth, K. E.; Fasullo, J. T.; Mackaro, J. Atmospheric moisture transports from ocean to land and global energy flows in reanalyses. Journal of Climate, v.24, p.4907-4924, 2011. http:// dx.doi.org/10.1175/2011JCLI4171.1