David Edward Bignell(1)
(1)School of Biological and Chemical Sciences, Queen Mary, University of London, London, United Kingdom, E1 4NS. E‑mail: [email protected]
Abstract – This paper reviews the methods for the inventory of below-ground biotas in the humid tropics, to document the (hypothesized) loss of soil biodiversity associated with deforestation and agricultural intensification at forest margins. The biotas were grouped into eight categories, each of which corresponded to a major functional group considered important or essential to soil function. An accurate inventory of soil organisms can assist in ecosystem management and help sustain agricultural production. The advantages and disadvantages of transect-based and grid-based sampling methods are discussed, illustrated by published protocols ranging from the original “TSBF transect”, through versions developed for the alternatives to Slash‑and‑Burn Project (ASB) to the final schemes (with variants) adopted by the Conservation and Sustainable Management of Below‑ground Biodiversity Project (CSM‑BGBD). Consideration is given to the place and importance of replication in below-ground biological sampling and it is argued that the new sampling protocols are inclusive, i.e. designed to sample all eight biotic groups in the same field exercise; spatially scaled, i.e. provide biodiversity data at site, locality, landscape and regional levels, and link the data to land use and land cover; and statistically robust, as shown by a partial randomization of plot locations for sampling.
Index terms: agricultural intensification, deforestation, functional groups, sampling replication, sampling schemes, soil biodiversity.
Em direção a um protocolo universal de amostragem de biotas
do solo nos trópicos úmidos
Resumo – Este trabalho faz uma revisão dos métodos de inventariado da biota edáfica nos trópicos úmidos para documentar a (hipotética) perda de biodiversidade do solo associada ao desmatamento e à intensificação agrícola nas margens de florestas. A biota foi agrupada em oito categorias, cada uma correspondente a um grande grupo funcional considerado importante ou essencial para a função do solo. Um inventário cuidadoso dos organismos do solo pode auxiliar a gestão de ecossistemas e a sustentabilidade da produção agrícola. As vantagens e desvantagens de métodos de amostragem baseados em transectos ou em malhas são discutidas e ilustradas por protocolos publicados, desde o original “transeto TSBF”, passando por versões desenvolvidas para o projeto “Alternatives to Slash‑and‑Burn” (ASB), até o esquema final (com suas variantes) adotado pelo projeto “Conservation and Sustainable Management of Below‑ground Biodiversity” (CSM‑BGBD). Considerou‑se a importância de repetição de amostras e argumenta‑se que os novos protocolos de amostragem são: inclusivos, ou seja, desenhados para amostrar os oito grupos bióticos ao mesmo tempo no campo; dimensionados espacialmente, pois fornecem dados de biodiversidade nos níveis de lugar, localidade, paisagem e região e associam esses dados ao uso e cobertura do solo; e estatisticamente robustos, como evidenciado por uma aleatorização parcial das localizações dos lotes de amostragem.
Termos para indexação: intensificação agrícola, desmatamento, grupos funcionais, repetição da amostragem, esquemas de amostragem, biodiversidade do solo.
Introduction
Soil is the habitat of a diverse array of organisms which contribute to the maintenance and productivity
of ecosystems (Brussaard et al., 1997; Lavelle et al., 1997). Large numbers of farmers in the tropics have
limited access to inputs of pesticide and fertilizer, but are
forced to reduce the complexity of their agroecosystems
in an attempt to increase production (agricultural
intensification). This results in obvious and generally
unsustainable disturbances such as deforestation, loss of crop and background biodiversity, pollution, soil erosion, depletion of fertility and, ultimately, global
environmental change (Gillison et al., 2003; Bignell et al., 2005; Moreira et al., 2008).
of below-ground biodiversity that will allow the comparison of inventory results from different tropical
countries and different benchmarks (i.e. experimental sites with fully defined physical and edaphic characteristics) on a valid scientific and statistical basis.
This information and knowledge can then be used to better manage and conserve below-ground biodiversity
(BGBD) in tropical agricultural landscapes, to maintain
agricultural productivity and reduce the further
extension of agriculture into pristine natural habitats.
Here, I summarize sampling and laboratory assessment methods for the biodiversity of a range of key functional groups of soil biota. This is a further elaboration and updating of methods and protocols that were initially assembled and drafted by scientists
affiliated with the Tropical Soil Biology and Fertility Institute of Centro Internacional de Agricultura Tropical (CIAT), the EU‑funded Macrofauna Network, the Natural Environment Research Council (UK)‑funded Terrestrial Initiative in Global Environmental Research (TIGER), and in particular, the United Nations Development Program/Global Environment
Facility-funded Alternatives to Slash-and-Burn Project (ASB). Methods for some functional groups of soil organisms were included in a pioneering handbook of methods by Anderson & Ingram (1993). Methods for the assessment of soil biodiversity are elaborated
further in the ASB Lecture Note 6B edited by Swift &
Bignell (2001), which also introduced the principle of functional groups in the inventory of soil organisms (see also Bignell et al., 2005). Independently, an authoritative manual of techniques for soil organisms and organisms inhabiting freshwater and marine sediments was
published in 1996, edited by G. S. Hall, developed as part of UNESCO’s contribution to the DIVERSITAS
programme. Also, many relevant sampling issues are
discussed in detail in Leather (2005), although the focus of this book is not specifically tropical, and most
recently in Moreira et al. (2008).
Bignell et al. (2005) listed the five principal functions
of soil biota as decomposition of organic matter, nutrient cycling, bioturbation, suppression of soil-borne diseases and pests, and environmental services (for
example: watershed protection, preservation of soil
structure, mitigation of greenhouse gas emissions and bioremediation after pollution events). A functional
group was therefore defined as an assemblage of species, of any taxonomic affiliation and living at
whatever spatial scale, whose collective impact in a soil ecosystem is one of these generic functions, with
the assumption that all five must be manifested in any
soil that has sustainable fertility and structural stability. This sets the agenda for below-ground biodiversity projects focused on land use change and agricultural
intensification, by specifying the groups of organisms
that must be sampled or assessed together, but also
raises the question of what relationship exists between
species diversity, functional diversity (the number of functional groups), functional composition (the nature of functional groups) and the occurrence and intensity of ecological processes. While the functional group concept is, in one sense, a complication in soil biology (as it requires attention to be paid to both microfauna and microorganisms, as well as the more tractable larger animals), in another sense it is a convenience
which circumvents the poor state of taxonomy for some
groups and the lack of agreed or adequate methods for
extracting and enumerating others. A further concern
is the ecological impact of plants that affect soil, including vegetation cover determining soil climate,
root penetration and water infiltration influencing soil structure and root exudates and litter quality mediating
the supply of nutrients to soil organisms.
The global ASB programme, which looked for optimal schemes of tropical forest-based subsistence agriculture that would increase food security and retain
environmental resilience (Kenyatta, 1997; Palm et al.,
2005), addressed the effects of land-use change on soil
biodiversity by designing field sampling to test the following hypotheses: A, agricultural intensification reduces soil biodiversity; B, Reduction in soil
biodiversity compromises ecosystem functions needed
for sustained productivity; C, above‑ground and
below-ground biodiversity are interdependent across scales of resolution from individual plant communities
to the landscape; D, agricultural diversification
promotes soil biodiversity and enhances sustained
productivity; E, sustainable agricultural production at
tropical forest margins is improved by enhancement of soil biodiversity.
These propositions have been at the heart of all tropical soil biological research to alleviate poverty for at least three decades, and will remain so for the foreseeable future, but meanwhile much progress has
been made with the concepts of field sampling schemes,
Where are we now?
An early protocol for assessing soil biota in a concerted way was presented by Anderson & Ingram
(1993). They proposed a system of five to ten standard monoliths, each of 25x25x30 (depth) cm arranged
along a short line in each land use for soil fauna, and, as practiced, this seems to have evolved into a
standard transect of 40x5 m, in which the monoliths
are spaced at intervals ranging between 4 and 8 m.
Other sampling methods for mycorrhizally infected
roots, viable rhizosphere bacteria, viable rhizobia (i.e. root nodules) and soil physics and chemistry were also recommended, but spatial schemes and patterns for the
field were not specified. The monolith is established
by rapid trenching around its perimeter, then dissected from the top downwards in 10 cm slices. The monolith may seem something of a blunt tool, but if properly
executed is effective for up to 13 major taxa of arthropod
and annelid macrofauna, as it minimizes losses by escape. If the dissection is done thoroughly, it is also possible to obtain data on abundance and biomass, although the application of descriptive statistics to the results is problematical (see below). Further, the outer side of the trench is a good place to take soil samples for moisture physics and chemistry, including bulk density, a key consideration for soil animals. The main disadvantage of the monolith is the time required to sort the animals from the soil, which can only be done manually and should be carried out on site, because of the bulk of material and to prevent death of specimens during transportation (although evidence of the latter is anecdotal). For further discussion see Rossi et al. (2006) and Smith et al. (2008).
A more complex scheme was formulated by Swift & Bignell (2001), arising out of the experience of ASB
sampling, which had run over the preceding decade (Figure 1). This also made use of the short transect with
at least five monoliths, but in addition to a duplication
of the transect there are also cores (subsequently bulked) distributed over the transect for nematodes and microsymbionts, inspection of roots for mycorrhizal infection and rhizobial nodulation (with subsequent laboratory analyses), parallel long transects for termite sampling (Jones & Eggleton, 2000) and the alignment of pitfall traps with the long transect to collect more of the soil fauna. This represents very intensive sampling within a single plot, amounting to 290 sampling events per plot and 80 actual samples for analysis after bulking
(Table 1). A plot is a GPS‑referenced point, also known
as a sampling point, where monoliths, cores, pitfall traps and transects are used simultaneously to obtain specimens of soil biota. Typically a plot is positioned
randomly, or from a grid system, within a specified land use or land cover, usually a cultivated field or a natural/semi‑natural reference habitat. Larger fields
could contain more than one plot. At landscape level,
separated examples of a land use of interest could be
sampled with one or more plots each, depending on the scheme of replication employed. With a recommended
replication of three plots per land use, the final figures
to be factored into a gradsect (a sequence of land uses aligned to a single environmental variable, generally
land use intensification or agricultural intensification; see Gillison & Brewer, 1985) would be 870 sampling
events and 240 samples (Table 1). Further bulking can
take place during extraction procedures. The scheme
gives high point-scale resolution for some groups, especially termites, earthworms and nematodes,
all of which are taxonomically tractable, but lower
resolution for microsymbionts, not so much because
of inadequate sampling but because of taxonomic
uncertainties and the requirement for bioassays during
the identification procedure. The resolution achieved
for macrofauna can be shown by construction of species accumulation curves, and is generally good in longer transects, and by the relative ease of assessing the presence or absence of the main functional groups.
Data on abundance and biomass are less reliable
because the number and alignment of monoliths does not adequately accommodate the patchy distributions of many macrofauna, or because bulking removes the
opportunity to determine variance. Overall, the Swift
& Bignell (2001) scheme has high pseudoreplication, and tends towards autocorrelation (Moreira et al.,
2008). Where identification to species is not feasible, functional group or higher taxonomic level can suffice
(Swift & Bignell, 2001). However, for some groups
(for example, macroarthropods such as termites
and myriapods) global species richness is relatively low and some individual species have a high impact
on soil processes (Lavelle et al., 1997). Therefore identification to species level is desirable. With nematodes, identification to genus level is necessary for deriving the Maturity Index (Bongers, 1990),
a parameter which links assemblage structure to
groups of animals and perhaps with microorganisms
other than host‑specific symbionts and pathogens, functional or higher taxonomic group is as informative
as a species list.
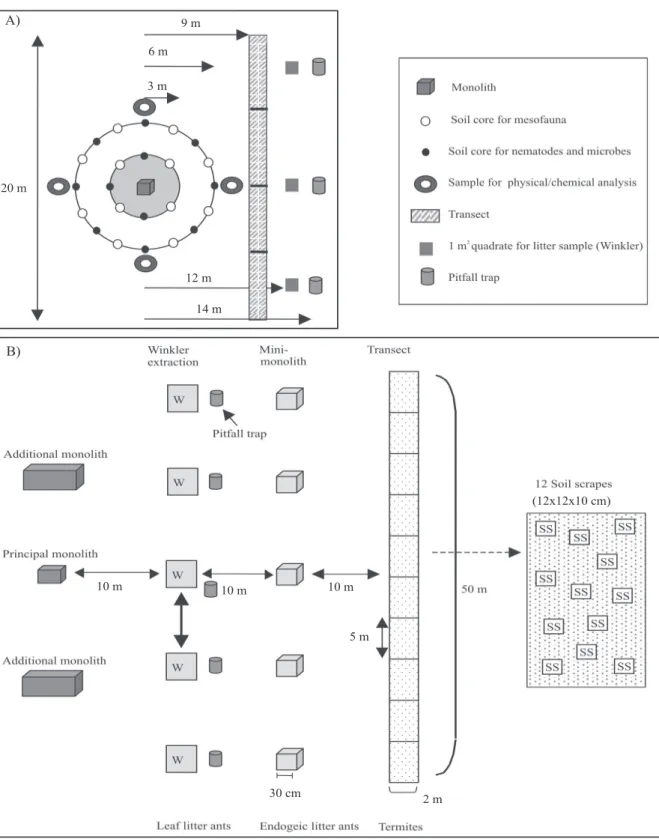
Figure 2 A shows a new sampling scheme put
forward by CSM‑BGBD, a successor project to ASB
(Moreira et al., 2008). The minimum scheme illustrated
retains the main elements specified by Swift & Bignell
(2001) – monolith, core, transect and pitfall trap –, but
the overall extent of sampling at each point is reduced
and the cores are located on concentric circles around
the single monolith, which is the centre point for the
whole sampling array. In other modifications, the
number of pitfall traps is reduced to three, coring for mesofauna (12 cores bulked to four or three samples or one sample) is separated from coring for nematodes, microsymbionts, and fungi (also 12 cores, but bulked to a single sample), the length of the termite transect is reduced to 20 m and four soil samples are taken for physics and chemistry, but away from the monolith. The main addition (compared with ASB) is three quadrats
for sampling litter to be extracted in Winkler bags, the
quadrats aligned with the termite transect and pitfall traps. This amounts to 51 sampling events per plot and 22 actual samples for analysis after selective bulking. With a recommended replication of 20 plots per land
use, the final figures would be 1,020 sampling events
and 440 samples (Table 1). Again, further bulking
can occur during extraction. Additional sampling can take place outside the general scheme: for fruit flies (McPhail traps in trees, and from fruit), other flying
insects (Malaise traps), termites (casual sampling) and earthworms (handsorting in larger monoliths of
50x50 cm, or application of formol in 1x1 m area to
collect larger individuals).
The reduced sampling effort per plot is controversial, largely because the loss of point-scale resolution is large for macrofauna, so an alternative scheme making use of additional monoliths (some larger), more pitfall
traps and an extension of the 20 m transect to 50 m
has also been used (Figure 2 B). This would take the total number of sampling events to 68 and the number of actual samples up to 59 (1,360 sampling events and 1,180 samples per land use). Separate transects for termites, endogeic ants and Winkler material (Figure 2 A) may not be absolutely necessary, as a procedure for sampling termites, ants, earthworms and beetles simultaneously from a single transect has been described by Jones (2003). In general, the more intensive schemes aimed at the whole biota from
macrofauna to bacteria (TSBF; Swift and Bignell; extended CSM‑BGBD) require two complete days of field work per plot, with the digging and sorting of
monoliths, and the long transect for termites (and other macrofauna in recent developments of the method, see Jones, 2003) being the time-consuming elements.
Increasing the number of field assistants is not usually
helpful because of confusion and the danger of trampling damage.
Selection of sampling points (plots)
Modern sampling campaigns designed to test the hypotheses (stated above) concerning biodiversity and agricultural production at tropical forest margins will normally be structured hierarchically. The ultimate aim
is to determine which facets of land use intensification have the strongest influence on below‑ground
biodiversity and can be used for prediction and future management, and to separate these factors from those which are purely climatic, geographical or edaphic in
nature. A benchmark area is first selected (usually in one host country); this should i) represent a recognized
biogeographical region, ii) have indigenous biodiversity richness of global interest and iii) have a gradient of
significant land uses from pristine forest to intensive
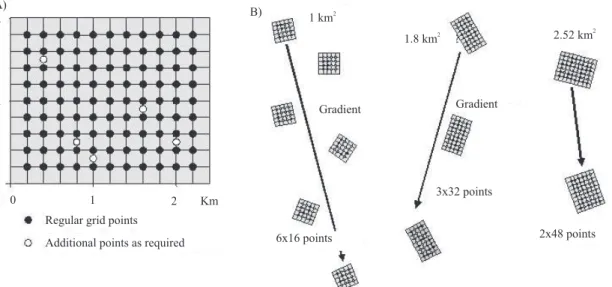
agriculture. The benchmark is then sampled with one or more windows (Figure 3), a window consisting of a grid of 2–5 km2 with about 100 GPS‑referenced
sampling points defined by intersections, or a set of
Table 1. A summary of the sampling options represented by the three schemes presented.
separated smaller grids with the same total of sampling points. Each window aims to include up to 6–7 locally
significant land uses and to sample each with (ideally)
about 20 points (plots) per land use. A specific benefit
of such grid-based schemes is that sampling from a
given land use (providing the land use is well defined)
Figure 2. Minimum point sampling scheme for all biota adopted by CSM‑BGBD (from Huising et al., 2008, with permission
can be distributed over a larger area making use of
replicate plots that are not part of the same field or
other habitat, or in contiguous habitats (Huising et al., 2008). Points can be added or removed to equalize sample sizes between land uses, or to eliminate points that fall on non-targeted land uses or on transitional
zones (unless the latter are of specific interest). Both
these measures assist the derivation of valid population means and the estimation of variance for population parameters, an advance from the ASB schemes, which tended to use a smaller number of plots, each of which was more heavily sampled. Windows can also be arranged along a gradient, such as altitude, distance from the forest margin, or land use intensity.
This converts the sampling exercise into a gradsect and is one example of stratification, i.e. a modification
of sampling procedures which reduces the scope of a study but sharpens its focus. It is not usually practical to sample without a priori hypotheses, i.e. to sample a benchmark entirely at random and then look post hoc
for the variables which best explain the patterns of soil
biodiversity observed. The separation of prospective
sampling points on a grid system is not specified in the CSM‑BGBD protocol, except that the total number of
points used in each benchmark investigated should be about the same. This is deliberate, to allow different
landscape configurations to be accommodated, for
example: a system of small fields might require points to be closer together to sample all the significant land uses; however a useful rule of thumb is that a separation
of at least 200 m is desirable, to reduce autocorrelation, and 100 m is the minimum acceptable. Patchiness of below-ground biodiversity cannot be determined on a scale less than the separation of the sampling points,
but within‑field variations are not priorities for research
in international aid projects aimed at creating food security (Huising et al., 2008).
Grids and transects compared
Theoretical sampling schemes for natural biotas
are described in many textbooks (Cochran, 1977; Ford, 2000; Southwood & Henderson, 2000; Gregoire & Valentine, 2007). The practical priorities are a
rapid low-cost protocol, co-location at point level for sampling all biotic groups and measuring abiotic variables, independent repetition of treatments in order to produce consistent patterns, low variance within treatments to improve detection of differences between
treatments and sufficient sampling points per treatment
to permit a statistical test of hypothesis. Meeting these
requirements is difficult, because of the paucity of
previous data from which to judge the likely magnitude
of variance, the taxonomic intractability of many of
the biotic groups addressed and, not least, the nature of international development projects themselves, where
Figure 3. Examples of configurations of sampling windows. A full grid with additional sampling points
objectives can be ambitious and sometimes not matched by
the resources allocated for actual field work or the expertise available for the identification of specimens. It is rather easier to identify what is not wanted in a sampling scheme:
pseudoreplication (in effect multiple sampling from the
same field), autocorrelation (spatial correlation), unwieldy
datasets containing a large number of zeros (monoliths, cores, traps, transect sections or other subsamples not
containing the targeted groups), ambiguous definitions of land uses (and confusion with land covers), and excessive
within-treatment variability. Fortunately, some basic tools are available to judge the adequacy of sampling, of which
the most useful is the species accumulation curve (Colwell, 1997). Another useful tool is stratification: if some sources of variability can be identified in advance, they can be used to define strata and removed from the analysis, for example, altitude zones. By this definition, one stratum
therefore consists of a set of points, embracing several land uses, which are geographically close. Finally, sampling
cannot be expected to generate a single numerical index of
below-ground biodiversity, nor will it yield every type of organism in the landscape.
Systematic sampling is usually defined as sampling to some predetermined scheme. Grids and transects are the main examples. In the projects mentioned above, sampling
is designed to test the hypothesis that below-ground
biodiversity differs between land uses (e.g. forest x crop field), rather than between different parts of the same land use (e.g. field centers x field margins). This requires that
the sampling should be systematic (in the above sense), because the land uses selected are not independent of one another, although small grids and transects can be randomly positioned (randomly oriented in the case of transects) within each land use, and replicated among different plots
within the same land use. Descriptive statistics based on
a random design can then be used for the data from each land use, but comparisons between land uses are more problematical.
The ASB to CSM‑BGBD transition reflects a debate
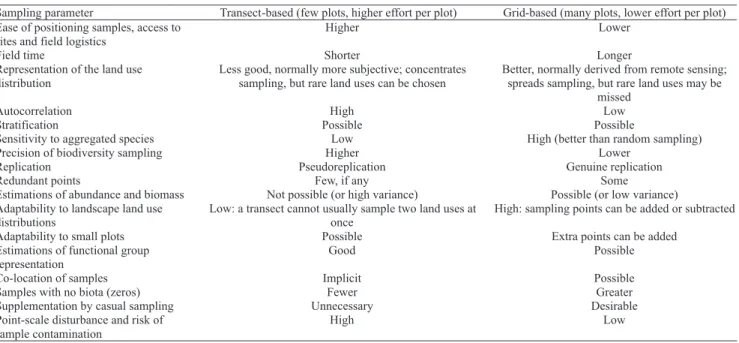
about the advantages and disadvantages of grids and transects, which has not been entirely conclusive. Table 2 summarizes the main features of the two sampling systems. It is predicated on the assumption that the ASB methods are intensive per point sampled (and therefore have high
resolution for actual biodiversity), whereas CSM‑BGBD
methods are less intensive per point but better replicated over the same land uses in any given benchmark. The main
issues are as follows:
i. Representation of land uses. Grid based schemes spread
the sampling more thoroughly through the benchmark. ii. Autocorrelation. It is probable, a priori, that autocorrelation between sampling points will affect
Table 2. Relative merits of grids and transects. In practice, different styles of sampling can be combined, e.g. stratified
the conclusions drawn from any ecological study
(Legendre & Legendre, 1998), but the extent to which
this is a serious impediment in soil biodiversity studies
is unclear. However, referees of submitted scientific
manuscripts can be harsh in judging the issue. Stationarity theory argues that mean and variance for parameters such as species richness, functional group diversity, abundance and biomass will not change overall within a window, such that the level of correlation between point samples is always the same, although individual points will vary in their similarity to each other over time (Huising et al., 2008).
iii. Precision of biodiversity sampling. This is higher for longer transects and transect-aligned monoliths, because it takes better account of the known patchiness of soil animal distribution.
iv. Replication and estimates of abundance and biomass. Transects with few sampling points, for
example 5–8 monoliths, typically generate abundance and biomass means with large variance (Bignell et al., 2000), which then restricts the demonstration of
significant differences in below‑ground biodiversity to treatment extremes only (for example pristine
forest vs Imperata grassland), an effect which can in any case be easily seen by inspection without the
need for extensive sampling. It is currently unclear
whether an increase in the number of sampling points improves resolution, in the sense of reducing the large variances. The greater number of sampling points inherent in the grid-based schemes should improve
statistical resolution between treatments, but firm experimental evidence of this is lacking. Huising
et al. (2008) recommend 100–120 sampling points per benchmark, with a typical benchmark containing up to
six land uses of interest. However, some information can be extracted from the relatively low‑replication
data generated in transect-based studies by the use of multivariate analysis (Eggleton et al., 2002) or by the relative balances between different functional groups (Jones et al., 2003). The use of transects permits some quantitative (or semi-quantitative) data to be gathered,
but does not exclude qualitative analysis, as is (for example) traditional with ants.
Conclusions
1. Modern multi‑taxon sampling schemes for
below-ground biotas employ combinations of monoliths, cores, pitfall traps and transects.
2. This mixture provides for co‑location of
sampling for macrofauna, mesofauna, microfauna, microsymbionts and other microbiota, and a higher resolution of below-ground biodiversity than can be achieved by point-scale or transect-based schemes alone.
3. Where logistics permit, selection of sampling points should be grid-based, on the assumption that this provides the best representation and replications of land uses, and the most robust statistical descriptions of data, i.e. lower variances and higher resolution between treatments.
References
ANDERSON, J.M.; INGRAM, J.S.I. (Ed.). Tropical soil biology
and fertility: a handbook of methods. 2nd ed. Wallingford: CAB
International, 1993. 221p.
BIGNELL, D.E.; TONDOH, J.; DIBOG, L.; HUANG, S.P.; MOREIRA, F.; NWAGA, D.; PASHANASI, B.; PEREIRA, E.G.; SUSILO, F.X.; SWIFT, M.J. Below‑ground biodiversity assessment - developing a key functional group approach in best‑bet alternatives to slash and burn. In: PALM, C.A.; VOSTI, S.A.; SANCHEZ, P.A.; ERICKSEN, P.J. (Ed.). Slash‑and‑burn
agriculture: the search for alternatives. New York: Columbia
University Press, 2005. p.119‑142.
BIGNELL, D.E.; WIDODO, E.; SUSILO, F.X.; SURYO, H. Soil macrofauna: ground‑dwelling ants, termites, other macroarthropods and earthworms. In: GILLISON, A.N. (Ed.). Alternatives to
slash‑and‑burn: above‑ground biodiversity assessment working
group: summary report 1996‑99: impact of different land uses on biodiversity. Nairob: International Centre for Research in Agroforestry, 2000. p.91-127.
BONGERS, T. The maturity index: an ecological measure of environmental disturbance based on nematode species composition.
Oecologia, v.83, p.14-19, 1990.
BRUSSAARD, L.; BEHAN‑PELLETIER, V.M.; BIGNELL, D.E.; BROWN, V.K.; DIDDEN, W.; FOLGARAIT, P.; FRAGOSO, C.; FRECKMAN, D.W.; GUPTA, V.V.S.R.; HATTORI, T.; HAWKSWORTH, D.L.; KLOPATEK, C.; LAVELLE, P.; MALLOCH, D.W.; RUSEK, J.; SODERSTROM, B.; TIEDJE, J.M.; VIRGINIA, R.A. Biodiversity and ecosystem functioning in soil. Ambio, v.26, p.563-570, 1997.
COCHRAN, W.G. Sampling techniques. 3rd ed. New York: Wiley,
1977. 428p.
COLWELL, R.K. Estimates: statistical estimation of species
richness and shared species from samples. Version 5. 1997. Available at: <http://viceroy.eeb.uconn.edu/estimates>. Acessed on: 29 June 2009.
FORD, E.D. Scientific method for ecological research. Cambridge: Cambridge University Press, 2000. 564p.
GILLISON, A.N.; BREWER, K.R.W. The use of gradient directed transects or gradsects in natural resource surveys. Journal of
Environmental Management, v.20,p.103-127, 1985.
GILLISON, A.N.; JONES, D.T.; SUSILO, F.X.; BIGNELL, D.E. Vegetation indicates diversity of soil macroinvertebrates: a case study with termites along a land‑use intensification gradient in lowland Sumatra. Organisms, Diversity and Evolution, v.3, p.111‑126, 2003. GREGOIRE, T.G.; VALENTINE, H.T. Sampling strategies for
natural resources and the environment. London: Chapman and
Hall, 2007. 496p.
HUISING, E.J.; COE, R.; CARES, J.; LOUZADA, J.; ZANETTI, R.; MOREIRA, F.M.S.; SUSILO, F.X.; KONATE, S.; VAN NOORDWIJK, M.; HUANG, S.H. Sampling strategy and design to evaluate below‑ground biodiversity. In: MOREIRA, F.M.S.; HUISING, E.J.; BIGNELL, D.E. (Ed.). A handbook of tropical soil
biology: sampling and characterization of below‑ground biodiversity.
London: Earthscan, 2008. p.17‑42.
JONES, D.T. Tools for the rapid assessment of soil invertebrate biodiversity in the ASEAN Region. In: TOOLS FOR MONITORING SOIL BIODIVERSITY IN THE ASEAN REGION, 1., 2003.
Proceedings. Kota Kinabalu: Universiti Malaysia Sabah, 2003.
p.1-39.
JONES, D.T.; EGGLETON, P. Sampling termite species assemblages in tropical forests: testing a rapid biodiversity assessment protocol.
Journal of Applied Ecology, v.37, p.191-203, 2000.
JONES, D.T.; SUSILO, F.X.; BIGNELL, D.E.; SURYO, H.; GILLISON, A.N.; EGGLETON, P. Termite assemblage collapse along a land‑use intensification gradient in lowland central Sumatra, Indonesia.Journal of Applied Ecology,v.40, p.380-391, 2003. KENYATTA, K. (Ed.) Alternatives to slash‑and‑burn. REPORT OF THE ANNUAL REVIEW MEETING, 6., 1997. Proceedings. Nairobi: International Centre for Research in Agroforestry, 1997.
LAVELLE, P.; BIGNELL, D.; LEPAGE. M.; WOLTERS, V.; ROGER, P.; INESON, P.; HEAL, O.W.; DHILLION, S. Soil function in a changing world: the role of invertebrate ecosystem engineers. European Journal of Soil Biology, v.33, p.159-193, 1997.
LEATHER, S.R. (Ed.) Insect sampling in forest ecosystems. Oxford: Blackwell, 2005. 303p.
LEGENDRE, P.; LEGENDRE, L. Numerical ecology. 2nd ed.
Amsterdam: Elsevier, 1998. 853p.
MOREIRA, F.M.S.; HUISING, E.J.; BIGNELL, D.E. (Ed.).
A handbook of tropical soil biology: sampling and characterization
of below‑ground biodiversity. London: Earthscan, 2008. 212p. PALM, C.A.; VOSTI, S.A.; SANCHEZ, P.A.; ERICKSEN, P.J. (Ed.). Slash‑and‑burn agriculture: the search for alternatives.
New York: Columbia University, 2005. 463p.
ROSSI, J.P.; MATHIEU, J.; COOPER, M.; GRIMALDI, M. Soil macrofaunal biodiversity in Amazonian pastures: matching sampling with patterns. Soil Biology and Biochemistry, v.38, p.2178-2187, 2006.
SMITH, J.; POTTS, S.; EGGLETON, P. Evaluating the efficiency of sampling methods in assessing soil macrofauna communities in arable systems. European Journal of Soil Biology, v.44, p.271-276, 2008.
SOUTHWOOD, T.R.E.; HENDERSON, P.A. Ecological methods. 3rd ed. Oxford: Blackwell Science, 2000. 575p.
SWIFT, M.J.; BIGNELL, D.E. Standard methods for the assessment
of soil biodiversity and land‑use practice. Bogor: International
Centre for Research in Agroforestry: Southeast Asian Regional Research Programme, 2001. (ASB‑Lecture Note 6B). Available at: <http://www.asb.cgiar.org/publications/ASB%20Lecture%20Notes/ default.asp>. Acessed on: 09 July 2009.