Phosphorus Accumulation and Sorption in
Calcareous Soil under Long-Term Fertilization
Rui Wang1, Shengli Guo1,2*, Nana Li2, Rujian Li2, Yanjun Zhang2, Jishao Jiang3, Zhiqi Wang2, Qingfang Liu1, Defeng Wu1, Qiqi Sun3, Lanlan Du2, Man Zhao1
1College of Resources and Environment, Northwest A&F University, Yangling 712100, Shaanxi, China, 2Institute of Soil and Water Conservation, Northwest A&F University, Yangling 712100, Shaanxi, China, 3Institute of Soil and Water Conservation, Chinese Academy of Sciences and Ministry of Water Resource, Yangling 712100, Shaanxi, China
Abstract
Application of phosphorus (P) fertilizers to P-deficient soils can also result in P accumula-tion. In this study, soil P status and P uptake by apple trees were investigated in 5-, 10-, and 15-year-old orchards in the semi-arid Loess Plateau, China, and subset soils with different soil P statuses (14–90 Olsen-P mg kg−1) were selected to evaluate the characteristic P adsorption. Due to the low P-use efficiency (4–6%), total soil P increased from 540 mg kg−1 to 904 mg kg−1, Olsen-P ranged from 3.4 mg kg−1to 30.7 mg kg−1, and CaCl
2-P increased from less than 0.1 mg kg−1to 0.66 mg kg−1under continuous P fertilization. The P sorption isotherms for each apple orchard were found to fit the Langmuir isotherm model (R2= 0.91–
0.98).K(binding energy) andQm(P sorption maximum) decreased, whereas DPS (degree
of phosphorus sorption) increased with increasing P concentration. CaCl2-P increased sig-nificantly with the increase of Olsen-P, especially above the change point of 46.1 mg kg−1. Application of surplus P could result in P enrichment in P-deficient soil which has high P fixa-tion capacity, thus posing a significant environmental risk.
Introduction
The increasing application of phosphorus (P) fertilizers in recent years has significantly improved soil P status in most regions of the world [1–7]. Intensive agricultural activity has greatly changed P flows globally [8], causing P accumulation in the soil [9]. For instance, the cumulative inputs of P fertilizer and manure for the period 1965–2007 in Europe far exceeded the cumulative P uptake by crops (1,115 kg ha−1vs. 360 kg ha−1of cropland) [10]. Although fertilizers play a key role in improving the crop productivity, application of P fertilizers in excess of crop requirements is of environmental concern due to the loss of potentially harmful nutrients to the environment [5]. Continuous addition of P to soil may increase the potential risk for P release and loss because of its finite P holding capacity, even in the case that has extremely high P fixation capacity and low P losses in this type of soil.
OPEN ACCESS
Citation:Wang R, Guo S, Li N, Li R, Zhang Y, Jiang J, et al. (2015) Phosphorus Accumulation and Sorption in Calcareous Soil under Long-Term Fertilization. PLoS ONE 10(8): e0135160. doi:10.1371/journal.pone.0135160
Editor:Maoteng Li, Huazhong University of Science and Technology, CHINA
Received:March 31, 2015
Accepted:July 18, 2015
Published:August 19, 2015
Copyright:© 2015 Wang et al. This is an open access article distributed under the terms of the
Creative Commons Attribution License, which permits unrestricted use, distribution, and reproduction in any medium, provided the original author and source are credited.
Data Availability Statement:All relevant data are within the paper and its Supporting Information files.
Funding:This work is supported by the "Strategic Priority Research Program—Climate Change:
Carbon Budget and Related Issues" of the Chinese Academy of Sciences (Grant No. XDA05050504), and the Non-profit Research Foundation for Agriculture (No. 201203039).
Long-term application of surplus P fertilizer may contribute to P enrichment in soil [11,12], decrease P sorption and increase P availability and translocation even in soils with high P sorp-tion capacity [6,13,14], thus posing a significant environmental risk. Phosphorus input above the critical limit (change-point) may have high potential for P losses [1,15–17]. The P sorption capacity of soils which accepted P applications for 25 years was generally lower than that of unfertilized soils [18]. Similarly, the P sorption maximum (Qm) and binding energy (K) were consistently smaller with P applied to soils [1], while soil P saturation (DPS) increased [19]. Phosphorus sorption index (PSI) values were lower after high rates of P application [6,20], Mehlich-3 and M3P/PSI increased curvilinearly or linearly with P accumulation [13]. This
accumulation can lead to an increase in P leaching into subsurface soil layers [21] and in P transported into surface waters via runoff, thus resulting in accelerated eutrophication of sur-face waters. Although calcareous soils are common throughout the world, and characterized by high pH and P fixation capacity, continuous P application may increase the potential risk of P losses. It has been shown that unexpected incidental P losses from volcanic soils, which were similar to calcareous soils, threatened water quality in Southern Chile, and such soils were gen-erally thought of as P sinks with high P fixation capacity [6]. Thus, a better understanding of P accumulation and adsorption in calcareous soils after long-term P application is helpful for adjusting fertilization for high crop production and environmental safety.
The objectives of this study are to investigate (i) changes in soil total P (TSP), Olsen-P, and CaCl2-P in 5-, 10-, and 15-year-old apple orchards in the semi-arid Loess Plateau, China after
long-term application of surplus P fertilizers; (ii) changes inK,Qm, and DPS; and (iii) the rela-tionship betweenK,Qm, DPS, Olsen-P and CaCl2-P.
Materials and Methods
Site description
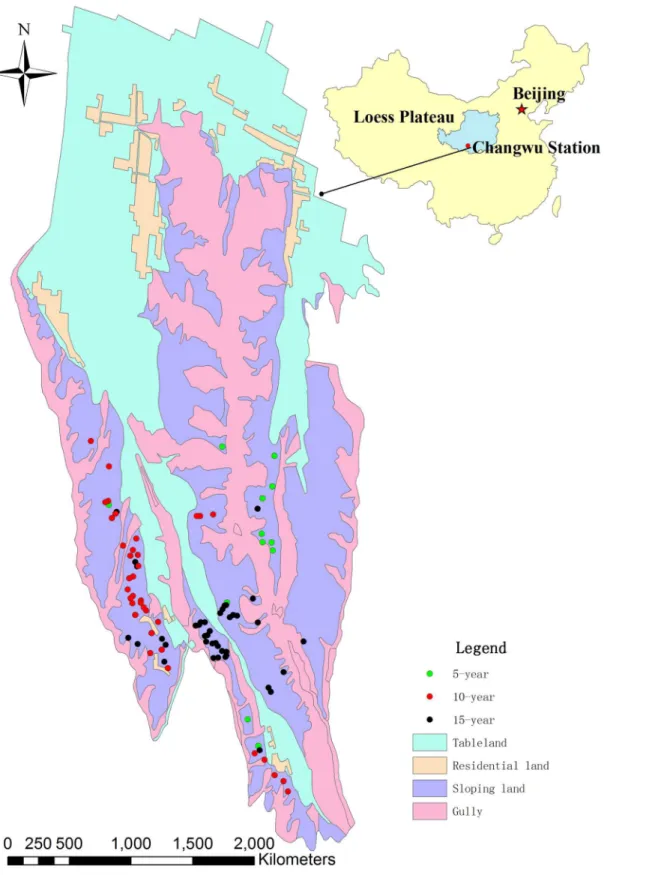
This study was conducted in a hilly-gully region of Loess Plateau in Wangdonggou watershed, Changwu, Shaanxi, China, (35°12'16''−35°16'00'' N, 107°40'30''−107°42'30'' E, 1220 m above
sea level) (Fig 1). Changwu State Key Agro-Ecological Experimental Station, Chinese Academy of Sciences issued the permission for our experimental sites. The soil erosion modulus is larger than 50 t ha−1. Apple orchards have been established in slopeland since 1970s to reduce soil erosion and increase farmer’s income, and now this region has become a typical apple growing region in Loess Plateau.
This region has a semi-arid climate with an average annual temperature of 9.1°C and precip-itation of 584 mm (over a recent 30-year period), 55% of which occurs between June and Sep-tember. Annual sunshine hour is 2230 h, annual solar radiation is 5266 MJ m−2, and frost-free period is 194 d. The soil is, derived from wind-deposited loess and, belongs to the Loessal soil group according to the Food and Agriculture Organization and United Nations Education Sci-entific and Cultural Organization (FAOUNESCO) soil classification system. Soils collected at the study site in 2004 at a depth of 0–20 cm were characterized by: pH 8.4, 24% clay (<0.002 mm), water-holding capacity 0.29 cm3cm–3, organic carbon 6.5 g kg−1, total nitrogen 0.8 g kg−1, total soil P 640 mg kg−1, NH4OAc-extractable K 200 mg kg−1, CaCO3105 g kg−1, and
bulk density 1.3 g cm–3, cation exchange capacity (CEC), clay content (<0.002 mm) 16%, silt content (0.05–0.002 mm) 73%. The groundwater table is 80 m below surface.
Ethics Statement
Fig 1. Schematic diagram of sampling points in Wangdonggou watershed.
Basic information of the apple orchards
Apple tree (Malus domesticaBorkh) is the most widely cultivated cash crop in Loess Plateau due to its high economic and ecological benefit. Its planting area has increased by 20 times in the past 30 years and now it is estimated to be over 15 million hectare. It is known that the mas-sive amount of inorganic P fertilizer added to soils which has extremely high P fixation capacity remains unavailable for crop uptake. Thus, P deficiency may constitute an important factor contributing to the low crop productivity in Loess Plateau. There is an increasing popularity in the application of P fertilizer since the implementation of land contract responsibility system in China in 1980s. As a result, surplus fertilization is common in some regions. The annual fer-tilizer inputs reach 750 kg hm−2(P2O5) or more, soil total P reaches 1400 mg kg−1, and Olsen P
is more than 100 mg kg−1in some orchards. In this study, 106 apple orchards at the small watershed were selected for soil sampling in September 2004, including 12 5-year-old orchards, 51 10-year-old orchards, and 43 15-year-old orchards (Fig 1). These apple orchards are gener-ally less than 0.3 ha and managed by farm households.
Sampling Methods
Soil sampling. Soil sample was collected from each orchard, and each sample consisted of six subsamples collected at a distance of 1 m from stem at top soil (0–20 cm) by a soil auger (d= 4 cm). The reference soils were collected in the grassland which was 1 km away from the apple orchards and received no fertilizer. In addition, soil samples to a depth of 200 cm in 20 cm increments were collected from 12 soil profiles, and there were 3 randomly selected replica-tions for the 5-, 10-, 15-year-old orchards and grassland.
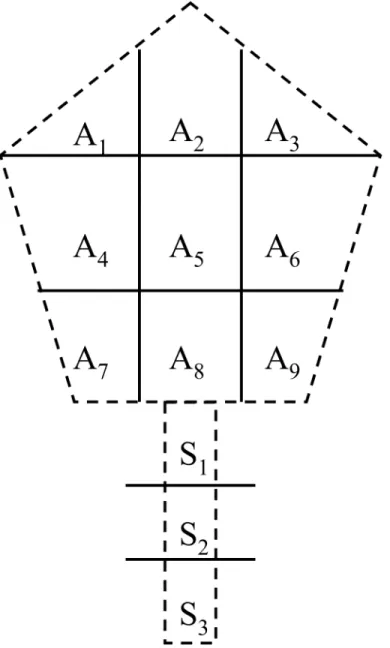
Plant sampling. Three typical orchards with different ages were selected, and three trees were selected in each orchard at the end of September in 2004 for the measurement of above-ground biomass and nutrient content. For purpose of analysis, the trees were divided into four parts: stem, branches (including central and lateral branches), leaves and fruits. In order to esti-mate P concentration in different organs, the random with stratified technique sampling was used to select sub-samples. The sample trees were divided into nine units, three different height (upper, middle and lower) at different aspect (inside, middle, and outside), as theFig 2shows, sub-samples of central branch, three lateral branches, fruit and leaves which grew well and had no diseases or insect pests was selected by random technique in each unit (A1to A9), and
sub-samples of stem were composed of S1to S3, also by random technique in each unit (Fig 2).
Fresh plants were weighted in the field, and sub-samples were washed and oven-dried in labo-ratory at 80°C for 48 h. Total aboveground biomass was calculated by fresh and dry plant weights, and P uptake for each part was measured by oven-dried samples.
Sample analysis. Soil samples were air-dried, sieved to<2 mm, and digested with HClO4-H2SO4. TSP in bicarbonate and hydroxide extracts were determined by perchloric acid
digestion [22]. Available P (Olsen-P) was extracted by NaHCO3at pH = 8.5 [23].
Water-solu-ble P (WSP) was determined by suspending 1 g of soil in 50 ml of salt solution (0.01 mol L−1 CaCl2), shaking overhead for 2 h and filtration through a 0.45μm filter [24,25]. P in the
neu-tralized extracts and digests was determined by the molybdenum-blue method [24].
The sorption isotherms of P were constructed following the procedures of Nair et al. [26]. Phosphate sorption curves were obtained by shaking 1.0 g of air-dried soil samples in 25 ml of equilibration KH2PO4solution containing 0, 5, 10, 30, 50 and 80μg P ml−1in a 50-ml plastic
calculated according to follow Langmuir sorption equation:
Q¼KQm=ð1þKCÞ ð1Þ
where C is the equilibrium concentration of P,Qis the amount of P adsorbed,Kis a constant related to the bonding energy, andQmis the P sorption maxima [27].
We then calculated the degree of DPS for the 7 subset soils:
DPSð%Þ ¼ ððOlsen PÞ=QmÞ 100 ð2Þ
whereQmis the P sorption maxima that can be estimated from the linearized Langmuir equa-tion based on the experimental data from P sorpequa-tion isotherms conducted with 7 soils [28].
Fig 2. Diagrammatic of the selecting method about sub-samples of apple tree.
Plant samples were ground to<2 mm and digested in H2SO4, and four 1.5 ml aliquots of
30% hydrogen peroxide (H2O2) were added during the digestion. Total P was measured
calori-metrically by the vanado-molybdate method.
Calculation of P balance. Phosphorus surplus was defined as the difference between P input and output, which represented P stored in soil, and soil P balance was calculated by the following equation [29]:
P surplus¼P input P outputðP removed by aboveground parts of plantÞ ð3Þ
Phosphorus input was mainly from fertilizers, which was equal to the amount of fertilizer applied multiplied by its concentration. The main fertilizers used in these apple orchards included superphosphate, diammonium phosphate and compound fertilizers. Data were obtained from the farmers of the orchards.
Statistical analysis
Data were processed primarily using the Microsoft Excel spreadsheets. Significance of P bal-ance and soil P accumulation among orchards was tested by the analysis of varibal-ance, and the difference was tested by the Least Significant Difference (LSD) using SAS software package. A
pvalue less than 0.05 was considered significant. Figures were constructed by SigmPlot 10. The relationship between Olsen-P and CaCl2-P was evaluated using the two-segment linear model
[17]:
y¼a1xþb1;xT ð4Þ
y¼a2xþb2;x>T ð5Þ
where a1, a2, b1and b2are the parameters of these equations, and T is the critical level for
CaCl2-P.
Results
Phosphorus inputs and accumulation under long-term phosphate
fertilization
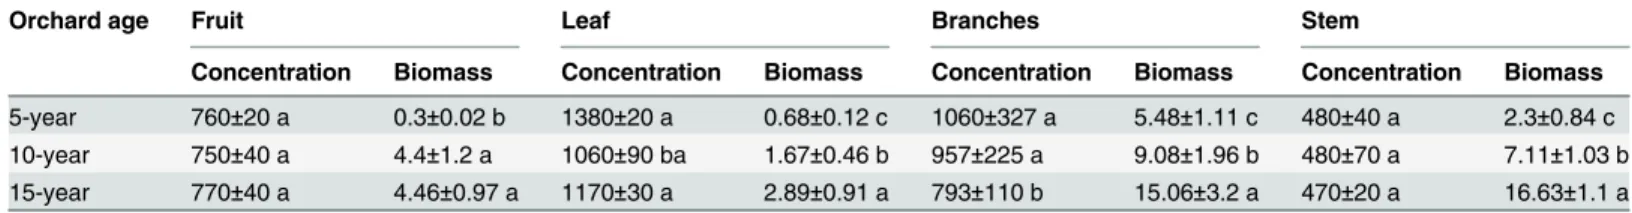
P concentration was much higher in the leaves and branches than in the fruits and stems. How-ever, there was no significant difference in P concentration in organs in different apple
orchards except the branches. The biomass increased with the age of the orchards. The above-ground biomass (except fruits) was much higher in the 15-year-old apple orchard than in the 5- or the 10-year-old apple orchards (Table 1). Specifically, the aboveground biomass (leaves, branches and stem) in the 15-year-old apple orchard was 1.7–3.2 times that of the 10-year-old-apple orchard, and 2.8–7.2 times that of the 5-year-old10-year-old-apple orchard, respectively. Fruits in the 15-year-old apple orchard were similar to that in the 10-year-old apple orchard, both of which were much higher than that in the 5-year-old apple orchard. One possible explanation for this is that the 5-year-old apple trees were much younger.
Phosphorus balance under long-term phosphate fertilization
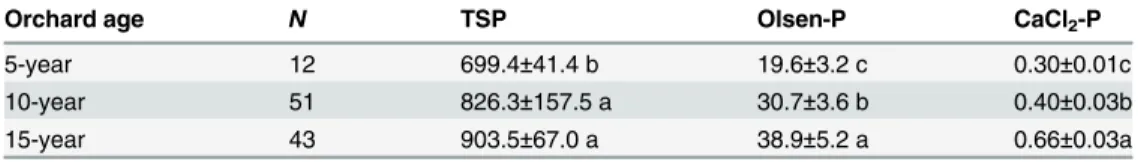
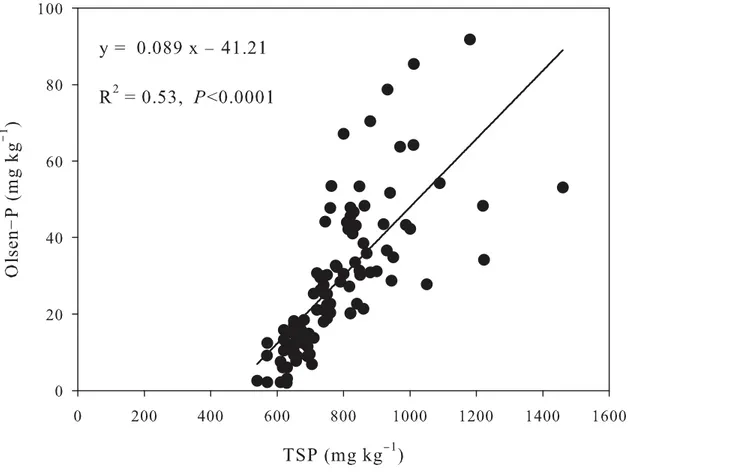
The average TSP and Olsen-P of the topsoil (0–20 cm) of grassland was 560 mg kg−1and 3.1 mg kg−1, respectively. In comparison, a large amount of P has accumulated in soils of apple orchard under long-term phosphate fertilization (Table 3). TSP was increased by 25% (699.4 mg kg−1), 48% (826.3 mg kg−1) and 60% (903.5 mg kg−1) in 5-, 10-, and 15-year-old apple orchards, respectively. Similarly, Olsen-P was increased by 6 times (19.6 mg kg−1), 10 times (30.7 mg kg−1), and 12 times (38.9 mg kg−1); and CaCl2-P was increased from an undetectable
level in grassland to 0.66 mg kg−1in 15-year-old orchard (Table 3). In addition, the regression analysis indicated that Olsen-P was linearly related to TSP (R2= 0.53,P<0.0001) (Fig 3), and CaCl2-P increased significantly with the increase of Olsen-P, especially above the change point
of 46.1 mg kg−1(R2= 0.77,P<0.001) (Fig 4). CaCl2-P was a major factor for P pollution.
Changes in
Q
mand DPS in P-accumulated soils
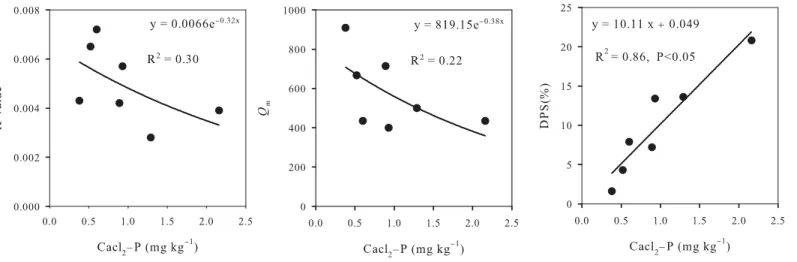
The sorption isotherms of each apple orchard were found to fit the Langmuir isotherm model (R2= 0.91–0.98).Fig 5a and 5bshowed that theKandQmvalues decreased dramatically with increasing P concentration. AverageKdecreased from 0.0072 to 0.0028, andQmdecreased by 52% from 909 mg kg−1to 435 mg kg−1with the increase of CaCl2-P from 0.38 mg kg−1to 2.16
mg kg−1. However, DPS increased by about 13 times from 1.6% to 20.8% (Fig 5c). All these results suggested that soil P sorption capacity decreased with increasing P accumulation in soil.
Discussion
Phosphorus accumulation in calcareous soil of Loess Plateau
In China, agricultural fertilizer consumption has been growing at an unprecedented rate since the end of 1980s, and approximately 52.39 million tons of fertilizer was used in 2008,
Table 1. Phosphorus concentration and aboveground biomass in different organs of apple trees.
Orchard age Fruit Leaf Branches Stem
Concentration Biomass Concentration Biomass Concentration Biomass Concentration Biomass
5-year 760±20 a 0.3±0.02 b 1380±20 a 0.68±0.12 c 1060±327 a 5.48±1.11 c 480±40 a 2.3±0.84 c 10-year 750±40 a 4.4±1.2 a 1060±90 ba 1.67±0.46 b 957±225 a 9.08±1.96 b 480±70 a 7.11±1.03 b 15-year 770±40 a 4.46±0.97 a 1170±30 a 2.89±0.91 a 793±110 b 15.06±3.2 a 470±20 a 16.63±1.1 a
Note : Phosphorus concentration: mg kg−1, aboveground biomass: kg, different letters indicate significant differences among orchard ages (p<0.05). doi:10.1371/journal.pone.0135160.t001
Table 2. Phosphorus balance in the three different age apple orchard (P kg ha−1).
Orchard age 5-year 10-year 15-year
Inputs 228 585 1404
Outputs
Fruit 0.4 14.1 28.7
Leaf 3.9 11.2 25.3
Branches 4.8 7.2 9.9
Stem 0.9 2.8 6.5
Total 10.0 35.3 70.4
Balance
P surplus 218.0 549.7 1333.6
accounting for 31.4% of the global total consumption [30]. In the Loess Plateau, the application of fertilizer has also been on the raise in recent years [31–33], and the annual fertilizer input was about 750 kg hm−2(P2O5) or more in apple orchards converted from cropland. Calcareous
soils in the Loess Plateau have a high TSP [34], but the available P (Olsen-P) in soil is as low as 5.9 mg kg−1[33], which can have a significant effect on crop production in this region. The results of this study showed that P input far exceeded the removal of P in this region, and the use efficiency was low (4%−6%) because of the high fixation of P [35]. The apple orchard has
accumulated 868 kg P ha−1over a period of 15 years, with an average rate of about 58 kg ha−1 year−1. It was reported that the productive grassland and arable area accumulated an average P surplus of c. 1000 kg ha−1over a period of 65 years in UK [3], net total P accumulation in soils at Crichton ranged from 16 kg ha−1to 232 kg ha−1[1], and the total P concentration (15 cm depth) ranged from 920 mg kg−1without P application to 3750 mg kg−1with 16-year P tion in Canada [2]. However, P accumulation in these countries was largely due to the applica-tion of manure, especially in areas having intensive livestock producapplica-tion; whereas P
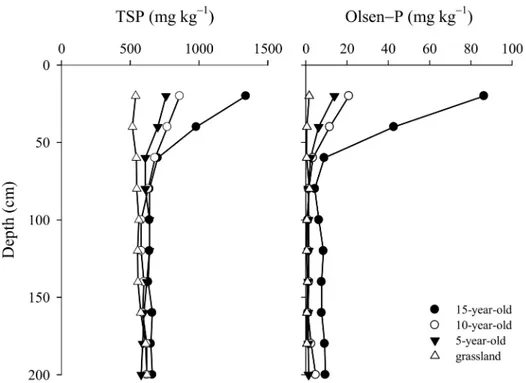
accumulation in the Loses Plateau of China was mostly caused by the application of phosphate fertilizers. In general, P accumulation could enhance the translocation of dissolved P from top-soil to subtop-soil. However, there are few studies estimating the extent of such translocation. In this study, P has accumulated to a depth of 60 cm, and Olsen-P at a depth of 60–200 cm was higher in 15-year-old orchard than in other orchards, indicating that P accumulation resulted in P translocation in soils (Fig 6). The translocation of P from topsoil to subsoil has also been observed in North America and Europe [7]. In the USA, the vertical movement of P in some cultivated profiles occurred to a depth of 40 cm [36], and long-term surplus P fertilization resulted in P accumulation to 75 cm depth in Demark [7].
Soil P sorption has been suggested to be closely related to P accumulation, particularly Olsen-P and CaCl2-P. In this study, we determinedKvalues,Qmvalues and DPS for soils with low, middle, and high P status (Table 4), and the results showed that P sorption decreased as soils become more saturated with P. These parameters were suggested to be related to the het-erogeneity of sorption sites, which was defined as any reaction center that could result in the transfer of P from solution to solid phase [37]. These sites also show a reduced affinity for P according to bothKandQmvalues. Long-term application of surplus P fertilizers may result in P enrichment of the soils [11,12], saturated soil P sorption sites and decline of P holding capac-ity. In this study, high P accumulation may contribute to the accelerated translocation of P from topsoil to subsoil. Olsen-P increased by 11 mg kg−1with the increase of TSP from 699 mg kg−1 to 826 mg kg−1, and by 9 mg kg−1with further increase of TSP from 826 mg kg−1to 904 mg kg−1. Because of the high P fixation capacity of soils, vertical movement of P was generally con-sidered of little importance. We found that long-term application of surplus P in the Loess Pla-teau resulted in P accumulation to a depth of at least 60 cm (Fig 6). Thus, calcareous soil with high fixation in the Loess Plateau has a high risk of P translocation from topsoil to subsoil under long-term application of surplus P, because they will maintain high P concentration in soil.
Table 3. Effects of the number of years on soil total P, Olsen-P and CaCl2-P in orchard.
Orchard age N TSP Olsen-P CaCl2-P
5-year 12 699.4±41.4 b 19.6±3.2 c 0.30±0.01c
10-year 51 826.3±157.5 a 30.7±3.6 b 0.40±0.03b
15-year 43 903.5±67.0 a 38.9±5.2 a 0.66±0.03a
Note : Total P, Olsen-P and CaCl2-P: mg kg−1, Different letters indicate significant differences among
orchard ages (p<0.05).
Changes in P forms in Loess Plateau and impact of surplus P on the soil
nutrient supply
There have been many studies investigating the changes in P forms in Loess Plateau. Guo et al. found that inorganic P increased with the application of P fertilizer for 13 years, inorganic P was 627.8μg kg−1, including Ca8-P 86μg g−1, Ca8-P 378.6μg g−1, Al-P 32.1μg g−1, Fe-P 39.1μg g−1,
O-P 64.6μg g−1[38]. Lai et al. showed that Ca-P, O-P, Al-P, and Fe-P accounted for approxi-mately 70%, 9%, 6% and 5% of the total inorganic P, respectively, all of which increased with the addition of P fertilizer [39]. In addition, Li et al. showed that surplus P could decrease the con-tent of exchangeable potassium (K) and calcium (Ca), especially exchangeable Ca, while Ca defi-ciency will lead to apple tree canker which reduces the quality and quantity of apples [40].
Environmental and agronomic implications
The application of P fertilizers to agricultural land, particularly in areas with P-deficient soils, could improve crop production and maintain soil fertility [1]. However, in case of low use effi-ciency, P will accumulate in soils that can be potentially harmful to the environment. In Loses Plateau, P use efficiency is lower in apple orchard (4–6%) than in farmland (10–15%), resulting in P accumulation in soils. Enhanced P losses through subsurface runoff on loam soils could be expected when Olsen-P is above 60 mg kg−1in UK [15] and 22 mg kg−1in Northern Ireland [16]. Soil would attain 25% soil saturation with P in 10–15 years, resulting in excessive runoff P concentrations in Netherlands [1]. Heckrath et al. [15] proposed a leaching change-point to predict the leaching potential of soil P, and found a clear change-point in the response curve of
Fig 3. Relationship between total soil P and Olsen-P in P-accumulated soils.
Olsen-Pvs. CaCl2-P. This curve is very useful for estimating the amount of P needed to
enhance Olsen-P to the critical level. In this study, a change-point of 46.1 mg kg−1was observed in the in the response curve of Olsen-Pvs. CaCl2-P (Fig 3), which was slightly higher
than that of Yangling (39.9 mg kg−1), but far lower than that of Qiyang (90.2 mg kg−1) [17]. CaCl2-P above the change-point increased dramatically with increasing soil Olsen-P Fig 4. Relationships between CaCl2-P and Olsen-P in P-accumulated soils.
doi:10.1371/journal.pone.0135160.g004
Fig 5. Relationships among K-value, Qm, DPS, and CaCl2-P under P-accumulated soils.
(slope = 0.0251), which was about 7 times that below the change-point (slope = 0.0036). This clearly indicates that the risk of P losses, especially via runoff, will increased sharply when Olsen-P content is above the change point. Therefore, it is imperative to optimize soil P man-agement strategy to achieve optimal crop yield on one hand, and decrease soil P accumulation and losses on the other hand. The critical Olsen-P level for apple orchard in Loess Plateau is determined to be 15 mg kg−1, below which apple trees may suffer from poor growth. In this study, Olsen-P in apple orchards (19.6 mg kg−1to 38.9 mg kg−1) was within the change points (15 mg kg−1to 46.1 mg kg−1). If surplus P is applied, it will accelerate P accumulation in soil and environment pollution.
Uncertainty of calculate in P balance
Phosphorus in root is important for the estimation of P uptake by apple trees. However, it is difficult to collect the total root biomass in the field conditions, and P in root ultimately returns
Fig 6. Total P and Olsen-P distribution in the 0−200 cm profile under P-accumulated soil.
doi:10.1371/journal.pone.0135160.g006
Table 4. Characteristic value of soil P adsorption (Q=QmKC/(1+kC)).
Site Olsen-P CaCl2-P K Qm R2 DPS
1 14.57 0.38 0.0043 909.1 0.9148 1.6
2 28.75 0.52 0.0065 666.7 0.9530 4.3
3 34.40 0.60 0.0072 434.8 0.9647 7.9
4 51.66 0.89 0.0042 714.3 0.9362 7.2
5 53.78 0.93 0.0057 400.0 0.9621 13.4
6 68.08 1.29 0.0028 500.0 0.9783 13.6
7 90.38 2.16 0.0039 434.8 0.9289 20.8
Note : Olsen-P and CaCl2-P: mg kg−1,K:μmLg−1,Q
to soil through root decomposition. The lack of P in root contributes to the uncertainty in the estimation of P balance. The sampling strategy, space substitute for time, was used in this study. Moreover, a large number of samples were collected to reduce the error in the estimation of P balance. The total P in organs was equal to the biomass multiplied by the P concentration, where the same P concentration was used in all cases because there was no significant different in the P concentration of organs among different apple orchards (Table 1).
Apple trees have different P uptake capacities at different ages, and younger apple trees gen-erally have stronger uptake capacities than old apple trees [41,42]. However, in this study, there was no significant difference in P concentration in organs in different apple orchards except the branches (Table 1). Another factor for the uncertainty in P balance was the annual variation of temperature, precipitation and other factors. For example, apple trees could uptake more P in wet years than in dry years due to more rain water supply.
Conclusions
Long-term application of surplus P fertilizers resulted in significant P accumulation in soils of apple orchards in Loess Plateau, China. As compared with the grassland, TSP was increased by 60% and Olsen-P was increased by 12 times (38.9 mg kg−1) in 15-year-old apple orchard.K
andQmvalues decreased dramatically; whereas DPS increased with increasing P concentration. CaCl2-P increased significantly with the increase of Olsen-P, especially above the change point
of 46.1 mg kg−1. Thus, surplus P may pose a significant environmental risk.
Supporting Information
S1 Table. (Relationship between total soil P and Olsen-P in P-accumulated soils).
(DOC)
S2 Table. (Relationships between CaCl2-P and Olsen-P in P-accumulated soils).
(DOC)
S3 Table. (Relationships among K-value, Qm, DPS, and CaCl2-P under P-accumulated soils).
(DOC)
S4 Table. (Total P and Olsen-P distribution in the 0−200 cm profile under P-accumulated soil).
(DOC)
Acknowledgments
This work is supported by the "Strategic Priority Research Program—Climate Change: Carbon Budget and Related Issues" of the Chinese Academy of Sciences (Grant No. XDA05050504), and the Non-profit Research Foundation for Agriculture (No. 201203039).
Author Contributions
References
1. Hooda PS, Truesdale VW, Edwards AC, Withers PJA, Aitken MN, Miller A, et al. Manuring and fertiliza-tion effects on phosphorus accumulafertiliza-tion in soils and potential environmental implicafertiliza-tions. Adv Environ Res. 2001; 5: 13–21.
2. Whalen JK. Chang C Phosphorus accumulation in cultivated soils from long-term annual applications of cattle feedlot manure. J Environ Qual. 2001; 30: 229–237. PMID:11215658
3. Withers PJA, Edwards AC, Foy RH. Phosphorus cycling in UK agriculture and implications for phos-phorus loss from soil. Soil Use Manage. 2001; 17: 139–149.
4. Djodjic F, Bergström L, Grant C. Phosphorus management in balanced agricultural systems. Soil Use Manage.2005; 21: 94–101.
5. Kyllingsbæk A, Hansen JF. Development in nutrient balances in Danish agriculture 1980–2004. Nutr Cycl Agroecosys. 2007; 79: 267–280.
6. Mejías JH, Alfaro M, Harsh J. Approaching environmental phosphorus limits on a volcanic soil of South-ern Chile. Geoderma. 2013; 207: 49–57.
7. Rubaek GH, Kristensen K, Olesen SE, Ostergaard HS, Heckrath G. Phosphorus accumulation and spatial distribution in agricultural soils in Denmark. Geoderma. 2013; 209: 241–250.
8. Kronvang B, Rubæk GH, Heckrath G. International Phosphorus Workshop: Diffuse phosphorus loss to surface water bodies—Risk assessment, mitigation options, and ecological effects in river basins. J Environ Qual. 2009; 38: 1924–1929. doi:10.2134/jeq2009.0051PMID:19704136
9. Maguire RO, Rubæk GH, Haggard BE, Foy BH. Critical evaluation of the implementation of mitigation options for phosphorus from field to catchment scales. J Environ Qual. 2009; 38: 1989–1997. doi:10. 2134/jeq2007.0659PMID:19704142
10. Sattari SZ, Bouwman AF, Giller KE, van Ittersum MK. Residual soil phosphorus as the missing piece in the global phosphorus crisis puzzle. PNAS. 2012; 109: 6348–6353. doi:10.1073/pnas.1113675109 PMID:22431593
11. Werner W, Wodsak H-P. The role of non-point nutrient sources in water pollution—present situation, countermeasures, outlook. Water Sci Technol.1995; 31: 87–97.
12. Tilman D, Fargione J, Wolff B, D'Antonio C, Dobson A, Howarth R, et al. Forecasting agriculturally driven global environmental change. Science. 2001; 292: 281–284. PMID:11303102
13. Allen BL, Mallarino AP. Relationships between extractable soil phosphorus and phosphorus saturation after long-term fertilizer or manure application. Soil Sci Soc Am J. 2006; 70: 454–463.
14. Casson JP, Bennett DR, Nolan SC, Olson BM, Ontkean GR. Degree of phosphorus saturation thresh-olds in manure-amended soils of Alberta. J Environ Qual. 2006; 35: 2212–2221. PMID:17071891 15. Heckrath G, Brookes PC, Poulton PR, Goulding KWT. Phosphorus leaching from soils containing
differ-ent phosphorus concdiffer-entrations in the Broadbalk experimdiffer-ent. J Environ Qual. 1995; 24: 904–910. 16. Jordan C, McGuckin SO, Smith RV. Increased predicted losses of phosphorus to surface waters from
soils with high Olsen‐P concentrations. Soil Use Manage. 2000; 16: 27–35.
17. Bai ZH, Li HG, Yang XY, Zhou BK, Shi XJ, Wang Borenl, et al. The critical soil P levels for crop yield, soil fertility and environmental safety in different soil types. Plant Soil. 2013; 372: 27–37.
18. Whalen JK. Chang Phosphorus sorption capacities of calcareous soils receiving cattle manure applica-tions for 25 years. Commun Soil Sci and Plan. 2002; 33: 1011–1026.
19. Beauchemin S, Simard RR. Soil phosphorus saturation degree: Review of some indices and their suit-ability for P management in Quebec. Can J Soil Sci. 1999; 79: 615–625.
20. Bolland MDA, Allen DG. Phosphorus sorption by sandy soils from Western Australia: effect of previ-ously sorbed P on P buffer capacity and single-point P sorption indices. f applied phosphate and sul-phate in weathered acid soils. Austr J Soil Res. 2003; 41: 1369–1388.
21. Eghball B, Binford GD, Baltensperger, David D. Phosphorus movement and adsorption in a soil receiv-ing long-term manure and fer tilizer application. J Environ Qual. 1996; 25: 1339–1343.
22. Sharpley AN. Availability of residual phosphorus in manured soils. Soil Sci Soc Am J. 1996; 60: 1459–
1466.
23. Olsen SR, Watanabe FS. A method to determine a phosphorus adsorption maximum of soils as mea-sured by the Langmuir isotherm. Soil Sci Soc Am J. 1957; 21: 144–149.
24. Murphy J, Riley J. A modified single solution method for the determination of phosphate in natural waters. Anal Chim Acta. 1962; 27: 31–36.
26. Nair PS, Logan TJ, Sharpley AN, Sommers LE, Tabatabai MA, Yuan TL. Interlaboratory comparison of a standardized phosphorus adsorption procedure. J Environ Qual. 1984; 13: 591–595.
27. Guo SL, Dang TH, Hao MD. Phosphorus Changes and Sorption Characteristics in a Calcareous Soil Under Long-Term Fertilization. Pedosphere. 2008; 18: 248–256.
28. Pautler MC, Sims JT. Relationships between soil test phosphorus, soluble phosphorus, and phospho-rus saturation in Delaware soils. Soil Sci Soc Am J. 2000; 64: 765–773.
29. Lu SC, Yan ZJ, Chen Q, Zhang FS. Evaluation of Conventional Nitrogen and Phosphorus Fertilization and Potential Environment Risk in Intensive Orchards of North China. J Plant Nutr. 2012; 35: 1509–
1525.
30. Xin LG, Li XB, Tan MH. Temporal and regional variations of China’s fertilizer consumption by crops dur-ing 1998–2008. J Geogr Sci. 2012; 22: 643–652.
31. Lu RK, Liu HX, Wen DZ, Qin SW, Zheng JY, Wang ZQ. Soil nutrients cycling and balance in agroeco-systems of China: III. Status of nutrients cycling and balance in agroecoagroeco-systems of China. Chinese J Soil Sci. 1996; 27: 193–196.
32. Zhu XM. Soils and Agriculture in the Loess Plateau. Agriculture Press, Beijing. pp. 1989; 286–297. 33. Peng L, Peng KS. Grain production and fertilization in Shaanxi Province. Acta Agriculturae
Boreali-Occidentalis Sinica. 1998; 2: 104–108.
34. Zhu XM, Li YS. Soils of the Loess Region in China. Geoderma. 1983; 29: 237–255.
35. Wu FQ, Liu HB, Sun BS, Wang J, Gale WJ. Net primary production and nutrient cycling in an apple orchard—annual crop system in the Loess Plateau, China: a comparison of Qinguan apple, Fuji apple, corn and millet production subsystems. Nutr Cycl Agroecosys. 2008; 81: 95–105.
36. Mozaffari M, Sims JT. Phousphorus Avalibiyilt and Sorption in Atlantic Coastal-plant Wantershed Domi-nated by Animal-based Agriculture. Soil Science. 1994; 157: 97–107.
37. Skopp J. Derivation of the Freundlich Adsorption Isotherm from Kinetics. J Chem Educ. 2009; 86: 1341–1343.
38. Guo SL, Dang TH, Liu SZ, Hao MD. Changes in characterization of phosphorus sprtion in relation to its forms and soil organic carbon. Plant Nutr Ferti Sci. 2005; 11: 33–39.
39. Lai L, Hao MD, Peng LF. The varioation of soil phosphorus of long-term continious cropping ang man-agement on Loess Plateau. Res Soil Water Conservation. 2003; 10: 68–70.
40. Li YX, Liu SJ, Xu QM, Huang DM. Preliminary study on the effects of excess soil N and P on soil nutrient elements and cucumber nutrient absorption. J Soil Water Conservation. 2013; 27: 98–101.
41. Wu FQ, Haibin L, Baosheng S, Jian W, Gale WJ. Net primary production and nutrient cycling in an apple orchard—annual crop system in the Loess Plateau, China: a comparison of Qinguan apple, Fuji apple, corn and millet production subsystems. Nutr Cycl Agroecosys. 2008; 81: 95–105.