Metabolizable Energy and Amino Acids Relationships with the Soluble Fractions of
Protein and Fiber of Vegetable Feed Ingredients
Claudio Bellaver1, Dirceu Luís Zanotto2, Antônio Lourenço Guidoni3, Paulo Antônio R. de Brum1
ABSTRACT - To estimate nutrient and energy digestion with animal from in vitro variables it is necessary to control factors that may interfere on digestion such as: source and concentration of digestor substance, as well as the origin and processing of test ingredients. In this study there were performed five laboratory assays, two with poultry and finally regression equations were established based on variables generated with twelve vegetable ingredients. The results showed that there is greater solubility of proteins with NaOH than with KOH. On average, both alkali produced better discrimination of soluble protein with concentration of 0.02% (range of 68.61%) in relation to a concentration of 0.2% (range of 37.97%). Considering interaction between alkali and concentration, the best discrimination on protein solubility was reached with NaOH at 0.02%. The methods of protein or fiber solubilization together with the chemical analysis showed significant results variation among ingredients and when they were used to estimate in vivo variables they produced good estimates. It was concluded that reliable digestion estimates for energy or amino acids from vegetable feed ingredients could be obtained from in vitro variables, when considering solubilities of protein and fiber with chemical analysis.
Key Words: prediction equations, energy, total dietary fiber, nitrogen solubility, fiber solubility, alkali digestion, pepsin digestion.
Energia Metabolizável e Relações de Aminoácidos com as Frações Solúveis de Proteína
e Fibra de Ingredientes Vegetais
RESUMO - Para estimar a digestão de nutrientes e de energia dos animais a partir de variáveis in vitro, é necessário controlar os fatores que interferem na digestão – origem e concentração da substância digestora – e ter conhecimento da fonte e do processo que envolve o ingrediente em teste. Neste trabalho, foram conduzidos cinco ensaios laboratoriais, dois com animais e, por fim, estabelecidas equações de regressão a partir das variáveis geradas com a utilização de 12 ingredientes vegetais. Os resultados mostraram que há maior solubilidade das proteínas com o NaOH que com o KOH e que, na média de ambos os álcalis, a concentração de 0,02% permite maior discriminação na solubilidade das proteínas (diferença de 68,61%) em relação a 0,2% (37,97%). Considerando a interação entre álcalis e concentrações, a melhor discriminação foi com NaOH a 0,02%. Os métodos de solubilização da proteína ou fibra, juntos com as análises bromatológicas, mostraram variações significativas e, quando usados para relacionar as variáveis in vivo, produziram bons resultados estimadores. Cncluiu-se que podem ser obtidas estimativas confiáveis da digestão animal de ingredientes vegetais com a determinação de variáveis in vitro, desde que considerados fatores relacionados à solubilidade da proteína e fibra e variáveis químico-bromatológicas.
Palavras-chave: equações de predição, energia, fibra dietética total, solubilidade do nitrogênio, solubilidade da fibra, digestão em alcali, digestão em pepsina
1PhD researcher at Embrapa Swine and Poultry National Research Center, 89700-000 Concórdia SC, Brazil. Phone +55 49 442 8555;
Fax +55 49 442 8559; CNPq fellow. emails should be addressed to: [email protected]
2MSc Lab researcher at Embrapa Swine and Poultry National Research Center. 3
Introduction
Many times the difficulty in estimating the in vitro nutrients and energy digestion is associated with the misunderstanding in knowing or controlling the factors which interfere with the digestion, such as the protein source (Johnson, 1992), the enzymatic concentration (Johnston & Coon, 1979; Parsons et al., 1997), the enzyme and the pH (Cone, 1993), as well as the
and Lindner (1960) and AOAC (1995). Based on the information obtained by Parsons et al. (1997) and Bellaver et al. (2000) it is known that the digestor substance concentration must be smaller than the originally recommended by AOAC (1995) for animal origin meals and also that the enzymatic method could be used to vegetable ingredients. Soybean meal has been analyzed more frequently than the rest of vegetable ingredients for the digestion in KOH. However, other methodology proposed by Prosky et al. (1992) is more useful in the establishment of relationships among in vivo and in vitro variables. This method uses three enzymes in the routine, having been found that the total dietary fiber (TDF) introduces high repeatability and that the used vegetable species show significant differences regarding TDF contents. Thus, the goal of this paper was to obtain chemical data, protein and fiber solubility of the vegetable ingredients and to relate them with the obtained in vivo values for the same ingredients.
Material and Methods
The methodology used in this work consisted of five in vitro assays, two in vivo and a regression analysis involving the in vitro and in vivo variables of a set of vegetable origin ingredients. Statistical analyses were carried out using the procedures described in the SAS program (2001). The assays are described as follow. Assay 1 - Determination of the ingredients chemical composition
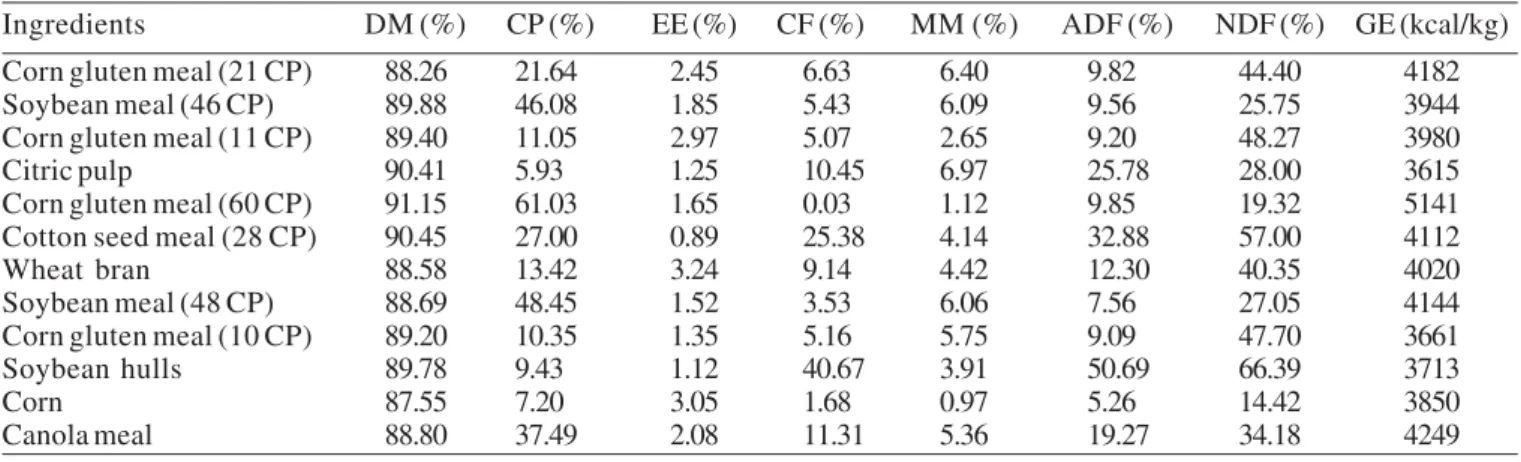
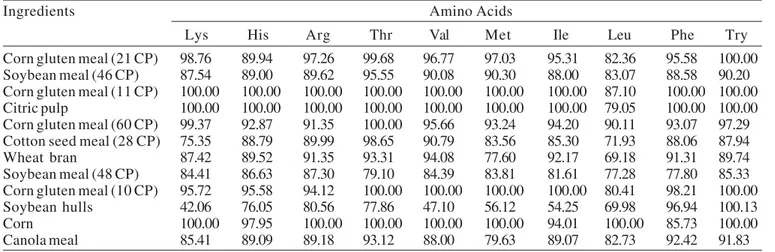
The twelve analyzed ingredients were: 1) corn gluten meal - 21% crude protein (21 CP), 2) soybean meal - 46% crude protein (46 CP), 3) corn gluten meal - 11% crude protein (11 CP), 4) citric pulp, 5) corn gluten meal - 60% crude protein (60 CP), 6) cotton seed meal - 28% crude protein (28 CP), 7) wheat bran, 8) soybean meal - 48% crude protein (48 CP), 9) corn gluten meal - 10% crude protein (10 CP), 10) soybean hulls, 11) corn and 12) canola meal. These ingredients were submitted to lab analyses determination for dry matter (DM), gross energy (GE), crude protein (CP), ether extract (EE), mineral matter (MM), crude fiber (CF), acid detergent fiber (ADF), neutral detergent fiber (NDF), calcium (CA), phosphorus (P), copper (Cu), iron (Fe), manganese (Mn), zinc (Zn), potassium (K) and amino acid (AA). The methods used for the accomplishment of these determinations have been described by AOAC (1995).
Assay 2 – Test of protein solubilization in alkalis with different concentration
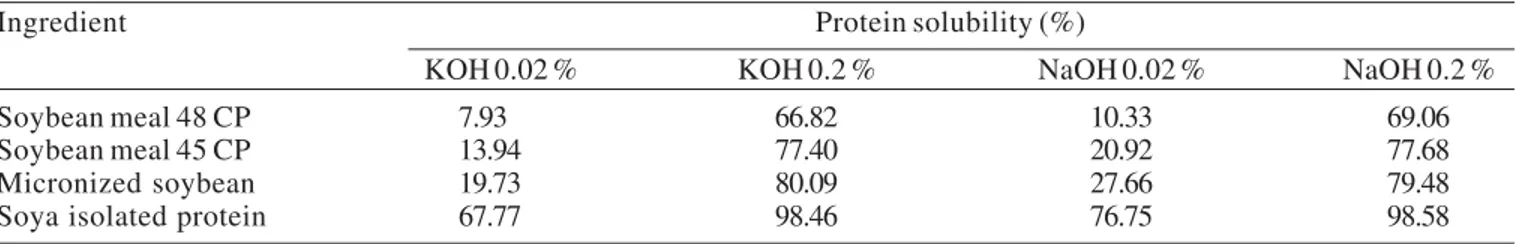
These tests were used to determine the in vitro protein solubility using two alkalis (NaOH and KOH), two alkali concentrations (0.2 and 0.02%) and four ingredients (two soybean meals, micronized and protein isolated soya meals). The experimental design was the completely randomized, with 16 treatments, in factorial structure 2 x 2 x 4 (two alkalis, two concentrations and four ingredients), with six replications of each treatment. The grinding and treatment of the ingredients were accomplished according to the procedures established by Araba & Dale (1990). The procedure used to solubilize the protein was established according to the Brazilian Compendium of Animal Feeding (1998) considering alkali and respective concentration variations. Assay 3 - Protein vegetable ingredient solubility determination with alkalis
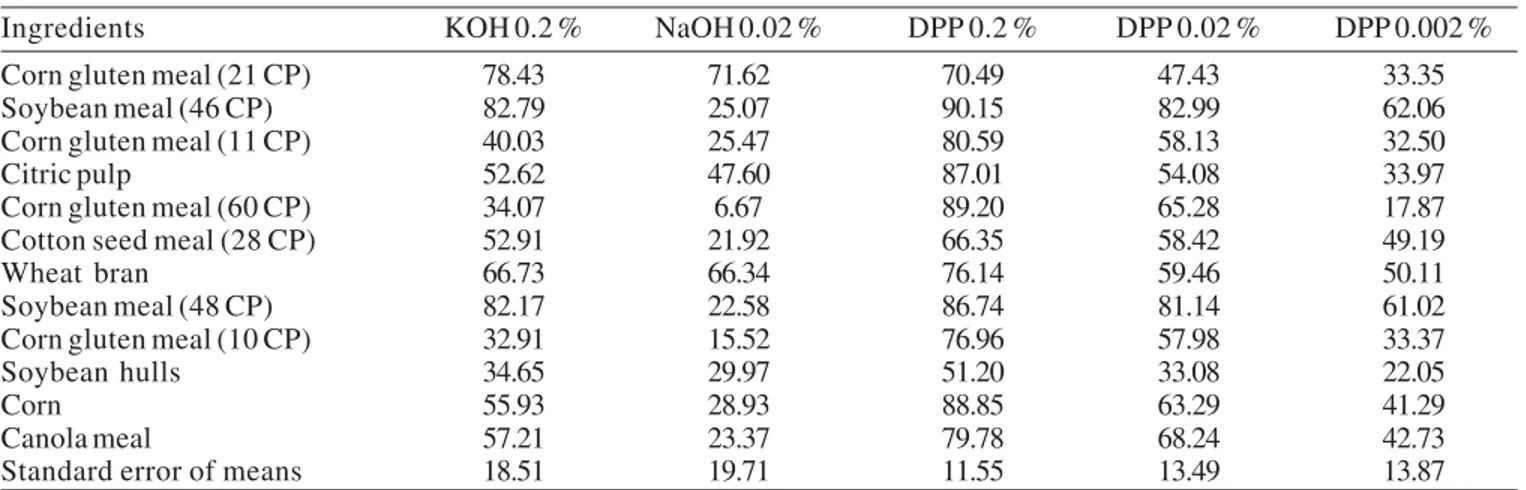
This assay was carried out with twelve vegetable ingredients and two alkalis. The studied ingredients were the same of the assay 1. The analysis using protein solubility method was the same described by the Brazilian Compendium of Animal Feeding (1998), having the digesting substances KOH in the concentration of 0.2% and NaOH in the concentration of 0.02%. KOH at 0.2% was used as a standard procedure (Pomeranz & Lindner, 1960) and NaOH at 0.02%, for being an alkali and at a concentration that allow a larger solubilization of the proteins, as indicated in the assay 2. The experimental design was the completely randomized, with factorial structure 12 x 2 (twelve ingredients x two alkalis), with four replications. Assay 4 – Protein vegetable ingredient solubility determination with pepsin
This assay was completed with the same assay ingredients described on assay 1. The methodology adopted for solubilization of the protein in pepsin was that employed by Bellaver et al. (2000), and the used pepsin concentrations equivalent to 0.02%, 0.002% and 0.0002%. The experimental design was the completely randomized with factorial structure 12 x 3 (twelve ingredients x three pepsin concentrations) with four replicates.
Assay 5 – Total dietary fiber determination (TDF) of vegetable ingredients
Prosky et al. (1992). The ingredient samples were previously dried at 105°C, grounded to obtain smaller particles than 0.5 mm and degreased. This method is based in gelatinization of the sample with Thermamyl (stable alpha-amilase to the warmth), followed by enzymatic digestion with protease and amiloglicosidase to remove proteins and starch. The experimental design was the completely randomized with twelve ingredients and six replications.
Assay 6 - Amino acid digestibility coefficient determination
This experiment was performed in the metabolism room of Embrapa Swine and Poultry National Center, Brazil, where the roosters were allocated in individual cages and maintained in an environment with natural and /or artificial light for periods of 18 hours/day. The temperature was maintained in the thermal neutrality zone. The ingredients of the amino acid metabolizable determination were the same of the assay 1 and the forced feeding method of Sibbald (1979) was used, with the adaptation of Parsons (1985b) for cecotomized adult roosters (2,3±0,2 kg). The formula used to calculations was that given by Parsons (1985a). The experimental design was the completely randomized with twelve ingredients plus the control treatment (starvation), with four replications of one rooster per experimental unit. At the beginning of the assay, the roosters were maintained in fasting for a period of 36 hours, in order to empty the digestive content. Then they were forced to ingest 30 g of the ingredient in test, all at once, through a funnel introduced inside the crop, placed way intra-esophagus. After the roosters’ feeding, excretas were collected twice a day from the plastic trays continuously placed for a period of 48 hours under the cages. At the same time four roosters were maintained with no feed in order to collect and calculate the endogenous and metabolic losses. The material, after collected, was weighed, identified, placed in plastic bags, and frozen until the final collection. Thus, the material was defrosted, homogenized and placed in the freeze drier for dehydration and posterior determination of DM, N and amino acids according with the methodologies described by AOAC (1995).
Assay 7 - Determination of apparent metabolizable energy N corrected
This experiment was carried out with broiler chicks, using excretas total collection method, as proposed by Hill & Anderson (1958), described by
Albino (1992). Broilers, 780, were distributed in blocks at random, with 13 treatments (the same twelve previous assays ingredients and one more reference diet), with six replications of ten birds each (five males and five females). Broilers were in experimen-tal period with 15 days of age and maintained during 9 days, being four days for adaptation and five days for the collection of total excreta. Test ingredients were included at 40% in a reference diet. General care with the birds’ hygiene and health were adopted, keeping the environment on the thermal comfort zone. Regression analyses – Analyses between apparent metabolizable energy N corrected (AMEn) and the amino acid digestibility coefficients, with the in vitro variables.
Among all the in vitro variables for the same twelve ingredients, 13 were selected and correlated with values obtained by the in vivo assays. The in vitro variables involved in the estimates were: mine-ral matter (MM), ether extract (EE), crude protein (CP), crude fiber (CF), acid detergent fiber (ADF), neutral detergent fiber (NDF), gross energy (GE), total dietary fiber (TDF), solubility in KOH 0.2% (KOH), solubility in NaOH 0.02% (NaOH), digestibility/solubility in pepsin 0.02% (DPP02), digestibility/solubility in pepsin 0.002% (DPP002), digestibility/solubility in pepsin 0.0002% (DPP0002). These variables were combined up to six parameters (intercept + 5 in vitro variables) in the equation, once this number was the parameters limit in function of observations number (twelve ingredients) used in the study. For each answer variable (metabolizable energy and digestibility coefficients of ten amino acids) 2.379 equations were calculated for each variable. The selection of the more important equations was based on the larger correlation (R2 best fitting to the model parameters), and it was done in combination with the ones that had introduced the minimal error on the estimation.
Results and Discussion
However, the variance analysis revealed that there were differences in the solubility due to protein sources (P<0.001), alkalis (P=0.025), concentration of alkalis (P<0.001) and also due to the interaction between the last factors (P=0.054), which is presented in Table 5. The solubility averages were calculated with their deviations and amplitude, assuming that the biggest difference of solubility can better characterize the differences between samples, when related with in vivo values, like protein solubility in pepsin (Bellaver et al., 2000). In this assay it was observed that the better protein solubility was obtained with NaOH (57.56%) than with KOH (54.02%) and that in the average from both alkalis the concentration of 0.02% allows larger discrimination in the proteins solubility (difference of 68.61%) in respect to 0.2% (37.97 %). Considering the existing interaction between alkalis
and concentrations, the best discrimination was obtained with NaOH to 0.02%.
The results of protein solubility under these conditions for the twelve vegetable ingredients are displayed in Table 6. Also the table shows the pepsin digestibility values for three enzyme concentrations (0.2, 0.02 and 0.002%). The results of total dietary fiber determination (TDF) of the twelve ingredients are exhibited in Table 7.
As it is observed by the analyzes of the ingredients composition, the acid detergent fiber (ADF) oscillated between 5.26 and 50.69%, showing substantial variation in the chemical composition of these ingredients like shown in Tables 1 to 3. The total dietary fiber variation (TDF) gave even larger difference between tested ingredients (6.06 - 77.65%). The in vitro assay in alkali (NaOH 0.02% and KOH
Table 1 - Chemical composition1 and gross energy values for the tested ingredients
Ingredients DM (%) CP (%) EE (%) CF (%) MM (%) ADF (%) NDF (%) GE (kcal/kg)
Corn gluten meal (21 CP) 88.26 21.64 2.45 6.63 6.40 9.82 44.40 4182
Soybean meal (46 CP) 89.88 46.08 1.85 5.43 6.09 9.56 25.75 3944
Corn gluten meal (11 CP) 89.40 11.05 2.97 5.07 2.65 9.20 48.27 3980
Citric pulp 90.41 5.93 1.25 10.45 6.97 25.78 28.00 3615
Corn gluten meal (60 CP) 91.15 61.03 1.65 0.03 1.12 9.85 19.32 5141
Cotton seed meal (28 CP) 90.45 27.00 0.89 25.38 4.14 32.88 57.00 4112
Wheat bran 88.58 13.42 3.24 9.14 4.42 12.30 40.35 4020
Soybean meal (48 CP) 88.69 48.45 1.52 3.53 6.06 7.56 27.05 4144
Corn gluten meal (10 CP) 89.20 10.35 1.35 5.16 5.75 9.09 47.70 3661
Soybean hulls 89.78 9.43 1.12 40.67 3.91 50.69 66.39 3713
Corn 87.55 7.20 3.05 1.68 0.97 5.26 14.42 3850
Canola meal 88.80 37.49 2.08 11.31 5.36 19.27 34.18 4249
1Dry matter (DM), crude protein (CP), ether extract (EE), crude fiber (CF), mineral matter (MM), acid detergent fiber (ADF), neutral
detergent fiber (NDF) and gross energy (GE).
Table 2 - Chemical composition of the ingredients (macro and microelements)
Ingredients Ca (%) P (%) Cu (mg/kg) Fe (mg/kg) Mn (mg/kg) Zn (mg/kg) K (%)
Corn gluten meal (21 CP) 0.01 0.84 7.05 142.84 26.41 79.11 1.98
Soybean meal (46 CP) 0.32 0.53 16.39 219.45 36.39 59.57 2.42
Corn gluten meal (11 CP) 0.01 0.49 4.99 186.84 19.75 50.22 0.70
Citric pulp 1.57 0.11 5.57 739.29 23.58 14.88 1.03
Corn gluten meal (60 CP) 0.01 0.39 13.08 150.77 5.99 28.85 0.14
Cotton seed meal (28 CP) 0.11 0.56 7.22 98.79 15.09 38.02 1.29
Wheat bran 0.07 0.92 12.22 123.24 114.41 78.47 1.05
Soybean meal (48 CP) 0.32 0.57 19.92 208.02 332.49 60.98 2.26
Corn gluten meal (10 CP) 1.03 0.52 5.13 169.21 27.26 53.44 0.68
Soybean hulls 0.58 0.09 6.77 878.73 30.16 55.68 1.12
Corn 0.01 0.24 2.11 75.98 5.81 22.80 0.28
Table 3 - Chemical composition of ingredients total amino acids
Ingredients Amino Acids 1 (%)
Lys His Arg Asp Thr Ser Glu Pro Gly
Corn gluten meal (21 CP) 0.41 0.59 0.61 1.19 0.79 0.84 4.30 1.87 1.13
Soybean meal (46 CP) 2.81 1.11 3.06 9.01 1.75 2.49 10.93 2.11 2.17
Corn gluten meal (11 CP) 0.54 0.33 0.83 0.87 0.58 0.55 1.66 0.61 0.52
Citric pulp 0.19 0.09 0.24 0.52 0.23 0.22 0.46 0.49 0.21
Corn gluten meal (60 CP) 0.84 1.12 2.75 3.95 0.25 3.09 12.72 4.50 1.49
Cotton seed meal (28 CP) 1.08 0.66 3.44 2.20 1.04 1.12 4.83 0.98 0.95
Wheat bran 0.58 0.38 0.85 1.27 0.47 0.65 3.58 0.85 0.99
Soybean meal (48 CP) 3.45 1.35 5.09 6.63 1.38 1.00 3.95 2.05 2.20
Corn gluten meal (10 CP) 0.53 0.30 0.81 0.86 0.57 0.53 1.62 0.59 0.49
Soybean hulls 0.69 0.22 0.30 0.85 0.42 0.58 0.95 0.38 0.83
Corn 0.21 0.21 0.30 0.51 0.26 0.37 1.70 0.69 0.32
Canola meal 2.40 1.03 2.52 2.76 2.28 1.75 7.08 2.32 1.86
Ingredients Amino Acids 2 (%)
Ala Cys Val Met Ile Leu Tyr Phe Try
Corn gluten meal (21 CP) 1.59 0.64 0.98 0.31 0.56 2.07 0.38 0.72 0.09
Soybean meal (46 CP) 1.65 0.78 1.77 0.58 1.91 3.67 1.46 2.19 0.64
Corn gluten meal (11 CP) 0.68 0.21 0.58 0.16 0.35 0.98 0.40 0.46 0.12
Citric pulp 0.21 0.08 0.19 0.06 0.15 0.29 0.14 0.19 0.03
Corn gluten meal (60 CP) 5.04 1.29 2.84 1.28 2.20 9.45 3.81 3.54 0.46
Cotton seed meal (28 CP) 0.91 0.69 0.92 0.49 0.69 1.35 0.79 1.26 0.33
Wheat bran 0.61 0.39 0.51 0.22 0.41 0.89 0.30 0.53 0.19
Soybean meal (48 CP) 2.23 0.90 3.33 0.61 2.15 3.97 2.03 1.28 0.54
Corn gluten meal (10 CP) 0.62 0.26 0.55 0.19 0.30 0.90 0.35 0.42 0.06
Soybean hulls 0.33 0.17 0.35 0.67 0.28 0.50 0.45 0.31 0.05
Corn 0.50 0.20 0.22 0.35 0.22 0.98 0.18 0.31 0.03
Canola meal 1.67 1.13 2.07 0.69 1.38 2.67 1.36 0.73 0.46
1Lys = lysine, His = histidine, Arg = arginine, Asp = apartic acid, Thr = threonine, Ser = serine, Glu = glutamic acid, Pro = proline, Gly=
glycine.
2Ala = alanine, Cys = cystine, Val = valine, Met = methionine, Ile = isoleucine, Leu = leucine, Tyr = tyrosine, Phe = phenylalanine,
Try = tryptophan.
Table 4 - Averages of protein solubility as function of alkali and concentration
Ingredient Protein solubility (%)
KOH 0.02 % KOH 0.2 % NaOH 0.02 % NaOH 0.2 %
Soybean meal 48 CP 7.93 66.82 10.33 69.06
Soybean meal 45 CP 13.94 77.40 20.92 77.68
Micronized soybean 19.73 80.09 27.66 79.48
Soya isolated protein 67.77 98.46 76.75 98.58
Table 5 - Statistics on the protein solubilities by alkali and concentration
Alkali Concentration N Average 1 SD Minimal values Maximal values Difference
KOH 0.02 24 27.34 c 24.31 7.64 71.91 64.27
KOH 0.2 24 80.69 a 11.72 64.14 99.83 35.69
NaOH 0.02 24 33.92 b 26.13 9.44 82.38 72.94
NaOH 0.2 24 81.20 a 11.28 66.54 106.78 40.24
0.2%) and the solubility of the N through the digestibility in pepsin with different concentrations also presented a considerable variation among the ingredients (Table 6).
The results of amino acid digestibility coefficients for each ingredient were calculated and shown in Table 8. The apparent metabolizable energy corrected for nitrogen (AMEn) is shown in Table 9. These values are similar to the conventional digestibility values shown in known animal nutrition tables.
The obtained in vitro variables were correlated with AMEn values and with the in vivo amino acid digestibility coefficients and are displayed in Table 10. These results are consistent and facilitated the prediction equations adjustment shown in Table 10. Eliminating R2 fittings for values lower than 80%, R2 averages values for all the equations were close to 88% and the value estimated average error prediction is situated at 2,95% which encourages additional work on this line. This demonstrates that all the equations except the ones with R2 values lower than 80% represent good to excellent estimates.
In the table of equations the AMEn can be better estimated by an equation that considers the variables TDF, ADF, MM and NaOH. An interesting and important fact is that TDF enters in the formulation of all the equations for AMEn. In general CF or TDF also entered in the digestibility prediction equations of AA. This means that these in vitro variables are essential for AMEn estimates and for the digestibility coefficients of the AA. The lysine digestibility coefficient can be estimated with CF, ADF, CP and DPP02 with a R2 fitting of 95.70% and average error
in the estimate close to 2.75%. Threonine presented a very poor fitting and is not reliable in the estimation by any of the studied equations, being unknown the reason for the failure.
These data allow the improvement of the tables for the amino acid ingredients composition and digestibility. The literature support other predicting methods with alkali to estimate soya quality but actually the methods studied in this paper, as well as, TDF and DPP also are very useful and should be better known for vegetable ingredients.
Due to the promising results found in this work, a continuous research line is expected in this area because it means quickness in the estimates for amino acid and metabolizable energy digestibility, with lower cost and acceptable reliability. With that it
Table 6 - Protein solubility coefficients as function of alkali or pepsin on different concentrations1
Ingredients KOH 0.2 % NaOH 0.02 % DPP 0.2 % DPP 0.02 % DPP 0.002 %
Corn gluten meal (21 CP) 78.43 71.62 70.49 47.43 33.35
Soybean meal (46 CP) 82.79 25.07 90.15 82.99 62.06
Corn gluten meal (11 CP) 40.03 25.47 80.59 58.13 32.50
Citric pulp 52.62 47.60 87.01 54.08 33.97
Corn gluten meal (60 CP) 34.07 6.67 89.20 65.28 17.87
Cotton seed meal (28 CP) 52.91 21.92 66.35 58.42 49.19
Wheat bran 66.73 66.34 76.14 59.46 50.11
Soybean meal (48 CP) 82.17 22.58 86.74 81.14 61.02
Corn gluten meal (10 CP) 32.91 15.52 76.96 57.98 33.37
Soybean hulls 34.65 29.97 51.20 33.08 22.05
Corn 55.93 28.93 88.85 63.29 41.29
Canola meal 57.21 23.37 79.78 68.24 42.73
Standard error of means 18.51 19.71 11.55 13.49 13.87
1 Solubilities in KOH 0.2% or NaOH 0.02%, solubility in pepsin (DPP) at 0.2, 0.02 and 0.002% concentration.
Table 7 - Average values of total dietary fiber (TDF) and their coefficient of variation (CV)
Ingredients TDF (% ± s) CV (%)
Corn gluten meal (21 CP) 37.78 ± 3.43 9.09 Soybean meal (46 CP) 23.48 ± 2.54 10.81 Corn gluten meal (11 CP) 26.05 ± 1.36 5.22
Citric pulp 47.97 ± 2.97 6.20
Corn gluten meal (60 CP) 6.06 ± 3.01 49.75 Cotton seed meal (28 CP) 59.49 ± 3.29 5.53
Wheat bran 41.59 ± 1.24 2.99
Soybean meal (48 CP) 20.75 ± 5.37 25.87 Corn gluten meal (10 CP) 27.55 ± 2.20 7.98
Soybean hulls 77.65 ± 1.73 2.23
Corn 10.13 ± 1.71 16.92
is confirmed the hypothesis that it is possible to estimate the metabolizable energy and amino acid digestibility of vegetables and this result has a great value in the animal feed production systems.
Conclusions
The highest protein solubility was obtained with NaOH and solubility best discrimination occurred in the concentration of 0.02%.
Protein solubility in pepsin and the total dietary fiber introduced considerable and necessary variation among the vegetable samples to use in prediction equations.
Table 9 - Average values for the apparent metabolizable energy corrected for nitrogen (AMEn) and respective coefficients of variation (CV)
Ingredients AMEn (kcal/kg) CV (%)
Corn gluten meal (21 CP) 1632 ± 45 2.73 Soybean meal (46 CP) 2387 ± 50 2.07 Corn gluten meal (11 CP) 2693 ± 131 4.86
Citric pulp 1101 ± 270 24.49
Corn gluten meal (60 CP) 3503 ± 137 3.92 Cotton seed meal (28 CP) 1364 ± 116 8.48
Wheat bran 2065 ± 75 3.62
Soybean meal (48 CP) 2229 ± 185 8.29 Corn gluten meal (10 CP) 2419 ± 51 2.10
Soybean hulls 754 ± 206 27.36
Corn 3290 ± 78 2.36
Canola meal 1989 ± 128 6.42
Table 8 - Digestibility coefficients (%) of amino acids on the natural matter
Ingredients Amino Acids
Lys His Arg Thr Val Met Ile Leu Phe Try
Corn gluten meal (21 CP) 98.76 89.94 97.26 99.68 96.77 97.03 95.31 82.36 95.58 100.00 Soybean meal (46 CP) 87.54 89.00 89.62 95.55 90.08 90.30 88.00 83.07 88.58 90.20 Corn gluten meal (11 CP) 100.00 100.00 100.00 100.00 100.00 100.00 100.00 87.10 100.00 100.00 Citric pulp 100.00 100.00 100.00 100.00 100.00 100.00 100.00 79.05 100.00 100.00 Corn gluten meal (60 CP) 99.37 92.87 91.35 100.00 95.66 93.24 94.20 90.11 93.07 97.29 Cotton seed meal (28 CP) 75.35 88.79 89.99 98.65 90.79 83.56 85.30 71.93 88.06 87.94
Wheat bran 87.42 89.52 91.35 93.31 94.08 77.60 92.17 69.18 91.31 89.74
Soybean meal (48 CP) 84.41 86.63 87.30 79.10 84.39 83.81 81.61 77.28 77.80 85.33 Corn gluten meal (10 CP) 95.72 95.58 94.12 100.00 100.00 100.00 100.00 80.41 98.21 100.00
Soybean hulls 42.06 76.05 80.56 77.86 47.10 56.12 54.25 69.98 96.94 100.13
Corn 100.00 97.95 100.00 100.00 100.00 100.00 94.01 100.00 85.73 100.00
Canola meal 85.41 89.09 89.18 93.12 88.00 79.63 89.07 82.73 92.42 91.83
1 Lys = lysine, His = histidine, Arg = arginine, Thr = threonine, Val = valine, Met = methionine, Ile = isoleucine, Leu = leucine, Phe =
phenylalanine, Try = tryptophan.
Metabolizable energy N corrected can be estimated by one equation that considers the variables total dietary fiber, acid detergent fiber, mineral matter and the solubility in NaOH.
Total dietary fiber enters in the formulation of all the equations for the metabolizable energy estimation. In general, the crude fiber or the total dietary fiber enter in the amino acid digestibility prediction estimates. The amino acid and energy digestibilities estimates produced high determination coefficients, except for threonine and leucine.
Literature Cited
ARABA, M.; DALE, N.M. Evaluation of protein solubility as an indicator of overprocessing soybean meal. Poultry Science, v.69, p.76-83, 1990.
ALBINO, L.F.T.; ROSTAGNO, H.S.; TAFURI, M.L. et al. Determinação aparente e verdadeira de alguns alimentos para aves, usando diferentes métodos. Revista da Sociedade Brasileira de Zootecnia, v.21, n.6, p.1047-1958, 1992. ASSOCIATION OF OFFICIAL ANALYTICAL CHEMISTS
-AOAC. Pepsin digestibility of animal protein feeds. In: CUNNIFF, P. (Ed.) Official methods of analysis of AOAC International. 16.ed. 1995. p.15-16.
BELLAVER, C.; BRUM, P.A.R.; ZANOTTO, D.L. et al. Estimativas da energia metabolizável de farinhas de abatedouros de aves obtidas sob diferentes processamentos industriais. In: Conferência APINCO 2001, Campinas. Trabalhos de Pesquisa... Campinas: Fundação APINCO de Ciência e Tecnologia Avícolas, v.1., 2001. p.45.
2281
BELLAVER et al.
for AMEn and the ten amino acid, as function of different candidate variables
Variable Parameters estimates with errors for predicting variables Model R2 Avg. Maximal Prob. Adjust. Error Error
F% % % %
AMEn 3893.91±111.46 -25.95±5.7790TDF -10.613±8.2990ADF*** -159.045±24.5691MM . . 0.00 97.07 4.79 10.11 3767.69±140.41 -36.94±3.6580TDF 6.266±4.4280NDF** -137.951±22.2491MM . . 0.00 97.18 4.36 9.23 4317.15±272.20 -20.31±6.2130TDF -22.408±10.2900ADF* -143.238±85.5851EE** -186.776±27.6991MM . 0.00 97.61 4.17 8.07 3959.96±99.12 -15.87±6.8810TDF* -24.285±9.6150ADF -159.679±20.6891MM -5.776±2.7901NAOH* . 0.00 97.93 4.13 6.40 LYSc 146.53±19.07 -3.77±0.5650CF 1.553±0.3580ADF -0.205±0.0601CP -0.521±0.2301DPP02* . 0.00 95.70 2.75 7.69 88.28±7.04 0.49±0.1560TDF -3.002±0.4160CF 0.770±0.3790ADF* 4.561±1.9541EE* -0.158±0.0701KOH* 0.00 95.27 2.52 7.19 HISc 136.70±5.98 -2.19±0.1920CF 1.230±0.1380ADF 0.197±0.0440NDF -1.655±0.2431MM -0.011±0.0011CE 0.00 95.71 0.84 1.99 96.56±2.76 -1.79±0.2700CF 0.962±0.1960ADF 0.131±0.0660NDF* -0.708±0.3151MM* -0.188±0.0351CP 0.02 90.71 1.30 2.96 ARGc 100.24±1.84 -1.05±0.2750CF 0.508±0.2240ADF -0.218±0.0431CP . . 0.03 81.83 1.93 3.77 131.05±11.40 0.35±0.1310TDF -1.717±0.3230CF 0.617±0.2340ADF -1.924±0.4951MM -0.008±0.0021CE 0.12 83.15 1.44 3.90 179.85±18.42 -2.12±0.4480CF 1.109±0.2860ADF -1.383±0.4461MM -0.011±0.0021CE -0.406±0.1681DPP02* 0.15 81.61 1.65 3.67 THRc 97.30±9.78 0.41±0.2480TDF** -1.052±0.4880CF* 3.281±3.1321EE*** -0.224±0.1101KOH* . 5.17 40.12 4.11 11.52
104.65±6.89 0.64±0.3050TDF* -1.511±0.5350CF -1.477±1.2881MM*** -0.172±0.1151KOH** . 4.70 41.68 4.19 13.05 VALc 71.46±10.81 1.31±0.3900TDF -2.944±0.5990CF 8.862±4.3101EE* -0.451±0.1941NAOH* . 0.05 83.15 4.28 10.11 METc 102.37±6.36 0.68±0.2260TDF -2.196±0.4260CF -0.280±0.1001KOH . . 0.04 80.43 4.50 14.10 ILEc 102.12±5.95 0.66±0.2110TDF -2.174±0.3990CF -0.228±0.0931KOH . . 0.02 82.99 3.86 9.65
104.20±3.72 -2.14±0.5560CF 0.878±0.4530ADF* -0.284±0.0871CP . . 0.02 84.06 3.78 11.51 106.12±6.64 0.48±0.2500TDF* -1.926±0.4370CF -0.179±0.0991KOH** -0.131±0.1071CP*** . 0.05 83.97 3.55 9.65 LEUc 153.56±30.40 11.53±2.4341EE -0.024±0.0091CE -0.358±0.0881KOH 0.740±0.1981CP . 0.36 71.49 2.86 6.72 PHEc 91.46±4.40 0.22±0.0650TDF -0.219±0.0810NDF 8.466±1.2661EE 1.326±0.4731MM -0.371±0.0511KOH 0.05 86.96 1.67 2.81 TRYc 159.84±16.17 -0.07±0.0410TDF** 2.100±1.3451EE** -0.013±0.0051CE 0.124±0.1101CP**** -0.427±0.0601DPP0002 0.02 90.25 1.11 2.86 159.42±16.21 -0.08±0.0440NDF ** 2.542±1.2021EE * -0.013±0.0051CE 0.142±0.1061CP*** -0.437±0.0601DPP0002 0.02 90.20 1.19 2.48
BELLAVER, C.; EASTER, R.A.; PARSONS, C.M. et al. Prediction equations for protein and amino acid digestibility in meat and bone meals. In: INTERNATIONAL SYMPOSIUM ON DIGESTIVE PHYSIOLOGY IN PIGS, 1997, Saint Malo. p.426-429. 1997.
BELLAVER, C.; ZANOTTO, D.L.; GUIDONI, A.L. et al. In vitro solubility of meat and bone meal protein with different pepsin concentrations. Ciência Rural, v.30, n.3, p.489-492, 2000. BOISEN, S.; FERNANDEZ, J.A. Prediction of apparent ileal
digestibility of protein and amino acids in feedstuffs and feed mixtures for pigs by in vitro analysis. Animal Feed Science and Technology, v.51, p.29-43, 1995.
BOISEN, S.; FERNANDEZ, J.A. Prediction of the total tract digestibility of energy in feedstuffs and pigs diets by in vitro analysis. Animal Feed Science and Technology, v.68, p.277-286, 1997.
Brazilian Compendium of Animal Feeding. São Paulo: SINDIRAÇÕES/ANFAR, Campinas: CBNA/SRD/MA, 1998. 371p.
CAVE, N.A. Bioavailability of amino acids in plant feedstuffs determined by in vitro digestion, chick growth assay and tre amino acid availability methods. Poultry Science, v.67, n.1, p.78-87, 1988.
CONE, J.W. The influence of pH on in vitro protein solubility and enzymatic hydrolisis of protein in feedstuffs. Journal of Animal Feed Science, v.2, n.1-2, p.67-72, 1993.
HILL, F.W.; ANDERSON, D.L. Comparison of metabolizable energy and productive energy determination with growing chicks. Journal Nutrition, v.64, p.587-603, 1958.
JOHNSON, R.J. Principles, problems and application of amino acid digestibility in poultry. World´s Poultry Science Journal, v.48, p.232-246, 1992.
JOHNSTON, J.; COON, C. N., The use of varying levels of pepsin for pepsin digestion studies with animal proteins. Poultry Science, v.58, p.1271-1273, 1979.
PARSONS, C.M. Amino acid availability in feedstuffs for poultry and swine. In: BAKER, D.H., PARSONS, C.M. (Eds.) Recent advances in amino acid nutrition. Tokyo: Ajinomoto Co., 1985a. p.35-47.
PARSONS, C.M. Influence of caececotomy on the digestibility of amino acids by roosters fed distillers’ dried grains with solubles.
Journal of Agricultural Science, v.104, p.469-472, 1985b. PARSONS, C.M.; CASTANON, F.; HAN, Y. Protein and amino
acid quality of meat and bone meal. Poultry Science, v.76, p.361-368, 1997.
POMERANZ, Y.; LINDNER, C. A simple method for evaluation of heat treatment of soybean meal. Journal of the American Oil Chemistry Society, v.37, p.124-126, 1960.
PROSKY, L.; ASP, N.G.; SCHWEIZER, T.F. et al Determination of insoluble and soluble dietary fiber in foods and food byproducts: Collaborative study. Jorunal of AOAC International, v.75, n.2, p.360-367, 1992.
STATISTICAL ANALYSES SYSTEM - SAS. System for Microsoft Windows, Release 8.2, Cary: 2001. CD ROM. SIBBALD, I.R. A bioassay for available amino acids and true
metabolizable energy in feedingstuffs. Poultry Science, v.58, p.668-673, 1979.