Development of Poly (butylene adipate-co-terephthalate) Filled with
Montmorillonite-Polypyrrole for Pressure Sensor Applications
Bruna dos Santos Rosaa, Claudia Merlinia,b, Sébastien Livic, Guilherme Mariz de Oliveira Barraa*
Received: July 31, 2018; Revised: October 22, 2018; Accepted: November 29, 2018
A novel pressure sensing material composed of poly (butylene adipate-co-terephthalate) (PBAT) and montmorillonite-polypyrrole (Mt-PPy) was prepared using melt mixing and injection molding. The structure and properties of the PBAT/Mt-PPy composites were evaluated and compared with those of the PBAT/PPy blends. The PBAT/Mt-PPy displays a very sharp insulator-conductor transition and its percolation threshold was reached at 6.5 wt% of Mt-PPy, which was lower than that for PBAT/ PPy (11.0 wt% of PPy). The transmission electron microscopy analysis shows that Mt-PPy displays a high aspect ratio and was better distributed and dispersed into PBAT compared to PPy. PBAT/Mt-PPy exhibits a decrease in the electrical resistivity with an applied compressive stress due to the formation of new conducting pathways. The electromechanical response was dependent on Mt-PPy and the maximum sensitivity was observed for the composite containing 10 wt% of Mt-PPy. In this system, the electrical resistivity drops from 9 x 10⁶ to 2 x 10⁶ Ω cm when a compressive stress of 0.25 MPa
was applied. The electrical resistivity changes with applied compressive stress, the reproducibility and the reversibility makes PBAT/Mt-PPy a suitable material for the development of pressure sensors.
Keywords: Polypyrrole, Montmorillonite, Electrical conductivity, Pressure sensor.
*e-mail: [email protected]
1. Introduction
In recent years, the development of electrically conducting polymer composites (ECPC) for pressure sensor applications
has increased significantly. This increase is due to their flexibility, low cost, easy to manufacture and the electrical
conductivity can be changed by applying a compressive force 1-9. These materials are composed of an insulating polymer
matrix and a dispersed phase of intrinsically conducting polymer (ICP) 10-14, such as polypyrrole (PPy) or polyaniline
(PAni), or carbonaceous fillers, such as carbon black 15-17
and graphite 18. Among available conducting fillers, several
works in the literature have reported the use of conducting polymers, especially PPy, for sensing applications1,5,8,9,19-28.
Merlini et al. described the development of poly(vinylidene
fluoride) (PVDF) / polypyrrole (PPy) blends, and the
maximum sensitivity was obtained for a blend with 9 wt% PPy. The electrical resistivity of this blend dropped by two orders of magnitude, e.g. from 108 to 106 Ω cm 24. Souza,
Michel and Soares reported that the electrical resistivity of poly(styrene-butadiene-styrene)/polyaniline blends drops one order of magnitude when a compressive stress from 0 to 4 MPa is applied 11. The changes of the electrical conductivity
in ECPC are explained by the percolation theory 10. Under
compressive stress, the conductive particles come into a closer contact forming a new conducting network. On the other
hand, by releasing the compression stress, the conducting network is disrupted, and the electrical conductivity returns to the initial value to that without pressure 24. The electrical
sensitivity and reproducibility of the response of these composites depend on various factors including the structure and properties of the dispersed phase (such as, intrinsically electrical conductivity, aspect ratio and surface area), the properties of the matrix, ICP content, interaction of both polymer phases and dispersion of the ICP into the insulating polymer matrix. The main challenge in the development conductive polymer composites based on ICPs is to reach
an adequate pressure sensitivity at low conducting filler
concentration in order to minimize processing problems and a reduction of the mechanical properties. In general,
when PPy is used as a filler to develop pressure-sensitive composites, large amounts are required to reach significant
increases in the electrical conductivity, and there are
difficulties to disperse the filler. An appropriate strategy
that has been proposed is the development of conducting
composites composed of a nanostructured filler, such as
montmorillonite/polypyrrole (Mt-PPy) or montmorillonite/ polyaniline (Mt-PAni), dispersed in an insulating polymer
matrix. This nanostructured conductive filler can be obtained
through chemical in situ polymerization of pyrrole (Py) in the presence of Mt suspension. The montmorillonite can be exfoliated by the Py and then the polymerization that occurs
in the Mt layers results in a conductive filler with a layered
aDepartamento de Engenharia Mecânica, Universidade Federal de Santa Catarina, Florianópolis, SC,
Brasil
bDepartamento de Engenharia, Universidade Federal de Santa Catarina, Blumenau, SC, Brasil
lamellar structure, with a high aspect ratio and surface area, compared to the neat PPy, which allows a strong interaction with the insulating polymer. According to Ramoa et al.29
and Boukerma et al.30, the exfoliation of Mt-PPy promotes
conductive pathways into the insulating polymer matrix with a lower Mt-PPy content than that observed for conducting
polymer blends containing neat PPy as the conductive filler.
In addition, interesting results concerning the preparation of conducting polymer composites with Mt-PPy and an insulating
polymer matrix have also been reported by Moučka et al.31
and Peighambardoust and Pourabbas32.
The manufacturing method and test conditions also influence the electrical properties of the conducting polymer composites. Often these materials are developed by incorporating ICP into an insulating polymer matrix, such as thermoplastic polymers or rubbers through in situ
pyrrole or aniline oxidative polymerization 5,33-34, solution
casting 12,23 or the melt mixing method 3. Alternatively,
the electrospinning technique can be also used in order to
produce highly pressure-sensitivity fibrous membranes 9,36.
Among these, the melt mixing method offers the advantages
of large-scale production and reduced costs. However, studies in the literature have demonstrated that ECPC with the same chemical composition prepared through solution casting showed higher pressure sensitivity than that produced by melt mixing 12,36-38. This behavior can be attributed to
the degradation of the conducting polymer due to the high
melting process temperature and the difficulty to disperse
the conductive phase in the insulating polymer matrix. In this context, poly(butylene adipate-co-terephthalate)
(PBAT), which is a flexible aliphatic-aromatic copolyester, is an interesting insulating polymer matrix to produce flexible
conductive Mt-PPy nanocomposites with high electrical conductivity with a low percolation threshold. PBAT is among the most versatile thermoplastics since it has a low processing temperature (160 ºC), and therefore does not reach the degradation temperature of PPy during the melt
mixing method, low modulus, stiffness, high flexibility and
toughness. Moreover, the ester groups of PBAT can interact with the -NH groups of PPy leading to better distribution
and dispersion of the conductive filler into polymer matrix. Furthermore, due to the efforts of academic and industrial
researchers to develop ecofriendly material, PBAT is an excellent candidate to develop pressure-sensitive composites due to its biodegradability and natural origin 39.
Based on the above, the aim of this work is to investigate PBAT/Mt-PPy composites produced using a twin screw extruder followed by injection molding. Particular attention is focused on producing sensitive composites with low
filler content. For comparative purposes, neat polypyrrole
(PPy) was added separately in the PBAT under the same processing conditions. To the best of our knowledge, there are no studies dealing with the production of composites
based on biodegradable PBAT with Mt-PPy using the melt mixing method for pressure sensor applications.
2. Experimental
2.1 Materials
Sodium bentonite (Vulgel CN 45 (Aliança Latina Indústrias e Comércio Ltda, Uruguaiana, Rio Grande do Sul, Brazil))
was kindly supplied by Ioto International (Brazil). Pyrrole,
Py, 98%, (Aldrich, Germany) was purified by distillation
under reduced pressure and stored in a refrigerator before
use. Iron (III) chloride hexahydrate, FeCl3.6H2O, analytical
grade (Vetec, Duque de Caxias, Rio de Janeiro, Brazil), and the surfactant dodecylbenzenesulfonic acid, DBSA, (Aldrich,
Italy) was used as received. Commercially available PBAT (PBE 006, extrusion grade, density 1.26 g.cm-1), a 100%
biodegradable and compostable biopolyester thermoplastic,
was purchased from Natureplast (France).
2.2 Synthesis of conducting nanocomposites
(Mt-PPy)
The preparation procedure of nanostructured conductive
filler Mt-PPy with the surfactant DBSA was based on the
method described by Ramoa et al.29 2.5 g of Mt was dispersed
into 250 mL of water, containing the DBSA, and stirred for 2h
at room temperature. The dispersion was sonicated with 35%
power (263 W) for 20 min using a Sonics VCX 750 ultrasonic
processor (Sonics & Materials, Inc., USA). The molar ratio of the surfactant/pyrrole (Py) used in the polymerization was
1/5. Then FeCl3·6H2O (0.2542 mol) dissolved in 125 mL
of distilled water was added to the aqueous Mt dispersion
under stirring at room temperature. After which, 50 mL of a 0.26 mol·L-1 aqueous dispersion of Py (0.1105 mol) was
added drop-wise over a 15 min period. The polymerization was carried out for 1 h under stirring at room temperature.
After 24 h, the conductive filler (Mt-PPy) was filtered washed
with distilled water and dried at 60 ºC. The same procedure was used to prepare neat polypyrrole (PPy).
2.3 Preparation of PBAT/Mt-PPy composites
Composites based on PBAT/Mt-PPy and PBAT/PPy
were prepared using a 15g-capacity DSM microextruder
(Midi 2000 Heerlen, Holland) with co-rotating screws. The mixture was sheared under nitrogen atmosphere for 3 min with 100 rpm speed at 160 ºC and then injected in a mold at 40 ºC to obtain discs with 40 mm diameter, according to
the method described by Livi et al. 40.
3. Characterization
The electrical conductivity of the conductive fillers, PPy
standard method using a Keithley 6220 (USA) current source to apply the current and a Keithley Model 6517A (USA)
electrometer to measure the potential difference. For pure
PBAT and high-resistivity composites the measurements were made using a Keithley 6517A (USA) electrometer connected
to a Keithley 8009 (USA) test fixture. Five measurements
were taken for each sample at room temperature.
Transmission electron microscopy (TEM) was carried out at the Technical Center of Microstructures (University of
Lyon) on a Philips CM 120 (Germany) microscope operating at 120 kV. The samples were cut using a Leica Ultracut UCT ultramicrotome (Leica, Germany) equipped with a diamond
knife to obtain 60 nm thick ultrathin sections and deposited on a 200 mesh copper grid for subsequent observations.
Attenuated Total Reflectance-Fourier Transform Infrared spectroscopy (ATR-FTIR) was performed with a Bruker
(USA) spectrometer model Tensor 27, in the range of 2000 to 600 cm-1 by accumulation of 32 scans at 4 cm-1 resolution.
The X-ray diffraction (XRD) patterns of all samples were obtained on a Phillips X’PERT (Philips, Germany) X-ray diffractometer with CuK (λ= 0,154 nm) radiation source operating at a voltage of 40 kV and a 30 mA current. The samples were evaluated on a 2θº range from 2 to 50º at
steps of 0.05º and time step of 1 s. The Mt, PPy and Mt-PPy samples were analyzed in powder form while neat PBAT, PBAT/Mt-PPy composites and PBAT/PPy blends were analyzed in the form of discs.
Dynamic mechanical properties were measured by a dynamic mechanical analyzer (DMA 242 E Artemis, Germany) under tensile mode on rectangular specimens
with a width of 5 mm and a length of 12 mm. The analyses were performed at a frequency of 1 Hz, and amplitude of 50 µm using a 3 ºC min-1 temperature ramp from -80 to 70 ºC.
Thermogravimetric analysis (TG) was carried out using a STA 449 F1 Jupiter® (Netzch, Germany) thermogravimetric
analyzer. The analyses were performed for the conductive additives Mt-PPy and PPy, PBAT/Mt-PPy and PBAT/PPy at 10 ºC min-1 from 30 ºC to 650 ºC under air atmosphere
with a flow rate of 50 mL min-1.
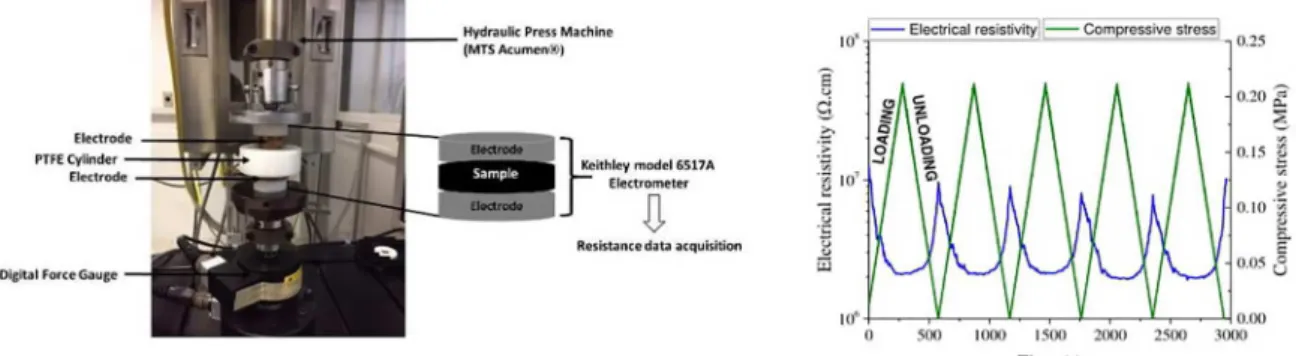
The electromechanical tests were performed according to the methodology reported by Merlini et al. 8. To evaluate
the electrical-mechanical response of PBAT/Mt-PPy and
PBAT/PPy composites the setup used consisted in a universal testing machine MTS Acumen (USA) with a 0.5 kN load cell to apply a controlled stress and an electrometer (Keithley 6517A)(USA) to acquire the resistivity data, using software
developed exclusively for this purpose (Figure 1). The
sample with a diameter of 22.5 mm was placed between
two electrodes which were confined in a cylinder made of poly(tetrafluoethylene) (PTFE) in order to electrically
isolate the samples. The device was then placed between the testing plates of the universal testing machine. The electrodes were connected to the electrometer for measuring the volume resistivity of the composites during loading and unloading. The samples were loaded up to 0.25 MPa at a loading rate of 0.00018 MPa/s, the compressive stress was
then released at the same rate (Figure 1). For each sample,
loading-unloading sequences of 5 and 25 cycles were
performed on different specimens. The electrical resistivity (ρ) values (in Ω cm) were calculated using Eq.1, where R
is the measured resistance (Ω), d is the sample diameter (cm) and w is the specimen thickness (cm). The curves of electrical resistivity and compressive stress were plotted as
a function of time (Figure 1).
(1)
4. Results and Discussion
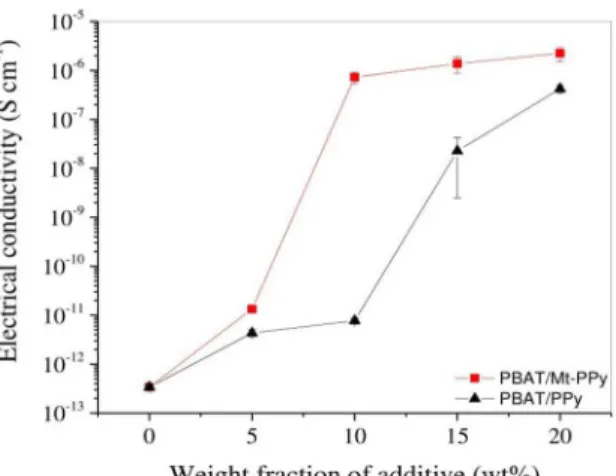
Figure 2 shows the curves of the electrical conductivity of PBAT/Mt-PPy and PBAT/PPy as a function of the filler
content. PBAT/Mt-PPy composites show a very sharp insulator-conductor transition and the electrical conductivity
enhanced significantly as the Mt-PPy content increased due
to the formation of a conductive network in the insulating polymer, reaching a maximum value of 10-6 S cm-1. On
the other hand, for the PBAT/PPy blends the increase in electrical conductivity as a function of the PPy content is less pronounced. The composite containing 10 wt% of Mt-PPy shows an electrical conductivity of 1.3 x 10⁻⁶ S cm-1,
which was higher compared to the PBAT/PPy blend (4.3 x 10⁻¹² S cm-1) for the same amount of conductive filler.
. .
w
R d
4
2
t
=
r
The percolation threshold (fp) and critical exponent (t) of both polymer systems were calculated according to the model proposed by Kirkpatrick 41. The f
p and t parameters of
PBAT/Mt-PPy were ~6.5 wt% and 2.7, respectively, while
Figure 2. Effect of the conducting filler contents (Mt-PPy and PPy)
on electrical conductivity.
Figure 3. TEM micrographs of PBAT/Mt-PPy composites and PBAT/PPy blends filled with 5 wt% or 20 wt% of additive.
those parameters for PBAT/PPy were ~11 wt% and 2.5. A critical exponent in the range from 2 to 4 is in agreement with the classical theory for tridimensional systems.
The electrical conductivity of the filler Mt-PPy and PPy
are similar 7.2 ± 4.4 S cm-1 and 6.2 ± 5.0 S.cm-1, respectively.
Thus, the intrinsic conductivity of the fillers is not a factor that significantly influences the final electrical conductivity
of the composites. The lower percolation threshold and higher electrical conductivity of PBAT/Mt-PPy composites may be associated to the layered structure of the Mt-PPy. This layered morphology results in a higher aspect ratio and surface area (3.52 m2 g-1) 42 than found for the spherical
particles of PPy (2.06 m2 g-1) 42, and consequently increases
the interaction of Mt-PPy with the PBAT matrix and thus improves its ability to form a conductive network in the matrix. Similar results have been reported by Ramoa et al. 35 for thermoplastic polyurethane (TPU) filled with
Mt-PPy and Mt-PPy. Also, Contri et al. 43 and Vargas et al. 41 have
Figure 3 illustrates the TEM micrographs from which it is possible to evaluate the influence of the conductive filler
on the microstructure of the composites. The PBAT/Mt-PPy nanocomposite micrographs show that the layered conductive
fillers are better dispersed and distributed in the PBAT matrix
compared to the PBAT/PPy blends. Moreover, the layered
Mt-PPy fillers display an intercalated/partially exfoliated
structure that facilitates the contact between the particles, allowing the formation of a conductive network throughout the matrix. On the other hand, the microstructure of the PBAT/PPy blends revealed a phase separated morphology with the presence of PPy agglomerates into PBAT matrix.
The difference in the microstructure and aspect ratio of the fillers indicates that Mt-PPy was able to induce a conductive network formation with a low content of conductive filler in
the PBAT matrix, and consequently, increases the electrical
conductivity of the nanocomposites more significantly. Figure 4 presents the XRD diffractogram of Mt, conductive fillers and nanocomposites. The (001) reflection and d-value for neat Mt were 6.11° (2θ) corresponding to
an interlayer distance of 1.44 nm while for Mt-PPy were 2.12o (2θ) which corresponds to a basal spacing of 4.17 nm,
respectively. The shift of the peak to lower angles in the XRD
and higher d-value for Mt-PPy can be attributed to the PPy chain intercalation between the Mt layers 30,44-45. Moreover,
the low-intensity reflection at 6.11° for the Mt-PPy filler
suggests that most of the Mt layers were exfoliated 44-46 during
in situ polymerization. On the other hand, PPy shows (001)
reflection at 2.78o (2θ) and d-value of 3.20 nm. The X-ray
diffraction pattern of PBAT is characterized by 4 peaks at
16.11°, 17.45°, 20.21°, 23.19° which are related to the basal
reflection (011), (010), (111) and (100), respectively, indicating
a crystalline structure of PBAT 47. All composites showed
a lower peak intensity than those observed for neat PBAT. Interestingly, the peak at 6.11º belonging to Mt, disappears
Figure 4. X-ray diffraction spectra of Mt, conductive additives
(PPy and Mt-PPy) and PBAT composites with 15 wt% of Mt-PPy and 15 wt% of PPy.
in the PBAT/Mt-PPy composite, which suggests that the Mt layers were partially exfoliated in the PBAT matrix 48-50.
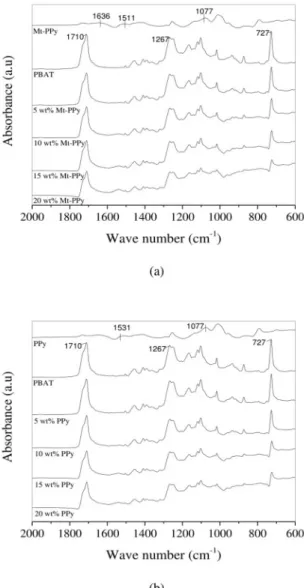
The FTIR spectra of the Mt-PPy, PPy, PBAT and PBAT/
Mt-PPy composites and PBAT/PPy blends from 2000 to 600 cm-1are shown in Fig. 5 (a) and (b). Ramoa et al. gave a
detailed study of the FTIR spectra of the fillers 29. The PBAT
spectrum exhibits absorption bands at 1710 cm-1, which are
assigned to the carbonyl groups in the ester linkage, while bands at 1263 cm-1 correspond to the C-O in the ester linkage
and 726 cm-1 represents four or more adjacent methylene
(-CH2-) groups 50-52.The spectra of PBAT/Mt-PPy and PBAT/
PPy exhibited overlapped absorption bands of PPy and PBAT. An in-depth analysis of the infrared spectra in the range from 1780 to 1680 cm-1 for PBAT and its composites was
carried out. The absorption bands centered at 1730 and 1710 cm-1 are attributed to the free and site-specific interactions
of the carbonyl group, respectively. The interaction between PBAT and PPy can be determined from the ratio between
free carbonyl absorption bands indicates that a site-specific interaction between N-H and C=O functional groups is
operative in both polymer systems 35.
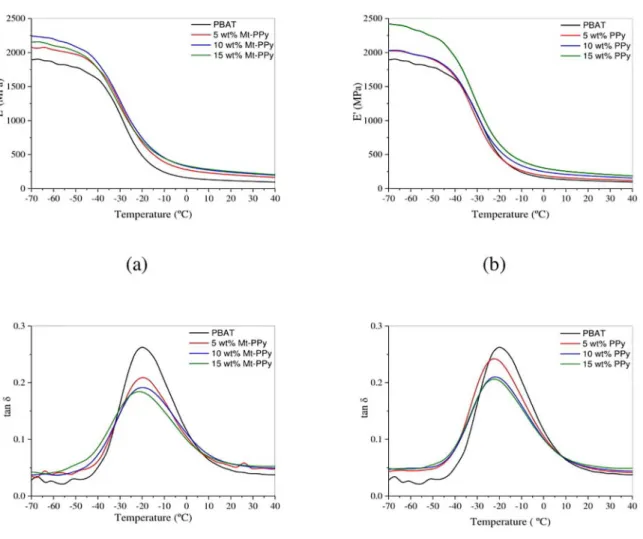
Figure 6 (a, b) shows the variation in the storage modulus (E’) and loss tangent (tan δ) as a function of temperature for
neat PBAT, PBAT/Mt-PPy and PBAT/PPy. Over the entire
temperature range, E’ values of both polymer systems, PBAT/
Mt-PPy and PBAT/PPy, are higher compared to neat PBAT,
which is due to the reinforcement effect of the conductive fillers. Moreover, the chemical interaction between the conductive fillers and PBAT also contribute to an increase of
the mechanical properties. In addition, the storage modulus
of the composites increases when the filler content increases.
A sudden fall in the storage modulus is observed for neat PBAT at -20 oC, which corresponds to the glass-rubber
transition of the PBAT. This transition can also be related to
the peak of tan δ, as shown in the Fig.8(c) and (d). The peak
intensity, which corresponds to the relaxation temperature (Tα), related to the glass transition temperature of PBAT
reduces as the amount of conductive filler increases. These
variations in the magnitude of the loss tangent are related to the incorporation of Mt-PPy or PPy, which reduces the
Table 1. Area of the peaks and ratio of the area under the peaks of
the C=O groups (hydrogen bonded C=O (A1710) and free C=O (A1730)).
Sample A1(1730) A2(1710) I1710/1730
PBAT 3.64 13.11 3.60
5 wt% Mt-PPy 2.49 13.76 5.52
10 wt% Mt-PPy 1.53 15.24 9.96
15 wt% Mt-PPy 1.20 15.75 13.12
20 wt% Mt-PPy 0.80 14.17 17.71
5 wt% PPy 2.99 14.95 5.00
10 wt% PPy 2.40 14.03 5.84
15 wt% PPy 1.01 14.88 14.73
20 wt % PPy 0.88 14.61 16.60
Figure 6. Storage modulus (a,b) and loss tangent (c,d) of neat PBAT, PBAT/Mt-PPy and PBAT/PPy.
the peak areas of the absorption bands at 1710 (H-C=O) and 1730 (free C=O) (I1710/I1730)
5. Table 1 shows the area under
the peak related to the C=O groups (hydrogen bonded C=O
flexibility of the PBAT 53. Moreover, the decrease in the
peak intensity of the loss tangent is higher for
PBAT/Mt-PPy because the incorporation of Mt increases the stiffness
of the composites.
The TG curves of Mt, Mt-PPy, PPy, PBAT, PBAT/Mt-PPy and PBAT/PBAT/Mt-PPy are shown in Figure 7. The MMt display
Figure 7. TG curves of (a) PBAT/Mt-PPy and (b) of PBAT/PPy.
Table 2. Initial weight loss temperature (Tonset)) and maximum degradation temperature (T1max. and T2 max.) of neat PBAT and PBAT/ Mt-PPy and PBAT/PPy.
Sample Tonset(°C) T1 max.(°C) T2 max.(°C)
PBAT 383.7 408.5 530.2
5 wt% PPy 377.8 404.0 518.8
10 wt% PPy 365.1 399.0 483.3
15 wt% PPy 360.8 394.6 482.0
5 wt% Mt-PPy 366.3 398.2 481.5
10 wt% Mt-PPy 371.2 399.3 460.0
15 wt% Mt-PPy 367.3 396.4 461.5
thermal stability until 600 ºC. PPy and Mt-PPy present a small weight loss below 100 ºC due to the elimination of water and a weight loss starting from 317.9 ºC and 321.7 ºC respectively, which corresponds to the degradation of the polymer chain. At 650 °C, the thermal decomposition of PPy is completed. On the other hand, the Mt-PPy sample displays a residual mass that can be related to the Mt that is thermally stable at this temperature.
PBAT shows a main weight loss starting at 383.7 ºC which is attributed to the decomposition of the polymer
chain. The derivate thermogram (DTG) (Table 2) clearly
shows that PBAT/Mt-PPy and PBAT/PPy have two weight
loss steps. The first step is related to the polymer chain
decomposition of both components and the extra derivate peak is observed around 500 ºC, which corresponds to the oxidation of char residue under an atmosphere of air 54. All
the composites start to decompose at lower temperatures than neat PBAT as shown in Table 2. This behavior can be related to the presence of the PPy, which presents lower thermal stability 55.
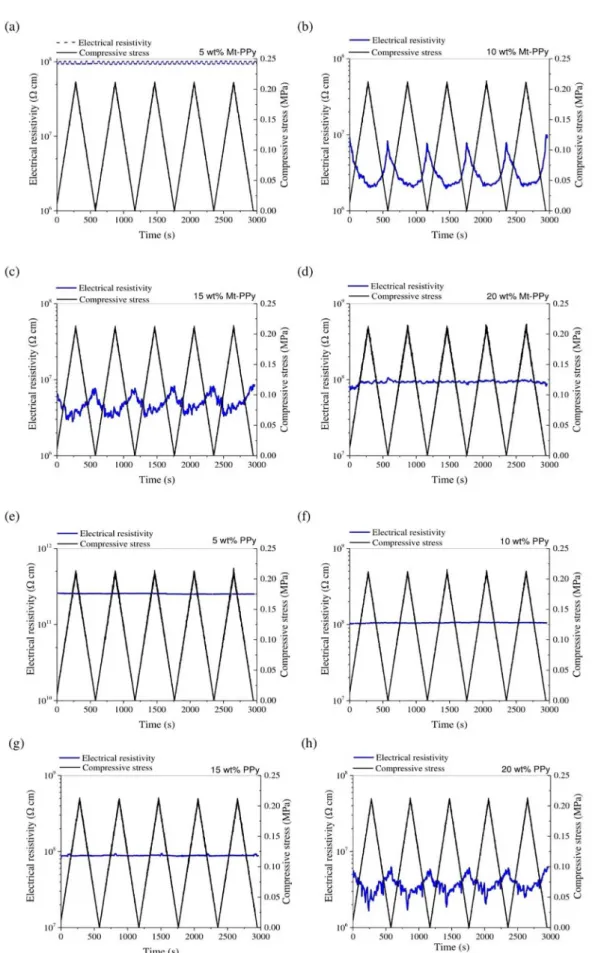
Figures 8 a-h show the variation of the electrical
resistivity of PBAT/Mt-PPy and PBAT/PPy composites that have been submitted to 5 consecutive compressive loading-unloading stress cycles, until a compressive stress
of 0.25 MPa. Compressive stress has an influence on the
electrical resistivity of PBAT/Mt-PPy composites due to the presence of conductive Mt-PPy. This behavior can be explained by the fact that when the system is submitted to a compressive stress, the contact between the Mt-PPy particles improves and forms new conducting pathways, resulting in a reduction in the electrical resistivity of the composite 8. When a composite with 5 wt% Mt-PPy is
submitted to a compressive stress, the contact between the
conductive fillers is not enough to form new conductive
pathways, therefore there is no variation in the electrical resistivity of the sample. On the other hand, a compressive
stress has a remarkable effect on the electrical resistivity of
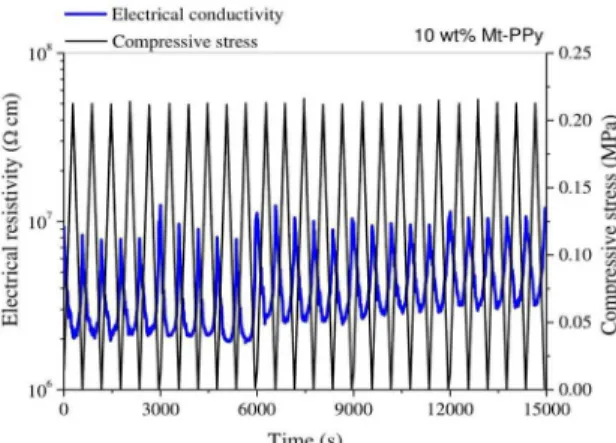
a composite with 10 wt% Mt-PPy. This composite displays a better electromechanical response under compressive stress. When the system is subjected to a compressive stress (loading cycle), the resistivity value decreases by one order of magnitude as the pressure increases. Moreover, when the applied stress is removed, the resistivity returns to near initial value. This behavior indicates that new conductive pathways are created on applying a compressive stress and a reversible reorganization of Mt-PPy particles occurs in the PBAT matrix. This system presents a reproducible response after 25 consecutive compressive loading-unloading stress
cycles (Figure 9). For the composite with 15 wt% Mt-PPy
the change in resistivity is less pronounced, and when the compressive stress is applied the electrical resistivity decreases from 8 x 10⁶ to 3 x 10⁶ Ω cm. However, when
other samples. It is possible to note that this composite does
not display a significant change of the electrical resistivity
when the compressive stress is applied. This behavior can be attributed to the large amount of conductive additive of Mt-PPy in the PBAT matrix, which already forms a conducting network, even without a compression stress, as observed in TEM micrographs. It suggests that the Mt-PPy particles are
too close to each other to be influenced by the compressive
stress applied 8.The eletromechanical tests was performed on
the all the PBAT/PPy blend samples; however the response
was completely different in the PBAT/PPy blends with 5,
Figure 9. Electrical resistivity as a function of 25 compressive
loading-unloading stress cycles on PBAT/Mt- PPy, filled with
10 wt% of Mt-PPy.
Table 3. Electroactive materials used in pressure sensors.
Sample Compressive
stress range Wt% Response Method
PBAT/Mt-PPy* 0-0.25 MPa 10 wt% 2.6 times
(1.25x10-7 to 3x10⁻⁷ S cm-1) Melt mixing
Silicon/Carbon
nanoparticles16 0-1.2 MPa 35 wt%
1000 times
(10-5 to 10-2 S cm-1) Solution casting
Natural rubber/Carbon
black15 0-2.4 MPa 10 wt%
2.8 times
(2.5x10-8 to 7 x 10⁻⁸S cm-1) Solution casting
Natural rubber/Carbon
black56 0-2.4 MPa 20 wt%
4 times
(1 to 4 S cm-1) Solution casting
Poly(styrene-butadiene-styrene)/PAni11 0-4 MPa 30 wt%
10 times
(10-7 to 10-6 S cm-1) Melt mixing
SEBS/PANi12 0-300 MPa 30 wt%
Solution 15 times (0.8x10-5 to 1.2 x 10⁻⁴ S cm-1)
In situ 12 times (0.75 x 10-4 to 9 x 10⁻⁴ S cm-1)
Solution casting/ In situ
SEBS/PPy23 0-10 MPa 25 wt% 36 times
(10-4 to 3.6 x 10⁻³S cm-1) Solution casting
Silicon rubber/PPy38 ε up to 15% 8,5 v% 100000 times
(10-10 to 10-5 S cm-1) Solution casting PVC/Graphite/Nickel
nanoparticles57 0-50 MPa 20 wt%
5 times
(2x10-6 to 10-5 S cm-1) Melt mixing
Silicon rubber/Carbon
nanotubes58 0-2 MPa 14 wt%
4 times
(resistance from 800 to 200 kΩ) Solution casting
PVDF/PPy8 0-10 MPa 50 wt% 40 times (5x10-1 to 20 S cm-1) In situ
*The results of this work.
10 and 15 wt% of filler compared with the Mt-PPy samples,
there was a very small variation in the electrical resistivity under compressive stress and the response was not linear and was irreversible. However, the electrical resistivity of the
PBAT/PPy blend with 20 wt% PPy was influenced slightly
by the loading and displayed a nonlinear response. The electromechanical response of the PBAT/Mt-PPy composites was superior to that of the composite with neat PPy due to the higher aspect ratio of the conductive additive that facilitates the contact between the particles under loading. Among the studied compositions, the composite with 10 wt% of Mt-PPy presented the highest sensitivity (2.5 MPa-1). The
sensitivity of this composite prepared in this study was quite similar to the values found for the polymer system with 30 wt% of conductive contents prepared by Muller et al. 23, Souza Jr., Michel and Soares11 and Barra et al. 12. It is
important to note that the compressive stress range applied
in this work (0.25 MPa) is significantly lower than those
reported in literature (from 0 to 10 MPa) 8,15-16,23-24, as shown
in Table 3. On the other hand, the sensitivity of PBAT/Mt-PPy is lower when compared to porous materials studied by
Xue et al. 28 and Wu et al. 17. The great advantages of this c
are its low cost, good sensitivity, signal reproducibility and the biodegradability of PBAT.
A pressure sensitivity material based on PBAT/Mt-PPy was successfully prepared by melt mixing with a microextruder and then injection molding. The structure and properties of
these materials are significantly influenced by the composition of the conductive filler (Mt-PPy and PPy) incorporated in
the PBAT. The PBAT/Mt-PPy composite exhibits a higher electrical conductivity and lower percolation threshold than the PBAT/PPy blend due to the layered morphology of the
filler that displays a high aspect ratio and surface area, which
improves the formation of conductive paths. Moreover, the intercalated/partially exfoliated structure results in better dispersion of the Mt-PPy in the matrix, which also contributes to increase the conductivity of the composite. The electromechanical response is dependent on the amount and
type of conductive filler in the insulating polymer matrix.
Under a compressive stress, among the studied compositions, PBAT containing 10 wt% of Mt-PPy, showed the highest sensitivity, with a variation of electrical resistivity of about one order of magnitude, when a compressive stress of
0.25 MPa was applied. For this composite, the electrical
resistivity response is highly reproducible after 25 repeated loading-unloading cycles, which makes this composition a promising material for the development of pressure sensors.
6. Acknowledgements
The authors gratefully acknowledge the financial support from Conselho Nacional de Desenvolvimento Científico e Tecnológico - CNPq, Coordenação de Aperfeiçoamento de Pessoal de Ensino Superior- CAPES, and Fundação de Amparo à Pesquisa e Inovação do Estado de Santa Catarina - FAPESC. Also we thank the Central Electronic Microscopy Laboratory, Santa Catarina Federal University (LCME-UFSC)
for the use of the SEM microscope.
7. References
1. Luo C, Liu N, Zhang H, Liu W, Yue Y, Wang S, et al. A new approach
for ultrahigh-performance piezoresistive sensor based on wrinkled
PPy film with electrospun PVA nanowires as spacer. Nano Energy. 2017;41:527-534.
2. Lin MF, Xiong J, Wang J, Parida K, Lee PS. Core-shell nanofiber
mats for tactile pressure sensor and nanogenerator applications.
Nano Energy. 2018;44:248-255.
3. Gonçalves V, Brandão L, Mendes A. Development of porous polymer
pressure sensors incorporating graphene platelets. Polymer Testing. 2014;37:127-137.
4. Niu D, Jiang W, Ye G, Wang K, Yin L, Shi Y, et al. Graphene-elastomer nanocomposites based flexible piezoresistive sensors for strain and
pressure detection. Materials Research Bulletin. 2018;102:92-99.
5. Luo M, Li M, Li Y, Chang K, Liu K, Liu Q, et al. In-situ polymerization
of PPy/cellulose composite sponge with high elasticity and conductivity for the application of pressure sensor. Composites Communications. 2017;6:68-72.
6. Teixeira J, Horta-Romarís L, Abad MJ, Costa P,
Lanceros-Méndez S. Piezoresistive response of extruded polyaniline/ (styrene-butadiene-styrene) polymer blends for force and deformation sensors. Materials & Design. 2018;141:1-8.
7. Pan L, Chortos A, Yu G, Wang Y, Isaacson S, Allen R, et
al. An ultra-sensitive resistive pressure sensor based on hollow-sphere microstructure induced elasticity in conducting
polymer film. Nature Communications. 2014;5:3002-3009.
8. Merlini C, Almeida RS, D'Ávila MA, Schreiner WH, Barra GMO. Development of a novel pressure sensing material
based on polypyrrole-coated electrospun poly (vinylidene
fluoride) fibers. Materials Science and Engineering: B. 2014;179:52-59.
9. Merlini C, Barra GMO, Araujo TM, Pegoretti A. Electrically pressure sensitive poly(vinylidene fluoride)/polypyrrole
electrospun mats. RSC Advances. 2014;4(30):15749-15758.
10. Radhakrishnan S, Kar SB. Role of non-linear processes in conducting polymer blends for piezo-sensors: Part 2: Studies on polyaniline/SBS blends. Sensors and Actuators A: Physical. 2005;120(2):474-481.
11. Souza FG Jr, Michel RC, Soares BG. A methodology for
studying the dependence of electrical resistivity with pressure in conducting composites. Polymer Testing. 2005;24(8):998-1004.
12. Barra GMO, Martins RR, Kafer KA, Paniago R, Vasques
CT, Pires ATN. Thermoplastic elastomer/polyaniline blends: Evaluation of mechanical and electromechanical properties.
Polymer Testing. 2008;27(7):886-892.
13. Pyo M, Hwang JH. Conductivity changes of dodecylbezensulfonic acid-doped polyaniline during pressure loading/unloading.
Synthetic Metals. 2009;159(7-8):700-704.
14. Brady S, Diamond D, Lau KT. Inherently conducting polymer modified polyurethane smart foam for pressure sensing. Sensors and Actuators A: Physical. 2005;119(2):398-404.
15. Job AE, Oliveira FA, Alves N, Giacometti JA, Mattoso LHC.
Conductive composites of natural rubber and carbon black.
Synthetic Metals. 2003;135-136:99-100.
16. Hussain M, Choa YH, Niihara K. Fabrication process and
electrical behavior of novel pressure-sensing composites.
Composites Part A: Applied Science and Manufacturing. 2001;32(12):1689-1696.
17. Wu X, Han Y, Zhang X, Zhou Z, Lu C. Large-Area Compliant, Low-Cost, and Versatile Pressure-Sensing Platform Based on Microcrack-Designed Carbon Black@Polyurethane Sponge
for Human-Machine Interfacing. Advanced Functional Materials. 2016;26(34):6246-6256.
18. Beruto DT, Capurro, Marro G. Piezoresistance behavior of
silicone-graphite composites in the proximity of the electric percolation threshold. Sensors and Actuators A: Physical. 2005;117(2):301-308.
19. Ludeelerd P, Niamlang S, Kunaruksapong R, Sirivat A. Effect
20. Zang X, Jiang Y, Wang X, Wang X, Ji J, Xue M. Highly sensitive
pressure sensors based on conducting polymer-coated paper.
Sensors and Actuators B: Chemical. 2018;273:1195-1201.
21. Wang Y, Wang Y, Guo, CF. Recent progresses on flexible
tactile sensors. Materials Today Physics. 2017;1:61-73.
22. Kweon OY, Lee SJ, Oh JH. Wearable high-performance
pressure sensors based on three-dimensional electrospun
conductive nanofibers. NPG Asia Materials. 2018;10:540-551.
23. Muller D, Garcia M, Salmoria GV, Pires ATN, Paniago R, Barra GMO. SEBS/PPy.DBSA Blends: Preparation and evaluation
of electromechanical and dynamic mechanical properties.
Journal of Applied Polymer Science. 2011;120(1):351-359.
24. Merlini C, Barra GMO, Araujo TM, Pegoretti A. The effect
of compressive stress on the electrically resistivity of poly
(vinylidene fluoride)/polypyrrole blends. Synthetic Metals. 2014;196:186-192.
25. Yeole B, Sem T, Hansora DP, Mishra S. Effect of electrical properties
on gas sensitivity of polypyrrole/cds nanocomposites. Journal of Applied Polymer Science. 2015;132(32):42379.
26. Yeole B, Sem T, Hansora DP, Mishra S. Electrical and Gas Sensing
Behaviour of Polypyrrole/silver Sulphide Nanocomposites.
American Journal of Sensor Technology. 2017;4(1):10-20.
27. Yeole B, Sem T, Hansora DP, Mishra S. Polypyrrole/Metal
Sulphide Hybrid Nanocomposites: Synthesis, Characterization and
Room Temperature Gas Sensing Properties. Materials Research. 2016;19(5):999-1007.
28. Xue J, Chen J, Song J, Xu L, Zeng H. Wearable and visual pressure sensors based on Zn2GeO4@polypyrrole nanowire aerogels. Journal of Materials Chemistry C. 2017;5(42):11018-11024.
29. Ramôa SDAS, Barra GMO, Merlini C, Schreiner WH, Livi S, Soares BG. Production of montmorillonite/polypyrrole nanocomposites through in situ oxidative polymerization of pyrrole: Effect of anionic
and cationic surfactants on structure and properties. Applied Clay Science. 2015;104:160-167.
30. Boukerma K, Piquemal JY, Chehimi MM, Mravcáková M, Omastová M, Beaunier P. Synthesis and interfacial properties
of montmorillonite/polypyrrole nanocomposites. Polymer. 2006;47(2):569-576.
31. Moucka R, Mravcáková M, Vilcáková J, Omastová M, Sáha P. Electromagnetic absorption efficiency of polypropylene/
montmorillonite/polypyrrole nanocomposites. Materials & Design. 2011;32(4):2006-2011.
32. Peighambardoust SP, Pourabbas B. Preparation and characterization of nylon-6/PPy/MMT composite of nanocomposite. Journal of Applied Polymer Science. 2007;106(1):697-705.
33. Merlini C, Rosa BS, Müller D, Ecco LG, Ramôa SDAS, Barra GMO. Polypyrrole nanoparticles coated amorphous short silica fibers:
Synthesis and characterization. Polymer Testing. 2012;31(8):971-977.
34. Chatterjee A, Maity S. A comparative study of reaction kinetics of in-situ chemical polymerization of polypyrrole onto various textile
fibres. Surface and Coatings Technology. 2017;324:569-576.
35. Ramoa SDAS, Barra GMO, Merlini C, Livi S, Soares BG,
Pegoretti A. Novel electrically conductive polyurethane/ montmorillonite-polypyrrole nanocomposites. Express Polymer Letters. 2015;9(10):945-958.
36. Merlini C, Pegoretti A, Araújo TA, Ramoa SDAS, Schreiner WH, Barra GMO. Electrospinning of doped and undoped-polyaniline/ poly (vinylidene fluoride) blends. Synthetic Metals. 2016;213:34-41.
37. Kalasad MN, Gadyal MA, Hiremath RK, Mohamed Ikram I, Milimani BG, Khazi IM, et al. Synthesis and characterization of
polyaniline rubber composites. Composites Science and Technology. 2008;68(7-8):1787-1793.
38. Vilcáková J, Paligová M, Omastová M, Sáha P. Quadrat O. "Switching effect" in pressure deformation of silicone rubber/
polypyrrole composites. Synthetic Metals. 2004;146(2):121-126.
39. Livi S, Lins LC, Sar G, Gérard JF, Duchet-Rumeau J. Supercritical CO2-Ionic Liquids: A Successful Wedding To Prepare Biopolymer Foams. ACS Sustainable Chemistry & Engineering. 2016;4(2):461-470.
40. Livi S, Sar G, Bugatti V, Espuche E, Duchet-Rumeau J.
Synthesis and physical properties of new layered silicates based on ionic liquids: improvement of thermal stability, mechanical behaviour and water permeability of PBAT nanocomposites.
RSC Advances. 2014;4(50):26452-26461.
41. Kirkpatrick S. Percolation and Conduction. Reviews of Modern Physics. 1973;45(4):574-588.
42. Vargas PC, Merlini C, Ramôa SDAS, Ahrenhart R, Barra GMO, Soares BG. Conductive Composites Based on Polyurethane and Nanostructured Conductive Filler of Montmorillonite/
Polypyrrole for Electromagnetic Shielding Applications.
Materials Research. 2018;21(5):e20180014.
43. Contri G, Barra GMO, Ramoa SDAS, Merlini C, Ecco LG, Souza FS, et al. Epoxy coating based on montmorillonite-polypyrrole:
Electrical properties and prospective application on corrosion protection of steel. Progress in Organic Coatings. 2018;114:201-207.
44. Kim BH, Jung JH, Kim JW, Choi J, Joo J. Physical characterization of emulsion intercalated polyaniline-clay nanocomposite. Current Applied Physics. 2001;1(1):112-115.
45. Rizvi TZ, Shakoor A. Electrical conductivity and dielectric
properties of polypyrrole/Na+-montmorillonite (PPy/Na+-MMT) clay nanocomposites. Journal of Physics D: Applied Physics. 2009;42(9):095415.
46. Soto-Oviedo MA, Araújo OA, Faez R, Rezende MC, De Paoli
MA. Antistatic coating and electromagnetic shielding properties of a hybrid material based on olyaniline/organoclay nanocomposite
and EPDM rubber. Synthetic Metals. 2006;156(18-20):1249-1255.
47. Fukushima K, Wu MH, Bocchini S, Rasyida A, Yang MC. PBAT
based nanocomposites for medical and industrial applications.
Materials Science and Engineering: C. 2012;32(6):1331-1351.
48. Gopakumar TG, Lee JA, Kontopoulou M, Parent JS. Influence
49. Zheng H, Zhang Y, Peng Z, Zhang Y. Influence of the clay modification
and compatibilizer on the structure and mechanical properties of ethylene-propylene-diene rubber/montmorillonite composites.
Journal of Applied Polymer Science. 2004;92(1):638-646.
50. Xiong J, Zheng Z, Jiang H, Ye S, Wang X. Reinforcement of polyurethane composites with an organically modified
montmorillonite. Composites Part A: Applied Science and Manufacturing. 2007;38(1):132-137.
51. Kijchavengkul T, Auras R, Rubino M. Measuring gel content of
aromatic polyesters using FTIR spectrophotometry and DSC. Polymer Testing. 2008;27(1):55-60.
52. Al-Itry R, Lamnawar K, Maazouz A. Improvement of thermal stability, rheological and mechanical properties of PLA, PBAT
and their blends by reactive extrusion with functionalized epoxy.
Polymer Degradation Stability. 2012;97(10):1898-1914.
53. Ibrahim NA, Chieng BW, Wan Yunus WMZ. Morphology, Thermal
and Mechanical Properties of Biodegradable Poly(butylene succinate)/Poly(butylene adipate-co-terephthalate)/Clay Nanocomposites. Polymer-Plastic Technology and Engineering. 2010;49(15):1571-1580.
54. Muthuraj R, Misra M, Mohanty AK. Biodegradable biocomposites from poly(butylene adipate-co-terephthalate) and miscanthus: Preparation, compatibilization, and performance evaluation.
Journal of Applied Polymer Science. 2017;134(43):45448.
55. Jakab E, Mésazáros E, Omastová M. Thermal decomposition
of polypyrroles. Journal of Thermal Analysis and Calorimetry. 2007;88(2):515-521.
56. Oliveira FA, Alves N, Giacometti JA, Constantino CJL, Mattoso LHC, Balan AMOA, et al. Study of the thermomechanical
and electrical properties of conducting composites containing natural rubber and carbon black. Journal of Applied Polymer Science. 2007;106(2):1001-1006.
57. Al-Hartomy AO, Al-Solamy F, Al-Ghambi AA, Ibrahim MA, Dishovsky N, El-Tantawy F. Pressure Sensors Based on Polyvinyl Chloride/Graphite/Nickel Nanocomposites. Journal of Elastomers & Plastics. 2011;43(2):137-153.
58. Wang L, Wang X, Li Y. Relation between repeated uniaxial
compressive pressure and electrical resistance of carbon nanotube