EFFICIENCY EVALUATION OF THE CLEANING AND DISINFECTION OF
SURFACES IN A PRIMARY HEALTH CENTER
Aires Garcia dos Santos Junior1, Adriano Menis Ferreira2, Marcelo Alessandro Rigotti3, Fernando Ribeiro dos Santos4, Mara Cristina Ribeiro Furlan5, Denise de Andrade6
1 Doctoral student Postgraduate Program on Health and Development in the West Central Region, Universidade Federal do Mato
Grosso do Sul (UFMS). Professor, UFMS Nursing Course - Campus of Coxim. Coxim, Mato Grosso do Sul, Brazil. E-mail: airesjr_@ hotmail.com
2 Ph.D. in Nursing. Professor, UFMS Graduate Program on Health and Development in the West Central Region and UFMS Masters
in Nursing–Campus of Campo Grande. Três Lagoas, Mato Grosso do Sul, Brazil. E-mail: [email protected]
3 Ph.D. in Health Sciences. Professor, UFMS Nursing Course–Campus of Três Lagoas (CPTL). Três Lagoas, Mato Grosso do Sul,
Brazil. E-mail: [email protected]
4 Undergraduate student of Medicine, UFMS-CPTL. Três Lagoas, Mato Grosso do Sul, Brazil. E-mail: [email protected] 5 Ph.D. from the Graduate Program on Health and Development in the West Central Region. Professor at the UFMS–CPTL Nursing
Course. Três Lagoas, Mato Grosso do Sul, Brazil. E-mail: [email protected]
6 Ph.D. in Fundamental Nursing. Professor, Escola de Enfermagem de Ribeirão Preto da Universidade de São Paulo. Ribeirão Preto, São
Paulo, Brazil. E-mail: [email protected]
ABSTRACT
Objective: to evaluate the effect of educatival interventions in the cleaning and disinfection of surfaces in a health center.
Method: this is a prospective analytical study with a quantitative approach, carried out in a health center where two Estratégia Saúde da Família teams work. The surfaces chosen to be evaluated for their cleaning and disinfection were from: the dressing trolleys; reception desks; gynecological examination tables; patient stretchers; and nursing consultation tables. The monitoring methods used were: visual evaluation; counting of colony-forming units; and measurement of adenosine triphosphate. The Wilcoxon test and the Mann-Whitney test were used for the statistical analysis, considering a significance level of 5% or (p<0.05).
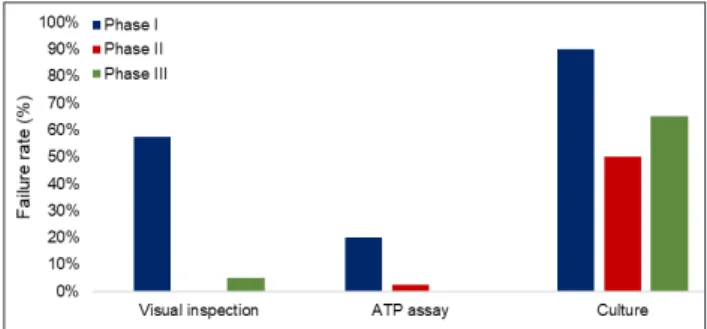
Results: a total of 720 evaluations were performed at the end of all phases. In phase I, failure rates of 57.5%, 20.0%, and 90.0% were observed. After the educational intervention, the quantitative short-term disapprovals decreased to 0.0%, 2.5%, and 50.0% (data from phase III) and, in the long term, to 5.0%, 0.0%, and 65% (data from phase IV) for the visual, adenosine triphosphate, and culture methods, respectively. Visual inspection was the method that presented the highest frequency of disapproved surfaces in phases I and IV.
Conclusion: the microbial load and the values of the adenosine triphosphate readings were reduced. Although this reduction was not statistically significant for all surfaces. The educational intervention was considered efficient.
DESCRIPTORS: Primary health care. Patient safety. Quality management. Health education. Disinfection.
AVALIAÇÃO DA EFICIÊNCIA DA LIMPEZA E DESINFECÇÃO DE
SUPERFÍCIES EM UMA UNIDADE BÁSICA DE SAÚDE
RESUMO
Objetivo: avaliar o efeito de intervenções educativasna limpeza e desinfecção de superfícies em uma unidade básica de saúde.
Métodos: trata-se de um estudo prospectivo, analítico com abordagem quantitativa. O estudo foi realizado em uma unidade básica de saúde, onde atuam duas equipes da Estratégia de Saúde da Família. Optou-se por avaliar a limpeza e desinfecção das superfícies: carrinho de curativo, balcão da recepção, mesa ginecológica, maca do paciente e mesa de consulta de enfermagem, utilizando-se dos métodos de monitoramento: avaliação visual, contagem de unidades formadoras de colônias e mensuração de adenosina trifosfato. Utilizaram-se, para a análise estatística, o teste de postos de Wilcoxon e o teste de Mann-Whitney, considerou-se nível de significância de 5% ou (p<0,05). Resultados: obteve-se um total de 720 avaliações realizadas ao término de todas as fases. Observou-se na fase I uma taxa de reprovação de 57,5%, 20,0% e 90,0%; após a intervenção educativa, os quantitativos de reprovação em curto prazo diminuíram para 0,0%, 2,5,0% e 50,0% (dados da fase III) e, em longo prazo, para 5,0%, 0,0% e 65% (dados da fase IV) para os métodos visual, adenosina trifosfato e cultura, respectivamente. A inspeção visual foi o método que apresentou maior frequência de superfícies reprovadas nas fases I e IV.
Conclusão: houve redução da carga microbiana e valores das leituras de adenosina trifosfato; embora essa redução não tenha sido estatisticamente significativa em todas as superfícies. Constatou-se que a intervenção educativa foi eficiente.
DESCRITORES: Atenção primária à saúde. Segurança do paciente. Gestão da qualidade. Educação em saúde. Desinfecção.
EVALUACIÓN DE LA EFICIENCIA DE LA LIMPIEZA Y DESINFECCIÓN DE
SUPERFICIES EN UNA UNIDAD BÁSICA DE SALUD
RESUMEN
Objetivo: evaluar el efecto de intervenciones educativa en la limpieza y desinfección de superficies en una unidad básica de salud. Métodos: se trata de un estudio prospectivo, analítico con abordaje cuantitativo. El estudio fue realizado en una Unidad Básica de Salud, donde actúan dos equipos de Estrategia de Saúde da Familia. Se optó por evaluar la limpieza y desinfección de las superficies: carro de curado, mostrador de recepción, mesa ginecológica, maca del paciente y mesa de consulta de enfermería, utilizando los métodos de monitoreo: evaluación visual, conteo de unidades formadoras de colonias y la medición de adenosina trifosfato. Se utilizaron para el análisis estadístico la prueba de puestos de Wilcoxon y la prueba de Mann-Whitney, se consideró un nivel de significancia del 5% o (p <0,05). Resultados: se obtuvo un total de 720 evaluaciones realizadas al término de todas las fases. En la fase I se obtuvo una tasa de reprobación del 57,5%, 20,0% y 90,0%; después de la intervención educativa, los cuantitativos de reprobación a corto plazo disminuyeron a 0,0%, 2,5,0% y 50,0% (datos de la fase III) y, a largo plazo, al 5,0%, 0, 0% y 65% (datos de la fase IV) para los métodos visual, Adenosina Trifosfato y cultivo, respectivamente. La inspección visual fue el método que presentó mayor frecuencia de superficies reprobadas en las fases I y IV. Conclusión: hubo reducción de la carga microbiana y valores de las lecturas de adenosina trifosfato; aunque esta reducción no fue estadísticamente significativa a todas las superficies. Se constató que la intervención educativa fue eficiente.
DESCRIPTORES: Atención Primaria de Salud. Seguridad del Paciente. Gestión de la Calidad. Educación en Salud. Desinfección.
INTRODUCTION
Contaminated environmental surfaces act as a reservoir for microorganisms that may come into contact with patients, directly or indirectly, from the hands of health professionals.1 It is noteworthy that on these surfaces microorganisms of epidemiologi-cal relevance may be found, such as vancomycin-re-sistant Enterococcus, Clostridium difficile, Acinetobacter spp., methicillin-resistant Staphylococcus aureus, and norovirus.2-4
Therefore, it is pertinent to develop actions with the goal of reducing the proliferation of these pathogens, considering that contaminated
environ-ments present a significant impact on the spread
of these agents.5 By virtue of the above, there is a growing concern about improving the cleaning and disinfection (C&D) of these surfaces, with a view to minimizing microbial transmission.6
It is observed that the performance of C&D of
surfaces is an essential element for infection control programs, although often the main focus is on car-rying out actions for adhesion to hand hygiene.7 It is also corroborated that, in some places, the envi-ronmental C&D practices are below those recom-mended due to various aspects, including human resources, noncompliance with the manufacturer’s standards and recommendations, and even the quality of the products used.8
It is also important to emphasize the need for
a greater focus on the C&D of surfaces considered to have a high incidence of touch by either patients’ or health professionals’ hands: bedside tables; door handles; light switches; bed rails; toilet seats; and handrails, among others; especially those in close proximity to patients.9-10 According to the United States Centers for Disease Control and Prevention, it
is important to extend cleaning performance to areas considered to be high-touch, in comparison to
low-touch areas. In addition, it should be noted that all
health services, regardless of their level of complexity, should seek the prevention of healthcare-associated
infections (HAIs).11 In the literature, a large number of publications in the hospital context are found; it is important to know which ones are performed in the C&D process in primary health care.
Based on this context, the goal of this study is to evaluate the effect of educational interventions on the cleaning and desinfection of surfaces in a primary health center (PHC).
METHOD
This is a prospective analytical study with a quantitative approach, carried out in a PHC (Três Lagoas, MS, Brazil) where two family health strate-gy teams work. The teams are composed of different categories of professionals, among them physicians, nurses, nursing technicians/auxiliaries, community health agents, dentists and dental assistants; cover-ing a total of 1,725 families registered. The study was
conducted from July to November 2015.
The environments chosen were the riskiest ones
for the acquisition of HAIs. Thus, a non-probabilistic
intentional sampling was adopted. An intentional
sample is one in which the researcher defines, based
on pertinent criteria for the study purpose, the ele-ments to be selected.12 Thus, after this observation, the following surfaces were chosen: dressing trolley; reception desk; gynecological examination table; pa-tient stretcher; and nursing consultation table.
surface were collected per day (five prior and five
after the C&D process), twice a week, during four
weeks, in phases I, III and IV, resulting in 80 samples per phase. This totaled 240 evaluations per each
monitoring method at the end of the three phases,
as shown in Table 1. The definition of ward and
days of the week for the collection was carried out by random sampling.
Table 1 - Number of evaluations performed per method in each phase of the study. Três Lagoas, Mato Grosso do Sul, Brazil, 2016
Method Phase I
(4 weeks)
Phase II (intervention)
Phase III (4 weeks)
Phase IV (4 weeks)
Total Evaluations
Visual Inspection 80 _ 80 80 240
ATP 80 _ 80 80 240
CFU 80 _ 80 80 240
Total 240 240 240 720
This study was conducted in four phases.
Phase I, characterized as diagnosis/observation, had a duration of one month. In this stage, the
C&D process was evaluated, and was carried out by the nursing team (one nurse and two nursing techniques in each period) and the cleaning team (one collaborator).
Regarding the characterization of the C&D process carried out in the PHC before the implemen-tation of the intervention program, it was observed that the unit already had a product indicated for
fixed surface disinfection; however, spray bottles
were not available for all rooms in the unit.
The responsibility for cleaning each of the studied surfaces varied. For example: the nursing professional (nurse or nursing technician) scaled for the procedure room was in charge of the dressing trolleys; the nursing professional (nurse or nursing technician) scaled for the vaccination room was in charge of the patient stretcher. Concerning the peri-odicity of the C&D of the surfaces, it was performed once a day, in the early morning or as needed.
It is important to note that the team was not
informed of the true intent of the study; this deci-sion was made in order to avoid the Hawthorne effect, that is, to avoid having the professionals modify their practices just because they were
be-ing observed. In this phase, when the question was
raised about the purpose of the researcher during the collections in the PHC, the professionals were informed that it was an evaluation of the cleaning products used in the unit.13-15
With the results obtained in phase I, an
educational intervention program was defined
and developed within the team in phase II. The objectives of the study were then clarified to all the
participants (nursing team, hygiene and cleaning
team, and coordination of the PHC).13-14 The
educa-tional intervention consisted of a 60-minute lecture, a presentation of the results of phase I (diagnosis),
standardization of C&D practices, and
standardiza-tion of microfiber cloths.15 With the standardization, surface C&D was established at a frequency of twice
a day and whenever necessary. It was also decided to use microfiber cloths (80% viscose, 15% polypro
-pylene, and 5% polyester) as, before the intervention
program, cotton cloths or paper towels were used, depending on each professional’s individual choice
for how to carry out the C&D process. In addition,
spray bottles containing the cleaning product were made available in all environments.13,15
In phase III, the immediate effect of the in
-terventions developed in phase II (with the PHC nursing and hygiene teams) was analyzed. Its onset occurred immediately after phase II, based on the same actions that were developed in phase I (diag -nosis); however, in this period, all participants were aware of the purpose of the study. Feedback to the team of the results and orientations was also offered in this phase, as requested by the professionals.15
In phase IV there was no intervention with the
teams, only monitoring, which started two months
after phase III and lasted for four weeks. The ob -jective of this stage was to verify whether, in the long term, the team maintained the guidelines and behaviors that were implemented. That is, during this period, no feedback or orientation was offered to the teams.15-16
Although the visual method does not offer
reliable criteria regarding the risk of HAIs, it is still
used in studies together with other monitoring methods, with a view to evaluating the visible dirt present on surfaces, including the presence of spots,
glue, dust, grease, fingerprints, and other residues
of these elements, for this investigation, was con-sidered inadequacy of the surface C&D process.16-17
For over 30 years, surface adenosine triphos -phate (ATP) detections have been used in the food and brewing industries to measure ATP, which indicates the presence of organic matter with great sensitivity.18 It is important to highlight that the ac -complishment of this monitoring method requires the acquisition of an apparatus, the luminometer, in addition to the use of swabs. The results of this
mea-surement are defined in relative light units (RLUs).
Because the data produced are quantitative, this method favors the provision of immediate feedback to the hygiene and nursing team.6
For the detection of aerobic microorganisms, contact plates called Rodac Plate® were used, consisting of tryptone soy agar (24 cm2), each with
an individual capacity between 15 ml and 20 ml. The plates were pressed against the surface for 10
seconds, and then introduced into an incubator at
a temperature of 37°C for 48 hours. Afterwards, the
plates were read in colony-forming units (CFU).19
In accordance with several studies, the surfac -es were disapproved when the ATP measurement
was greater than 250 RLUs, or when the amount of
CFU was greater than 2.5 CFU/cm2.7,10,17,19-25 All statistical tests were applied with a
sig-nificance level of 5% (or p<0.05). In the statistical
analysis, the Wilcoxon test was applied in order
to compare the results of ATP quantification and
microbial counts before and after the intervention in each of the evaluated surfaces and phases, and the Mann-Whitney test was applied in order to compare the variation of the microbial count and
the quantification of ATP in each of the evaluated
surfaces and phases.
This study was approved by the human
ethics and research committee of the Federal University of Mato Grosso do Sul, Brazil (CAAE:
37896414.9.0000.0021). It is also worth noting that
the national and international guidelines on research ethics were followed. Those who agreed to partici-pate signed a free and informed consent form. An authorization from the manager was also obtained for the conduction of the study.
RESULTS
At the end of this study, a total of 720 evalu
-ations was performed. In phase I, a failure rate of 57.5%, 20.0%, and 90.0% was obtained. After the
educational intervention, the quantitative
short-term disapprovals decreased to 0.0%, 2.5%, and 50.0% and, in the long-term, to 5.0%, 0.0%, and 65.0%, for the visual, ATP, and culture methods,
respectively (Figure 1).
Figure 1 - Failure rate (comparison between methods). Três Lagoas, Mato Grosso do Sul, Brazil, 2015
Table 2 shows the results of the proportions found on each of the surfaces according to visual
inspection. It is important to mention that the pro -portions described refer to the surfaces disapproved in the visual test before and after the intervention.
Table 2 - Proportions of surfaces with visual results disapproved before and after the intervention of cleaning and desinfection on the surfaces. Três Lagoas, Mato Grosso do Sul, Brazil, 2016
Visual inspection Intervention P-value*
Before After
Phase I (n=8)
Reception desk 0 (0.0%) 0 (0.0%) 1.000
Patient stetcher 8 (100%) 8 (100%) 1.000
Gynecological examination table 8 (100%) 8 (100%) 1.000
Dressing trolley 7 (87.5%) 7 (87.5%) 1.000
Phase III (n=8)
Reception desk 0 (0.0%) 0 (0.0%) 1.000
Patient stretcher 0 (0.0%) 0 (0.0%) 1.000
Gynecological examination table 0 (0.0%) 0 (0.0%) 1.000
Dressing trolley 0 (0.0%) 0 (0.0%) 1.000
Nursing consultation table 0 (0.0%) 0 (0.0%) 1.000
Phase IV (n=8)
Reception desk 0 (0.0%) 0 (0.0%) 1.000
Patient stretcher 5 (62.5%) 0 (0.0%) 0.026
Gynecological examination table 0 (0.0%) 0 (0.0%) 1.000
Dressing trolley 3 (37.5%) 2 (25.0%) 1.000
Nursing consultation table 2 (25.0%) 0 (0.0%) 0.467
* P-value for Fisher’s exact test for two proportions at p<0.05.
The results show that the highest failure
rates in phase I, regardless of the application of the
intervention, were observed on patient stretchers, gynecological examination tables, and dressing trolleys, whereas the reception desk and the nurs-ing consultation table did not present
disapprov-als. Phase III was characterized by the absence of
disapprovals regarding the evaluation of visual inspection of all surfaces.
As to phase IV, there were disapprovals on
the patient stretcher, the dressing trolley, and the
nursing consultation table. A significant proportion
of disapproval was shown for patient stretchers
(p=0.026); that is, the failure rate went from 62.5% before the intervention to 0.0% afterwards.
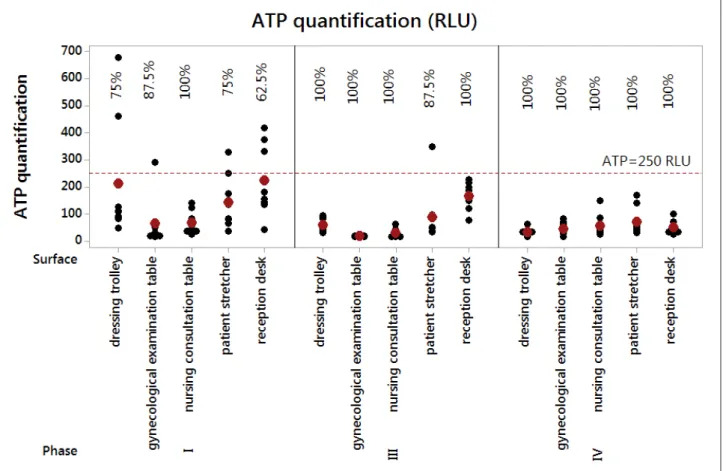
Figure 2 shows the graph for individual values
of the ATP levels of the five surfaces in the three
phases after the C&D intervention.
Note: Percentages are related to approval ratings. Black dots indicate the individual ATP values and red dots indicate the medians of the distributions.
Figure 2 - RLU values for the five surfaces in the three phases evaluated after the cleaning and
The data in Figure 2 show that all surfaces
presented failures in the ATP test in phase I, except for the nursing consultation table. A significant
improvement was observed in the approval of the
surfaces regarding the ATP test in phase III, with
an only disapproval on the dressing trolley, which
presented a quantification of ATP greater than 250 RLUs. In phase IV there were no disapprovals.
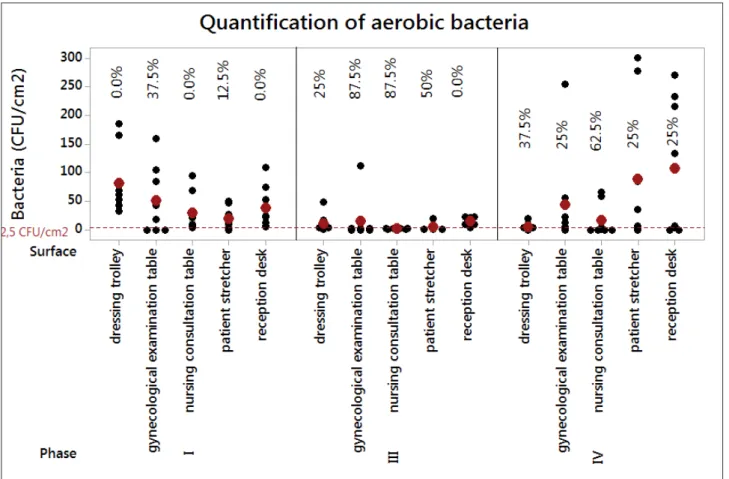
The quantification of aerobic bacteria (CFU/
cm2) was also evaluated, according to the cutoff point of 2.5 CFU/cm2 (Figure 3).
Note: Percentages related to approval ratings. Black dots indicate the individual ATP values and red dots indicate the medians of the distributions.
Figure 3 – Microbial count values for the five surfaces in the three phases evaluated after the cleaning
and desinfection intervention. Três Lagoas, Mato Grosso do Sul, Brazil, 2015.
Analysis of the results from Figure 3 suggests
that most of the surfaces evaluated in phase I were disapproved, with failure rates in the range of 62.5% to 100%. Improvements were observed in phase III.
However, there was a maximum failure rate for two surfaces: the reception desk and the dressing
trol-ley. In phase IV, there was a decrease in approvals in relation to phase III for the patient stretcher, the
nursing consultation table, and the gynecological examination table, along with an increase in the number of approvals for the reception desk and the dressing trolley, these being the ones with the
highest failure rates in phase III.
DISCUSSION
Several strategies known and implemented in hospital care for patient safety can be optimized in primary health care, as long as the particularities and characteristics of each service are considered.26 However, there are few studies on the impact of
healthcare-associated infections (HAIs) on services
outside the hospital context.27 Yet, there is a growing
concern about the risk of acquiring HAIs in
non-hospital health centers. A recent study carried out in
five primary healthcare units in Portugal identified
Regarding the inadequacies of the C&D process,
an evaluation of 85 surfaces from a 2,200-bed hospital
in Taiwan showed a general decrease in cleaning
inadequacies of 60.2%, 70.5%, and 58.1% % for the
visual evaluation, CFU, and ATP, respectively.10 These data are different from the ones obtained in this study, according to Figure 1, which shows a failure
rate in phase I; a decrease in the quantitative
short-term disapprovals after the educational intervention
(phase III); and, in the long-term (phase IV). Then ,
the resultsdemonstrate the assertive impact of the educational intervention on the team, obtained by means of this work.
A study14 indicates that, among the factors re-lated to the positive performance of the intervention in monitoring the cleaning by measuring the ATP, is the fact that the nursing team showed interest in
improving the C&D process of the surfaces. It is
worth mentioning that the HC team also showed great interest in the development of the study, adherence to the participation of the educational activity, interest in clarifying doubts, and improving the cleaning process carried out in the unit.
Also in corroboration is the importance of the impact of aligning clear competences for the teams, concerning the responsibility for each item of
fur-niture, equipment, or material. In a study carried
out in a hospital institution, the authors assert that the construction of clear delineations for the team, together with the monitoring of C&D, can favor the achievement of improved results.29
Multifaceted aspects may be correlated to the impacts of interventions. Several facets may be related to the non-success of the post-cleaning results, ranging from non-adherence to the protocol to inadequate performance of the procedures, and/ or use of contaminated materials, utensils, or equip-ment.28 Another factor associated with the quality
of the C&D process is the feedback to the team. In
a study carried out in an inpatient unit where feed-back was given to the team through the results of the ATP method in order to improve the quality of the environmental cleaning, a mean proportion of
significant improvement in cleaning was obtained (p=0.012). The conclusion was that the feedback to
the team directly responsible for the cleaning and the adoption of an objective method was a useful element for the improvement of the process.30
The data in Table 2 show the absence of disap-provals for the visual method immediately after the educational intervention but, in the long term,
dis-approvals are observed. It is important to mention
that in the PHC there was no formal periodic
con-tinuing education program for the team regarding environmental C&D. This was a different scenario from that found by other researchers, in which even checklists (with items related to the presence of dust,
residues, stains, blood, grease, fingerprints) were
used to evaluate the visual inspection, composing a constant program of hospital cleaning.
When analyzing the visual assessment sepa-rately, one study32 identified higher percentages of surfaces considered approved by the visual method even before undergoing the C&D process, implying that visual inspection used alone is a poor
indica-tor regarding the rigor of the cleaning. In this same study, the authors point to fluorescent markers and
evaluation of ATP as methods with better diagnosis in comparison to visual evaluation.
It is observed in health services that visual in -spection is often the most chosen method to evaluate the C&D process.6 However, visual evaluation has not presented itself as an accurate tool to measure the quality of cleaning when compared to other monitoring methods.6,19 Also, the visual method can demonstrate “coarse” results in the evaluation
of cleaning efficiency.18
The results of a study conducted in northern Taiwan, which aimed to evaluate and compare ATP bioluminescence with visual inspection, showed a lower sensitivity of the ATP method for cleaning evaluation when compared to visual evaluation and total aerobic colony counts. Thus, the authors concurred on the importance of using quantitative methods in the evaluation of C&D.
Visual inspection, in the present study, varied
in its failure rate, presenting a higher frequency of
failures in phases I and IV; whereas in phase III there was no disapproval of any surface. It is inferred that,
in this study, right after the educational interven-tion, the results were positive for this method of evaluating the C&D of the surfaces.
Considering the effects of short-term edu-cational intervention observed in a study,33 it was
noted that 43.9% presented values within the ac
-ceptable limit of cleanliness (less than 250 RLUs). This phase was carried out from April to June 2013.
After the educational intervention, there was an
improvement, increasing to 88.1%. The evaluation performed in phase II occurred right after the inter
-vention, from July to September 2013. Comparing
these data with the present study (Figure 2), it can
ac-cording to the ATP method. This suggested that, for this method, the C&D practices performed by
the team were more efficient. It is not possible to affirm that the team adhered better to this or any
other method, because there is no way to measure adherence to methods.
It is also worth noting that the intervention itself, when added to the team qualification and modification or updating of the C&D practices,
favors the improvement of the results previously obtained by the team. A study34 in a hospital en-vironment showed that the implementation of a
program (such as modifications in the cleaning process) reached results close to 90% of adequacy
through the evaluation of ATP.
Another aspect to be considered pervades the issue of the amount of friction to be exerted during the surface cleaning process.35 Considering that the
quality of the cleaning process can be influenced by
the pressure exerted by the professionals during its execution (and in spite of this friction activity being an action practically impossible to measure for each
individual), during phase II this issue was intensely stressed, and during phase III, in practice, it was again intensified with feedback.36 Moreover, the inadequa-cy of the cleaning process can often be related to the fact that the team does not actually remove the dirt, but redistributes the microorganisms on the surface.37
Although the evaluation of ATP favors the rapid
efficiency definition of the cleaning process, there are still divergences regarding the specification of organic matter regarding the identification of microorganisms
of epidemiological relevance that cause infections.38 However, it can be said that the bioluminescence
technique allows a rapid quantitative identification
of the organic matter present on the surfaces.10
As to the quantification of total aerobic bac
-teria, this study presented a failure rate of 62.5% to 100% (Figure 3), suggesting that most of the surfaces monitored in phase I were disapproved; however, in phase III, after the intervention, this quantitative went down to 50%. One of the advantages of the
microbiological method is the ability to quantify the hospital pathogens.31
It is important to highlight that evaluation
with the use of cultures can be carried out using swabs or glass slides coated with agar, with swabs
being more frequently used for the specific identi
-fication of pathogens, such as outbreak situations.
Agar plates allow measuring the microbial load expressed in aerobic colonies/cm2. However, both techniques have, as limitations, the cost and time spent in processing.18 For this study, Rodac® type
plates with disinfectant inhibitor were chosen, which represents an advantage when compared to other methods of microbiological collection from
flat and rigid surfaces.
This study presents, as a limitation, the choice
of only one HC, in addition to the non-identification
of the microorganism species and possible resistance
profiles in the cultures found in the CFU. However, these limitations are correlated with the financial
limitations of the conduction of the study.
CONCLUSION
With this investigation it is possible to identify microbial load reduction by CFU and ATP readings,
mainly in phases III and IV, on all surfaces evalu -ated, comparing the before and after of the C&D process, although this reduction was not statistically
significant in all surfaces evaluated. Visual inspec -tion was the method that presented the highest
fre-quency of surfaces disapproved in phases I and IV. It was found that the educational intervention
performed had a positive impact on the process of
C&D of the surfaces in phases III and IV, in com
-parison to phase I, for the visual, ATP and culture
methods, respectively.
Further studies are suggested, especially in a
non-hospital setting, in order to define acceptable
values and limits of C&D evaluation methods, con-sidering the level of health care.
REFERENCES
1. Han JH, Sullivan N, Leas BF, Pegues DA, Kaczmarek JL, Umscheid CA. Cleaning hospital room surfaces to prevent health care-associated infections: a technical brief. Ann Intern Med [Internet]. 2015 Oct [cited 2017 Jan 20]; 163(8):598-607. Available from: https://www. ncbi.nlm.nih.gov/pmc/articles/PMC4812669/pdf/ nihms-745848.pdf
2. Alfa MJ, Lo E, Olson N, MacRae M, Buelow-Smith L. Use of a daily disinfectant cleaner instead of a daily cleaner reduced hospital-acquired infection rates. Am J Infect Control [Internet]. 2015 Feb [cited 2017 Jan 20]; 43(2):141-6. Available from: http://www.sciencedirect.com/science/article/pii/ S019665531401284X
3. Dancer SJ. Controlling hospital-acquired infection: focus on the role of the environment and new technologies for decontamination. Clin Microbiol Rev [Internet]. 2014 Oct [cited 2017 Jan 20]; 27(4):665-90. Available from: https://www.ncbi.nlm.nih.gov/ pmc/articles/PMC4187643/pdf/zcm665.pdf
[cited 2017 Jan 20]; 26(4):338-44. Available from: https://www.ncbi.nlm.nih.gov/pubmed/23743816 5. Albrecht UV, von Jan U, Sedlacek L, Groos
S, Suerbaum S, Vonberg RP. Standardized, App-based disinfection of iPads in a clinical and nonclinical setting: comparative analysis. J Med Internet Res [Internet]. 2013 Aug [cited 2017 Jan 20]; 15(8):e176. Available from: https://www.ncbi.nlm.nih.gov/ pmc/articles/PMC3758047/
6. Havill NL. Best practices in disinfection of noncritical surfaces in the health care setting: creating a bundle for success. Am J Infect Control [Internet]. 2013 May [cited 2017 Jan 20]; 41(5 Suppl):S26-30. Available from: http://www.sciencedirect.com/science/article/pii/ S0196655313000059
7. Dancer SJ. How do we assess hospital cleaning? A proposal for microbiological standards for surface hygiene in hospitals. J Hosp Infect [Internet]. 2004 Jan [cited 2017 Jan 20]; 56(1):10-5. Available from: http://www.sciencedirect.com/science/article/pii/ S0195670103003955
8. Boyce JM. Modern technologies for improving
cleaning and disinfection of environmental surfaces in hospitals. Antimicrob Resist Infect Control [Internet]. 2016 Apr [cited 2017 Jan 20]; 5:10. Available from: https://aricjournal.biomedcentral.com/ articles/10.1186/s13756-016-0111-x
9. Dancer SJ, White L, Robertson C. Monitoring
environmental cleanliness on two surgical wards. Int J Environ Health Res [Internet]. 2008 Oct [cited 2017 Jan 20]; 18(5):357-64. Available from: https://www. ncbi.nlm.nih.gov/pubmed/18821374
10. Huang YS, Chen YC, Chen ML, Cheng A, Hung
IC, Wang JT, et al. Comparing visual inspection, aerobic colony counts, and adenosine triphosphate bioluminescence assay for evaluating surface cleanliness at a medical center. Am J Infect Control [Internet]. 2015 Aug [cited 2017 Jan 20]; 43(8):882-6. Available from: http://www.sciencedirect.com/ science/article/pii/S0196655315002151
11. Link T, Kleiner C, Mancuso MP, Dziadkowiec O, Halverson-Carpenter K. Determining high touch areas in the operating room with levels of contamination. Am J Infect Control [Internet]. 2016 Nov [cited 2017 Jan 20]; 44(11):1350-5. Available from: http://www.sciencedirect.com/science/article/pii/ S0196655316002406
12. Andrade SMO de. A pesquisa científica em saúde: concepção e execução. 4ª ed. Campo Grande (MS): UNIDERP; 2011.
13. Goodman ER, Platt R, Bass R, Onderdonk AB, Yokoe DS, Huang SS. Impact of an environmental cleaning intervention on the presence of methicillin-resistant
Staphylococcus aureus and vancomycin-resistant
enterococci on surfaces in intensive care unit rooms.
Infect Control Hosp Epidemiol [Internet]. 2008 July [cited 2017 Jan 20]; 29(7):593-9. Available from: https://www.ncbi.nlm.nih.gov/pmc/articles/ PMC2670228/pdf/nihms94149.pdf
14. Knape L, Hambraeus A, Lytsy B. The adenosine triphosphate method as a quality control tool to assess ‘cleanliness’ of frequently touched hospital surfaces. J Hosp Infect [Internet]. 2015 Oct [cited 2017 Jan 20]; 91(2):166-70. Available from: http:// www.sciencedirect.com/science/article/pii/ S0195670115002649
15. Frota OP, Ferreira AM, Koch R, Andrade D, Rigotti MA, Borges NM, et al. Surface cleaning effectiveness in a walk-in emergency care unit: Influence of a multifaceted intervention. American Journal of Infection Control [Internet]. 2016 Aug [cited 2017 Jan 20]; 44(12):1572-7. Available from: http:// www.sciencedirect.com/science/article/pii/ S0196655316306915
16. Ferreira AM, Andrade D, Rigotti MA, Almeida MTG de, Guerra OG, Santos Junior AG dos. Assessment of disinfection of hospital surfaces using different monitoring methods. Rev Latino-Am Enfermagem [Internet]. 2015 May-Jun [cited 2017 Jan 20]; 23(3):466-74. Available from: http://www.scielo.br/pdf/rlae/ v23n3/0104-1169-rlae-23-03-00466.pdf
17. Mulvey D, Redding P, Robertson C, Woodall C, Kingsmore P, Bedwell D, et al. Finding a benchmark for monitoring hospital cleanliness. J Hosp Infect [Internet]. 2011 Jan [cited 2017 Jan 20]; 77(1):25-30. Available from: http://www.sciencedirect.com/ science/article/pii/S0195670110003774
18. Carling P. Methods for assessing the adequacy
of practice and improving room disinfection. Am J Infect Control [Internet]. 2013 May [cited 2017 Jan 20]; 41(5 Suppl):S20-5. Available from: http://www.sciencedirect.com/science/article/pii/ S0196655313000564
19. Cloutman-Green E, D’Arcy N, Spratt DA, Hartley
JC, Klein N. How clean is clean - Is a new microbiology standard required? Am J Infect Control [Internet]. 2014 Sept [cited 2017 Jan 20]; 42(9):1002-3. Available from: http://www.sciencedirect.com/science/article/pii/ S0196655314007895
20. Boyce JM, Havill NL, Lipka A, Havill H, Rizvani R.
Variations in Hospital Daily Cleaning Practices. Infect Control Hosp Epidemiol [Internet]. 2010 Jan [cited 2017 Jan 20]; 31(1):99-101. Available from: https:// www.ncbi.nlm.nih.gov/pubmed/19951203
21. Boyce JM, Havill NL, Havill HL, Mangione E, Dumigan DG, Moore BA. Comparison of fluorescent marker systems with 2 quantitative methods of assessing terminal cleaning practices. Infect Control Hosp Epidemiol [Internet]. 2011 Dec [cited 2017 Jan 20]; 32(12):1187-93. Available from: https://www. ncbi.nlm.nih.gov/pubmed/22080657
23. Lewis T, Griffith C, Gallo M, Weinbren M. A modified ATP benchmark for evaluating the cleaning of some hospital environmental surfaces. J Hosp Infect [Internet]. 2008 June [cited 2017 Jan 20]; 69(2):156-63. Available from: http://www.sciencedirect.com/ science/article/pii/S0195670108001278
24. Malik RE, Cooper RA, Griffith CJ. Use of audit tools to evaluate the efficacy of cleaning systems in hospitals. Am J Infect Control [Internet]. 2003 [cited 2017 Jan 20]; 31(3):181-7. Available from: http://www.sciencedirect.com/science/article/pii/ S019665530248234X?via%3Dihub
25. Sherlock O, O’Connell N, Creamer E, Humphreys H. Is it really clean? An evaluation of the efficacy of four methods for determining hospital cleanliness. J Hosp Infect [Internet]. 2009 [cited 2017 Jan 20]; 72(2):140-6. Available from: http://www.sciencedirect.com/ science/article/pii/S0195670109000838
26. Rede Brasileira de Enfermagem e Segurança do Paciente. Estratégias para a segurança do paciente: manual para profissionais da saúde. Porto Alegre: EDIPUCRS; 2013.
27. Centers for Disease Control and Prevention (CDC). Division of Healthcare Quality Promotion. Guide to infection prevention in outpatient settings: Minimum Expectations for safe care. Atlanta: CDC; 2011.
28. Ferreira H. Utilização do método ATP bioluminescência
na avaliação da eficácia da limpeza e desinfeção de superfícies em cuidados de saúde primários. Hotelaria & Saúde [Internet]. 2014 Jan-Jun [cited 2017 Jan 20]; 5:25-7. Available from: http://www. hotelariaesaude.pt/scid/webHS/includes/book/ viewBook.asp?articleID=84
29. Dumigan DG, Boyce JM, Havill NL, Golebiewski
M, Balogun O, Rizvani R. Who is really caring for your environment of care? Developing standardized cleaning procedures and effective monitoring techniques. Am J Infect Control [Internet]. 2010 June [cited 2017 Jan 20]; 38(5):387-92. Available from: http://www.sciencedirect.com/science/article/pii/ S0196655309008293
30. Branch-Elliman W, Robillard E, McCarthy G Jr, Gupta
K. Direct feedback with the ATP luminometer as a process improvement tool for terminal cleaning of patient rooms. Am J Infect Control [Internet]. 2014 Feb [cited 2017 Jan 20]; 42(2):195-7. Available from: http://www.sciencedirect.com/science/article/pii/ S0196655313012121
31. Watanabe R, Shimoda T, Yano R, Hayashi Y, Nakamura S, Matsuo J, et al. Visualization of hospital cleanliness in three Japanese hospitals with a tendency toward long-term care. BMC Res Notes [Internet]. 2014 Mar
[cited 2017 Jan 20]; 7:121. Available from: https:// www.ncbi.nlm.nih.gov/pmc/articles/PMC3996023/ pdf/1756-0500-7-121.pdf
32. Luick L, Thompson PA, Loock MH, Vetter SL, Cook J, Guerrero DM. Diagnostic assessment of different environmental cleaning monitoring methods. Am J Infect Control [Internet]. 2013 Aug [cited 2017 Jan 20]; 41(8):751-2. Available from: http:// www.sciencedirect.com/science/article/pii/ S0196655312012679.
33. Chan MC, Lin TY, Chiu YH, Huang TF, Chiu SK, Liu TL, et al. Applying ATP bioluminescence to design and evaluate a successful new intensive care unit cleaning programme. J Hosp Infect [Internet]. 2015 Aug [cited 2017 Jan 20]; 90(4):344-6. Available from: http://www.sciencedirect.com/science/article/pii/ S0195670115001802
34. Moore G, Smyth D, Singleton J, Wilson P. The use of adenosine triphosphate bioluminescence to assess the efficacy of a modified cleaning program implemented within an intensive care setting. Am J Infect Control [Internet]. 2010 Oct [cited 2017 Jan 20]; 38(8):617-22. Available from: http://www.sciencedirect.com/ science/article/pii/S0196655310004463
35. Rigotti MA, Ferreira AM, Nogueira MCL, Almeida MTG de, Guerra OG, Andrade D de. Evaluation of three surface friction techniques for the removal of organic matter. Texto Contexto Enferm [Internet]. 2015 Dec [cited 2017 Jan 20]; 24(4):1061-70. Available from: http://dx.doi.org/10.1590/0104-0707201500003690014
36. Sattar SA, Maillard JY. The crucial role of wiping in decontamination of high-touch environmental surfaces: review of current status and directions for the future. Am J Infect Control [Internet]. 2013 May [cited 2017 Jan 20]; 41(5 Suppl):S97-104. Available from: http://www.sciencedirect.com/science/ article/pii/S0196655313000151
37. Cooper RA, Griffith CJ, Malik RE, Obee P, Looker N. Monitoring the effectiveness of cleaning in four British hospitals. Am J Infect Control [Internet]. 2007 Jun [cited 2017 Jan 20]; 35(5):338-41. Available from: http://www.sciencedirect.com/science/article/pii/ S0196655306011801
38. Gibbs SG, Sayles H, Chaika O, Hewlett A, Colbert EM,
Smith PW. Evaluation of the relationship between ATP bioluminescence assay and the presence of organisms associated with healthcare-associated infections. Healthcare Infection [Internet]. 2014 Sept [cited 2017 Jan 20]; 19(3):101-7. Available from: http://www.sciencedirect.com/science/article/pii/ S1835561716300370
Correspondencia: Aires Garcia dos Santos Junior Universidade Federal de Mato Grosso do Sul Av. Márcio Lima Nantes, s/n. -Câmpus Coxim 79400-000 - Vila da Barra, Coxim, MS, Brasil E-mail: [email protected]
Received: April 27, 2017 Approved: November 27, 2017