Variability in storm climate along the Gulf of Cadiz: the role of large
1scale atmospheric forcing and implications to coastal hazards.
23
Theocharis A. Plomaritis1,2*, Javier Benavente1, Irene Laiz3 and Laura Del Rio1 4
5 1
Department of Earth Science, Faculty of Marine and Environmental Science, University 6
of Cadiz. Poligono Rio San Pedro S/N, 11510, Puerto Real, Cadiz, Spain. 7
2
CIMA, University of Algarve, Campus de Gambelas, Faro, Portugal 8
3
Department of Applied Physics, Faculty of Marine and Environmental Science, 9
University of Cadiz. Poligono Rio San Pedro S/N, 11510, Puerto Real, Cadiz, Spain. 10
11
Abstract 12
In the context of increased coastal hazards due to variability in storminess patterns, the 13
danger of coastal damages and/or morphological changes is related to the sum of sea 14
level conditions, storm surge, maximum wave height and run up values. In order to better 15
understand the physical processes that cause the variability of the above parameters a 44 16
years reanalysis record (HIPOCAS) was used. The HIPOCAS time-series was validated 17
with real wave and sea-level data using linear and vector correlation methods. In the 18
present work changes in the magnitude, duration, frequency and approach direction of the 19
Atlantic storms over the Spanish Gulf of Cadiz (SW Iberian Peninsula) were identified by 20
computing various storm characteristics such as maximum wave height, total energy per 21
storm wave direction and storm duration. The obtained time-series were compared with 22
large-scale atmospheric indices such as the North Atlantic Oscillation (NAO) and the 23
East Atlantic pattern (EA). The results show a good correlation between negative NAO 24
values and increased storminess over the entire Gulf of Cadiz. Furthermore, negative 25
NAO values were correlated with high residual sea level values. Finally, a joint 26
probability analysis of storm and sea level analysis resulted in increased probabilities of 27
the two events happening at the same time indicating higher vulnerability of the coast and 28
increased coastal risks. The above results were compared with coastal inundation events 29
that took place over the last winter seasons in the province of Cadiz. 30
* Corresponding Author email: [email protected] 31
1. Introduction
33 34
Storm events are considered the main cause for shoreline change in many areas 35
worldwide (Fenster et al., 2001). Depending on the magnitude of the event and the 36
morphological characteristics of the coastline the change can be transient or persistent 37
(Anderson et al., 2010). Hence, storms are attributed an essential role in coastal long-term 38
evolution (decadal and centennial) despite the usually short time scale of their action 39
(Morton et al., 1995). Nowadays there is a growing socioeconomic need towards 40
innovative coastal management and evaluation of the risks associated with the 41
development in coastal plains (Van Dongeren et al., 2014). The combined effect of storm 42
activity and surge level changes can pose a risk on the coastal environment by eroding 43
the upper beach and inundating any low lying backshore area. In coastlines exposed to 44
long fetches, such as the Spanish Atlantic coast, large scale atmospheric phenomena are 45
the main source of storminess variability. Hence, the seasonal and inter-annual variability 46
or long term trends of the above processes can affect the risk distribution over a particular 47
stretch of coastline. 48
49
Specific trends in wave heights have long been observed in the North Atlantic (Bacon 50
and Carter, 1991; Carter and Draper, 1988; Dupuis et al., 2006; Feng et al., 2014b) and in 51
the Northeast Pacific (Allan and Komar, 2000). Furthermore, Bacon and Carter (1991) 52
observed a correlation between North Atlantic meridional atmospheric pressure gradient 53
and wave height. Woolf et al. (2002) established a relationship between wave height 54
anomalies and large scale atmospheric pressure patterns over the Northeast Atlantic on 55
the basis of satellite altimetry. Finally, Dodet et al. (2010) presented a larger influence of 56
the NAO over the south area of Europe using a 60 year long wave model forced by the 6h 57
wind field from National Centres of Environmental Prediction (NCEP) reanalysis project 58
(Kalnay et al., 1996). 59
60
Traditionally the NAO and other climatic indices have been mainly linked with 61
temperature, precipitation and large scale circulation patterns. Recent studies have also 62
focused on analysing the response of sea level variability to NAO, but always at a broad 63
spatial scale (Efthymiadis et al., 2002; Tsimplis and Shaw, 2008; Tsimplis et al., 2006; 64
Woolf et al., 2003). Main findings are that the NAO influence on sea level is dominant in 65
winter and represents one of the causes of the high inter-annual variability of sea level 66
during this season. Moreover, Woolf et al. (2003) suggest that NAO effects are probably 67
similar in the open ocean and along coastlines in large geographical areas, although they 68
might sometimes be masked by local phenomena. 69
70
Regional correlations between mean monthly wave height and NAO values have been 71
performed by various researchers (Bertin et al., 2013; Dodet et al., 2010; Feng et al., 72
2014a; Rangel-Buitrago and Anfuso, 2013; Woolf et al., 2003). The impact of storms on 73
shoreline variability has been widely demonstrated (e.g. (Cooper et al., 2004; List et al., 74
2006; Morris et al., 2001). However, a direct relationship between inter-annual wave 75
variability and coastal response has not been linked to NAO because of the general lack 76
of long-term and detailed coastal topographic data and the influence of other local and 77
regional aspects on coastal changes, such as geological framework (Jackson et al., 2005). 78
Recently O’Connor et al. (2011) demonstrated a tentative link between coastline 79
topography and NAO-modulated external forcing, by focusing in small and well 80
constrained tidal inlets of northwest of Ireland. Thomas et al. (2011) derived a negative 81
correlation between beach rotation and volume with the NAO for the southwest Welsh 82
coast. In the same way, using the SOI climatic index and the data-set of Narrabeen Beach 83
in Australia a relation between beach rotation was linked to the variability of wave 84
characteristics (Harley et al., 2009; Ranasinghe et al., 2004; Short et al., 2000). 85
86
Although it is well known that NAO affects the latitudinal aspects of storm tracks 87
variability over the Atlantic (Keim et al., 2004; Rogers, 1997) an in-depth investigation 88
of the joint influence on the wave storminess and sea surface height variability and the 89
associated coastal hazards in the Gulf of Cadiz has not yet been undertaken. The present 90
work focuses in the coastal area of the northern part of the Gulf of Cadiz and goes 91
beyond the separate analysis of wave and residual sea level as it investigates the 92
combined occurrence of the phenomena and their contribution to the increasing severity 93
of coastal hazards. Furthermore, other aspects of wave storminess are examined such as 94
the storm significant wave height, the storm direction and the total amount of storm hours 95
in a month. A description of the study area, wave and sea level data sets is presented, 96
followed by a section focused on the validation exercise and correction fittings that were 97
employed in order to improve the results of the hindcast models for storm conditions. 98
Then the inter-annual variability of the record is presented and correlations with large 99
scale climatic indices are undertaken. Finally, discussion and conclusions of the results 100
obtained and comparison with other work are detailed. 101
102
2. Study area
103
The Gulf of Cadiz is the sub-basin that connects the Atlantic Ocean with the 104
Mediterranean Sea through the Strait of Gibraltar. Its northern and southern boundaries 105
are, respectively, the southwest coast of the Iberian Peninsula and the Atlantic coast of 106
Morocco (Figure 1). As an Atlantic exposed coast it is influenced by large scale oceanic 107
weather systems that cross the North Atlantic following an eastward path, that determine 108
the patterns of precipitation, wind and long-fetch waves. The storms generated by these 109
systems are the principal cause of transient erosion in the area (Del Rio, 2007). On a local 110
scale, the orientation of the coastline and the local physiographic characteristics result in 111
sheltering effects to the north component winds and funnelling effects to south and east 112
component winds due to the complex orography of the Strait of Gibraltar (Dorman et al., 113
1995). The prevailing wind and wave fields are from WSW directions (Figure 1), with a 114
yearly average significant wave height of 1 m comprised of both sea and swell, 115
generating a predominant longshore current towards the E and SE (Benavente et al., 116
2000). Waves with north component are not frequent within the Gulf of Cadiz due to the 117
sheltering effect of the Cape St. Vincent (Figure 1) where significant diffraction and 118
attenuation takes place. In general the northern Gulf of Cadiz is characterized by a lower 119
energy wave climate than the western coastlines of the Iberian Peninsula (Loureiro et al., 120
2013). Storm events are generally frequent over the autumn and winter months with 121
significant wave height values reaching up to 7m. The less frequent wave storm events in 122
the Gulf of Cadiz have easterly directions (wave rose in Figure 1) but they do not produce 123
high waves to the north-eastern part of the Gulf due to their limited fetch. Due to the 124
coastline orientation, these limited fetch storm waves affect only the north-western part 125
of the Gulf of Cadiz. 126
127
In terms of tides the area can be described as semidiurnal with mean tidal range of 2.20 m 128
decreasing towards the Strait of Gibraltar. Changes in shoreline orientation along the 129
Gulf coast greatly influence the approach angle of waves, which diminishes progressively 130
towards the Southeast, generating less significant littoral currents close to the Strait of 131
Gibraltar and weaker longshore drift (Medina, 1991). The surface circulation over the 132
continental shelf is mainly wind-driven but it is also affected by local forcing 133
mechanisms, such as the Guadalquivir River discharge, and is subject to seasonal and 134
inter-annual variations deeply related to the seasonal variability of the open sea 135
circulation (Criado-Aldeanueva et al., 2009). The latter is greatly affected by the large-136
scale atmospheric patterns over the Atlantic Ocean, roughly represented by the NAO 137
index (Criado-Aldeanueva et al., 2009). 138 139 3. Methodology 140 141 3.1 Data description 142
In the present work the nearshore nodes of a hindcast dataset (HIPOCAS data 143
hereinafter), located over the north coast of the Gulf of Cadiz were used. The dataset 144
consists of a 44-year reanalysis of meteorological, wave variables and sea level spanning 145
between January 1958 and December 2001 (Sebastiao et al., 2008). For the wave 146
simulation over the Gulf of Cadiz a grid of 5’ was linked to a larger WAM model 147
(WAMDI-Group, 1988) of the Atlantic Ocean through a series of nested models (Gomez 148
Lahoz and Carretero Albiach, 2005). The wave model was initially forced by the NCEP 149
reanalysis wind fields. The ocean circulation and sea level variations were simulated with 150
the HAMSOM model over a grid of 10’x 15’ taking into account wind and pressure 151
forcing. The hydrodynamic model was forced with boundary conditions from the REMO 152
atmospheric model (Sebastiao et al., 2008) that was in turn forced with NCEP data. The 153
sea-level data represent the atmospherically-induced contribution and the associated 154
storm surges and do not have a tidal signal, or the contribution of the steric effect on sea-155
level (Sebastiao et al., 2008). The output time-step was 3 hours for all the parameters. 156
From the above data set five stations were selected that cover the entire north coast of the 157
Gulf of Cadiz (Figure 1). From west to east the selected stations are: Faro, that represents 158
the most exposed part of the Gulf of Cadiz with a narrow shelf and a steep continental 159
slope; Huelva and Seville, located further to the east, at the widest part of the continental 160
shelf and partially sheltered from the west and north component winds by the Cape St. 161
Vincent; Cadiz station is located further to the southeast where the shelf width starts to 162
reduce and the coastline is more exposed to the Atlantic storms; finally the Zahara station 163
is largely dominated by the Gibraltar Strait conditions and is characterized by the absence 164
of continental shelf and reduced tidal range. In terms of wave data the coastal buoy of 165
Cadiz managed by Spanish Port Authorities and the buoy of Faro managed by the 166
Portuguese Hydrographical Office (Figure 1) were selected for validation purposes since 167
they provided directional wave measurement overlapping with the model data. 168
169
3.2 HIPOCAS data validation
170
An extensive validation exercise was undertaken by Mendez et al. (2006) between the 171
HIPOCAS wave data and wave buoy data collected around the Spanish coasts. However, 172
in order to optimize the results in the Gulf of Cadiz, a new correction was applied in the 173
present study that consisted in: (i) fitting the model wave height to observations focusing 174
mainly in the case of storm conditions; (ii) evaluating differences between model and 175
measured wave directions using a vector correlation approach (Kundu, 1976). The wave 176
height validation was evaluated by calculating the bias and the Brier Skill Score (BSS). 177
The latter parameter relates the variance of the difference between data and model with 178
the variance of the data. BSS=1 means perfect skill, BSS=0 means no skill (Roelvink et 179
al., 2009). The wave direction validation was evaluated based on the Kundu coefficient 180
and mean angle rotation (θ). Both wind waves and swell were analysed together since 181
they coexist during storm events and no spectral information was available. 182
183
In order to obtain a statistically independent wave height data set of storm conditions a 184
peak over threshold analysis (POT) was used for the period with simultaneous model and 185
observation data (Kamphuis, 2000). The above analysis allowed producing a correction 186
based on the peak values of each storm and was then applied to the entire data set. The 187
threshold value for the POT analysis was set as 1.5m wave height (a threshold value 188
proposed by the local authorities for civil protection), and a storm independence criteria 189
(time between two consecutive independent storms) was calculated based on the integral 190
time scales of the autocorrelation function (Emery and Thomson, 2001). Higher storm 191
threshold values proposed for the area of Cadiz (Almeida et al., 2012; Del Rio et al., 192
2012; Ribera et al., 2011) were also used but the fitting coefficients obtained were not 193
significantly different. 194
195
The corrected values of significant wave height (Hsc) improved the time series extracted 196
from the reanalysis data for storms with Hs higher than 3m, where the HIPOCAS data 197
had significantly and systematically overestimated the wave height approximately by 198
30%. A single model was constructed from both data series with a correlation coefficient 199
of r=0.75 and applied to all stations. Similar correlation coefficients were also obtained 200
for only the Faro data by Almeida et al. (2011). Separate analysis of Cadiz and Faro 201
buoys resulted in correlations that had statistically no significant differences. Typical 202
results are shown in Figure 2 for March 1995 for both stations, where it can be observed 203
that the corrected HIPOCAS data show better agreement during storm conditions with the 204
buoy data. For the data set relative bias values of 0.02 instead of 0.29 for the uncorrected 205
data and BSS of 0.60 instead of 0.43 were obtained for the buoy of Faro. For the case of 206
Cadiz buoy similar values were calculated with relative bias decreasing from 0.35 to -207
0.02 and BSS increasing from 0.41 to 0.66. 208
209
The agreement between the original (uncorrected) model data and buoy data, in both Faro 210
and Cadiz wave buoys, was tested for wave height and direction simultaneously using the 211
Kundu (1976) vector correlation approach. This correlation method produces a 212
coefficient between the directional wave heights of the two time series and the main 213
angle (θ) through which the first series would have to be rotated anticlockwise to match 214
the direction of the second series. Although overlapping of directional wave data between 215
the buoy of Cadiz and the HIPOCAS data only exists over part of 2001, the period is long 216
enough to cover both calm and stormy conditions. For the case of Faro the overlapping 217
period was much longer (1997-2001). The correction coefficients calculated for the two 218
time series were not statistically different; hence a common correction equation was 219
derived for both sites and then applied to all the wave data. 220
221
Differences in wave propagation direction between the measured and modelled data are 222
presented against the significant wave height in Figure 3. There is a large scatter in 223
directions for wave heights lower than 1m in both sites. However, as it can be seen from 224
the point’s density, large differences are only present over few events, while the majority 225
of the data show small deviations. Such deviations are reduced to a variance of 45 deg for 226
waves between 1-1.5m, also with larger densities concentrated in small differences. Data 227
from Faro present slightly larger deviations for the lower wave heights. This is probably 228
related to the diffraction processes that waves undergo at the Cape St. Vincent, which are 229
probably not fully resolved by the model resolution. For the higher wave heights the 230
directional scatter is minimized and the HIPOCAS data present a good agreement with 231
the observed data. 232
233
Using the vector correlation approach, the correlation coefficient obtained for the Cadiz 234
buoy was 0.71 with an average angle difference of 4.7 deg. For Faro the correlation 235
obtained was 0.76 with an average angle difference of -5.2 deg. In Figure 4 the E-W 236
(zonal) and N-S (meridional) components of the waves are plotted for both sites. A good 237
agreement is observed between both components, particularly for large storm events of 238
southwest direction, which is the main oceanic storm approach direction. Similar results 239
were also observed by Ribera et al. (2011) for the same data set. The locally generated 240
small storms with predominant southeast directions are not well represented by the model 241
probably due to spatial constraints of the atmospheric forcing that cannot resolve the 242
local east wind acceleration over the Strait of Gibraltar (Figure 4, around 11/08/2001) and 243
the short fetch of those waves. These locally generated storms are not affecting the 244
eastern coastline of the Gulf of Cadiz, because of the short fetch and its general 245
orientation. However, the above events can generate coastal erosion events further west, 246
over the coast of southern Portugal (Garcia et al., 2005). 247
No validation to the sea level data was applied here because the calibrated time series 249
(Sebastiao et al., 2008) are the only available in the area for the reanalysis period. The sea 250
level reanalysis carried out for the HIPOCAS data along the coasts of the Iberian 251
Peninsula presented good results (Sebastiao et al., 2008). For example, in the area of the 252
Gulf of Cadiz (tidal station Seville) the results were under-predicting the observations 253
with a RMSE of 12.61only for the extreme peak of the storms. This discrepancy could be 254
due to the tidal gauge location (close to estuary mouth) where the measured water levels 255
are locally affected by the river discharge; however, this do not influence the general 256
surge level on the continental shelf (Laiz et al., 2013). 257
258
3.3 Data analysis
259
The corrected time series were used to calculate the monthly, seasonal and annual values 260
of the wave heights and directions and sea level in order to identify the wave climatology 261
in the area. Furthermore, storminess indices were calculated on a monthly basis in order 262
to be compared with climatic indices. The wave storminess indices obtained were: the 263
number of individual storms per month (storm number, SN); the storm significant wave 264
height Hst which corresponds to the monthly average (𝐻𝐻𝑠𝑠���) of wave heights (Hs) for the 265
values above the threshold (Hth) 266
𝐻𝐻𝑠𝑠𝑠𝑠 = 𝐻𝐻��� |𝐻𝐻𝑠𝑠𝑠𝑠 > 𝐻𝐻𝑠𝑠ℎ 267
Finally, the number of hours when the storm threshold was exceeded divided by the total 268
number of hours per month (Storm Duration Ratio, SDR) was also calculated 269 270 𝑆𝑆𝑆𝑆𝑆𝑆 =∑𝑁𝑁𝑖𝑖=1𝑡𝑡∑𝑖𝑖|𝐻𝐻𝑖𝑖 > 𝐻𝐻𝑠𝑠ℎ 𝑡𝑡𝑖𝑖 𝑁𝑁 𝑖𝑖=1 271
where N is the number of model output per month and Hthis the storm threshold. For both 272
indices the wave height threshold and storm independence criteria remained the same as 273
in the POT analysis. SDR is a value similar to the percentage of run length introduced by 274
Feng et al. (2014a). Additionally the total storm energy per month was calculated as the 275
sum of wave energy above the storm threshold. 276
277
The computed indices were correlated with the climatic indices that influence weather 278
patterns over Europe, namely the North Atlantic Oscillation (NAO), the East Atlantic 279
Pattern (EA), the Scandinavia Pattern (SCAN) and the Polar/ Eurasia Pattern (POL). The 280
monthly data corresponding to the HIPOCAS dataset were obtained from NOAA climate 281
centre and were calculated from the rotated EOF of the 500 hPa geopotential height. The 282
SCA and POL did not present any significant correlation; hence the results are not 283
presented. Significant differences between two correlation coefficients were tested using 284
the Fisher r-to-z transformation (Fisher, 1970). This method converts first each 285
correlation coefficient into a z-score. Then, making use of the sample size employed to 286
obtain each coefficient; these z-scores are compared. 287
288
Furthermore, a detailed study of surge levels given a specific wave height (fS|Hs) was 289
studied at a storm event timescale. For the joint probability estimation of the residual sea 290
level (SLres) and Hsc were jointly used in POT analysis. For each storm event identified 291
by the POT analysis the peak Hsc and peak SLres were selected in order to construct a 292
contingency table. Tidal variations were not taken into account since in the Iberian 293
Peninsula tidal–surge energy transfer is low (Ratsimandresy et al., 2008). Combined 294
wave and SLres probability function (fSLres,Hs) events was undertaken parting from the 295
assumption that the surge elevation probability function (fS) is not independent of the 296
significant wave height probability function (fHs) for waves above the threshold. 297
298
𝑓𝑓𝐻𝐻𝑠𝑠,𝑅𝑅𝑆𝑆𝐿𝐿(𝐻𝐻𝐻𝐻, 𝑆𝑆𝑆𝑆𝑅𝑅) = 𝑓𝑓𝑅𝑅𝑆𝑆𝐿𝐿|𝐻𝐻𝑠𝑠(𝑆𝑆𝑆𝑆𝑅𝑅|𝐻𝐻𝐻𝐻). 𝑓𝑓𝐻𝐻𝑠𝑠(𝐻𝐻𝐻𝐻)
For the calculation of join probability the initial POT analysis results were used in order 299
to construct a contingency table with storm events and the associated SLres. 300
301
4. Results and Discussion
302 303 304 305
4.1 Wave and Residual Sea Level Climate
The mean annual cycle for the corrected significant wave height (Hsc) and the associated 307
wave directions for the coastal area of the northern Gulf of Cadiz are presented in Figure 308
5a and 5b. The average wave heights over the area are higher during the winter months 309
and part of the autumn. From the comparison of corrected significant wave heights (Hsc) 310
and their associated directions it can be seen that there is a high energy period starting in 311
November and extending up to March, when the mean wave heights are higher (Hsc ≈ 312
1m) and from more southerly directions. The same pattern is present for all stations with 313
some differences in Huelva and Seville where the mean significant wave height is lower 314
and mean direction of propagation has a stronger southern component, due to the shelter 315
effect of the Cape St Vincent. These values classify the coastline as a mixed energy, 316
wave-dominated coast according to (Davis and Hayes, 1984). Over the rest of the year 317
mean wave height is significantly lower with more westerly directions. This annual 318
variability represents the typical wave climatology of the region. Based on the above 319
results the wave climate in the Gulf of Cadiz can be separated in a storm (November - 320
March) and a calm (April - October) season. These results are in agreement with previous 321
wave climate studies (Dodet et al., 2010; Lozano et al., 2004) on the area and with the 322
seasonal morphological behaviour of the beach (Benavente et al., 2002). In terms of peak 323
period (Tp, Figure 5c) the seasonal pattern is repeated with higher values of Tp during the 324
storm season and lower ones during the calm season. All stations present the same mean 325
monthly values with the only difference of Huelva (the most protected station) where Tp 326
values are smaller. 327
328
On the other hand the monthly residual sea level (SLres) variation (Figure 5d) presents an 329
inverse image, with higher SLres during the calm period and lower values during the 330
storm period. These results are in agreement with previous analysis of SLres records in 331
the area that show a seasonal cycle with a minimum in February and a maximum in 332
October, consistent with atmospheric pressure forcing in this region (Laiz et al., 2013). 333
The SLres annual signal ranges between about 4–6/5–6 cm from tide gauges/altimeter 334
measurements, respectively, the latter always showing slightly larger amplitudes 335
(Gomez-Enri et al., 2012; Laiz et al., 2013; Marcos et al., 2011; Marcos and Tsimplis, 336
2007). 337
338
4.2 Correlations with climate indices
339
The inter-annual variability of the storm significant wave height and storminess indices 340
did not show significant correlation with climatic indices. These results have been 341
reported before for the Faro station and NAO (Almeida et al., 2011) and seem to extend 342
over the entire Gulf of Cadiz. Other studies have concluded that the inter-annual 343
variability of Hs is partially controlled by NAO (Dodet et al., 2010; Woolf et al., 2002) 344
but Bertin et al. (2013) show that this relationship has a large spatial variability that 345
results in non-significant correlations over the Gulf of Cadiz. Also the same studies 346
concluded that no linear trend is present for Hs over the study area. This paper is focusing 347
on the monthly variability both for the storm and calm period as well as their 348
climatological anomalies. 349
350
Both the storm mean monthly values (mean value of significant wave height that exceeds 351
the storm threshold, 1.5 m) and their anomalies for the whole year and for the storm 352
seasons were tested against all indices that are linked with climate variability over 353
Europe, in order to investigate possible correlations with the wave parameters and SLres 354
in the Gulf of Cadiz. Significant correlations were obtained for the NAO and EA pattern. 355
Data showed correlation between the annual Hsc and NAO for all sites with values 356
between -0.27 for Faro and -0.34 for Seville, increasing for the storm season months to 357
values of around -0.58 (Table 1, Figure 6). However, the correlations between the mean 358
monthly anomalies and NAO show significant increase (p<0.01) for the full year where 359
the correlation coefficient almost doubles, suggesting that NAO has an effect on the wave 360
variability that prevails during calm season as well. This variability could be due to 361
waves formed by local wind or to swell field being determined by the NAO over the 362
North Atlantic. This can have implications on the medium term shoreline evolutions 363
since the wave period characteristics during the calm season are responsible for the beach 364
accretion and recovery after the storms. For the storm season the anomaly correlations are 365
also higher but differences are small and not statistically significant. In terms of spatial 366
distributions there are no significant differences observed for the various locations 367
between NAO and the annual Hs for all cases. The physical explanation of the above 368
correlations could be attributed to the higher abundance of low pressure systems and the 369
increase in wind speed linked with the NAO and attributed to the southern shift of the 370
Atlantic storm tracks (Dodet et al., 2010; Keim et al., 2004). 371
372
Significant correlations but with low correlation coefficient values were observed 373
between NAO and monthly wave directions for the full year; the best correlation was 374
observed in Huelva but the coefficient did not exceed -0.20. Over the storm season 375
correlations did not improve but the significance levels decreased due to the lower 376
number of observations (220 instead of 528) that influences the degrees of freedom of the 377
correlations. The spatial distribution again did not show any significant variation. 378
379
The residual water levels also presented strong correlations with NAO especially during 380
the storm season months, showing a high correlation value between mean storm residual 381
water levels and NAO (-0.66 on average, p<0.01). These results are in agreement with 382
previous studies in the area using the same reanalysis data for southern Europe (Marcos 383
et al., 2009). The main mechanism that drives the residual sea level response to the NAO 384
is both hydrostatic and non-hydrostatic (Woolf et al., 2003). Considering this, the 385
correlation between mean storm residual water level and NAO is possibly related to the 386
fact that the HIPOCAS dataset includes both processes, as it was modelled using a 387
barotropic version of the HAMSOM model (Ratsimandresy et al., 2008). All correlations 388
have a negative sign because wave height and residual sea level increase with negative 389
NAO values (Table 1). 390
391
For the case of EA the above parameters explain a small but statistically significant part 392
of the variability (Table 2) among which the most pronounced is that of the significant 393
wave height during the storm months. In all cases the correlation coefficients were 394
smaller than with NAO, as expected, since the EA is the second prominent mode of low-395
frequency variability over the North Atlantic (Barnston and Livezey, 1987). For this 396
index the correlations are positive for wave height and direction but negative for SLres. 397
Positive EA values are responsible for zonally extended storm tracks that affect the 398
southern coasts of Europe (Wettstein and Wallace, 2010). Significant differences between 399
stations were only present for wave height correlations, where the lowest value obtained 400
(Huelva) was significantly different from the rest of the stations. 401
402
Correlations between wave directions during storms were stronger in the case of EA than 403
with the NAO. Correlations were positive with mean values around 0.20 to 0.3 and were 404
constant both for mean values and anomalies (Table 2). Apart from these correlations, 405
EA index presented negative correlations (between -0.36 and -0.46) with the wave 406
direction standard deviation during the storm season (Figure 7). These correlations 407
suggest a focusing of the storm around west direction during the positive EA and a 408
greater dispersion during negative EA. This dispersion is represented in the Gulf of Cadiz 409
with increased southern direction because of the negative skewness inherited to the data 410
by the coastline orientation. 411
412
Because the NAO and the EA represent different modes of the atmospheric variability i.e. 413
the percentage of variability expressed by the two indices is uncorrelated, the above 414
results suggest that storminess during negative NAO and positive EA phases can be 415
further increased. However, on a seasonal scale the indices can be correlated; hence, part 416
of the explained variance can be common (Martinez-Asensio et al., 2014). The physical 417
mechanism during NAO-negative and EA-positive phases is that the orientation of the 418
boundary between the positive and negative pressure anomalies crosses the North 419
Atlantic from northwest (60N, 60W) to southeast (45N, 10W), which is likely to 420
influence the meridional circulation intensity (Nesterov, 2009) and direct the storm tracks 421
towards south Europe and into the Gulf of Cadiz. Furthermore, average wind during 422
winter NAO-negative and EA-positive phases reveals patterns of westerly wind 423
(Martinez-Asensio et al., 2014) that can induce a net mass flux in the Gulf of Cadiz and 424
at the same time generate increased Hs (Fukumori et al., 2007). Similar average wind 425
patterns are also generated during positive SCAN phases but with a more pronounced 426
northern component; however, any generated waves by this wind pattern are not affecting 427
the northern part of the Gulf of Cadiz due to the sheltering effect of the Cape St. Vincent. 428
Apart from the mean monthly values and anomalies, specific storm indices calculated 430
above were also correlated with the climatic indices. Similar correlations (0.52 and -431
0.43, p<0.01) were obtained between the SDR, which is a measure of the total time of the 432
Atlantic oriented storm activity per month, and the NAO for the storm season (Figure 8). 433
Higher values are observed for the more exposed stations (Faro, Cadiz and Zahara). 434
Special cases for the Atlantic storms were selected by gradually restricting the direction 435
of the incoming storm to pure westerly directions (data not shown). For these cases the 436
correlation coefficients remain practically unchanged in all stations except Seville and 437
Huelva, where the number of events drops dramatically due to the sheltering effect. The 438
Storm number also presented similar patterns to the SDR both in terms of NAO 439
correlations and spatial variability (data not shown). 440
441
The monthly storm wave height (Hst) obtained from individual storms produced a weaker 442
correlation (-0.41, p<0.01) with NAO over the storm season. Similar results were 443
obtained for the total energy of the storm waves for each month where the correlation 444
coefficient with NAO was -0.45 (p<0.01). However the correlation between SDR and the 445
mean monthly Hs was of the order of -0.90 for the study area, with no significant 446
variations between the stations. The above results suggest that although negative NAO 447
values increase the storminess over the study area, they do not control the magnitude of 448
the wave height which is probably affected by synoptic atmospheric patterns. On the 449
other hand there is a correlation with the number and total storm duration arriving to the 450
Gulf of Cadiz. Similar results were presented for the Norwegian Sea where no statistical 451
correlation was obtained between NAO and waves with low probability of exceedance 452
(largest waves) (Feng et al., 2014b); however it has to be noted that NAO correlations 453
with the largest 1% of Hs can reach r=0.83 over the Northwest of Scotland (Wang and 454
Swail, 2001; 2002) but these correlations present large spatial variation over the North 455 Atlantic. 456 457 4.3 Joint Probability 458
Despite the opposite seasonal pattern followed by the Hsc and the SLres presented in 459
Figure 4, sea level values during storms were found to deviate substantially from the 460
average seasonal cycle especially during the storms. The joint probability between these 461
parameters is presented in Figure 9, with similar patterns observed at all stations. A large 462
proportion of the events identified by the POT (50%) correspond to relatively low energy 463
events (<2.5 m Hsc), for which the SLres showed a large spread that is mainly 464
concentrated in positive values between 0 and 15cm. For the rest of the events a clear 465
trend is obtained where higher wave heights are observed together with positive SLres, 466
with values up to 35 cm for the extreme wave height events of 4-6.5 m that have a return 467
period in the area of Cadiz between 3 and 4 years respectively (Del Rio et al., 2012). 468
469
The stations of Seville and Huelva that are situated at the shadow zone of the Cape St. 470
Vincent receive less storm activity both in terms of number and magnitude but follow the 471
same probability patterns as the rest of the area. Besides, this zone shows the highest 472
values of storm surge probably due to the larger width of the continental shelf. In contrast 473
the areas of Zahara and Faro that are characterised by a relatively narrower continental 474
shelf present much lower surges for the similar or higher wave heights. These results 475
show dependence between the SLres and the peak storm Hsc and have wide implications 476
on the coastal hazards and the associated risk of coastal erosion and inundations of the 477
coastal plain (Del Rio et al., 2012). 478
479
In accordance with the correlation presented above between the storm variables and 480
NAO, the joint probability analysis was undertaken separately for positive and negative 481
NAO events. In general the ratio between storm events occurred during a positive NAO 482
and events occurred during a negative NAO phase is close to 1 for all sites (Table 3). For 483
NAO phases with an index higher/lower than +/-1 and +/-1.5 it can be seen that the 484
negative NAO phases present almost twice the events than the positive ones for the 485
central part of the Gulf (Seville and Huelva). On the contrary the two sites located at the 486
extremities of the Gulf of Cadiz (Faro and Zahara) do not show this pattern. This is partly 487
due to the strong easterly winds that can also create short-fetch storms for these areas, 488
such events are more frequent during positive NAO (Dorman et al., 1995). These events 489
are present in the wave record of Zahara due to the proximity to the Strait of Gibraltar 490
and in Faro due to the orientation of the coastline and the considerable easterly fetch. 491
Differences are not present in extreme NAO phases (-2 > NAO > +2) probably due to the 492
small number of events (Table 3). 493
494
The joint probability analysis for positive and negative NAO events with index 495
higher/lower than ±1.5 is presented in Figure 10, where it can be seen that during strong 496
positive and negative phases of NAO the joint probability of the wave–surge follows a 497
different pattern. Positive NAO events (Figure 10 left panels) are concentrated in weak 498
storm events (Hsc<2.5m) with mainly small SLres. On the other hand, for the negative 499
NAO events (Figure 10 right panels) the same pattern that was observed in the full data 500
analysis is repeated with a positive trend between storm wave heights and SLres. The 501
above results corroborate with the NAO correlations of Table 1; where during storm 502
season Hsc and SLres show significant correlations with NAO. 503
504
The joint probability results emphasize the importance of the NAO on coastal hazards. 505
The Hs and storm surge height drive the morphological evolution and coastal hazard 506
estimation in the Gulf of Cadiz shores according to Del Rio et al. (2012). This way, 507
severe coastal erosion and flooding events have been recorded in the area during negative 508
NAO phases, with a great socioeconomic impact. This impact is related to both direct 509
damage to coastal infrastructure and undesirable morphological changes in the coastal 510
area, such as long-term reduction in beach width or damage to dune ridges (Del Rio et al. 511
2012). One of the most significant periods in this respect occurred in the 2009-2010 512
winter season, when a peak in negative NAO index over the last 190 years was recorded 513
(Osborn, 2011). In that period a number of energetic storm events caused widespread 514
beach and dune recession and coastal flooding along the Gulf of Cadiz (Benavente et al., 515
2013; Del Rio et al., 2010; Rangel-Buitrago and Anfuso, 2013; Vousdoukas et al., 2012). 516
Maximum wave heights of up to 8.4m were observed and SLres up to 0.50m were 517
recorded at the tidal station of Cadiz. In terms of Hs the storm had a return period of 518
20years; however, taking into account the prolonged duration of the storm (more than 20 519
days of storm conditions) the total event as a group of storms should have a much greater 520
return period according to Ferreira (2006). The associated damage on coastal assets 521
generated important economic losses, which for instance in Cadiz city beaches were 522
around 157,000 € (Lopez-Doriga et al., 2010) For this reason, the fact that Hs and storm 523
surge height have a high joint probability especially during the negative NAO phases is 524
of great importance and can be very useful at the design stage of coastal protection 525
systems and civil protection plans. 526
527
5. Conclusions
528 529
Reanalysis of wave and sea level data for a period of 44 years (HIPOCAS data) were 530
used to investigate the connection between large scale atmospheric circulation patterns 531
(NAO, EA) and the wave climate and sea level in the Gulf of Cadiz. Significant 532
improvement of the storm wave record was obtained after applying correction functions 533
derived from the coastal wave buoys in the area of Cadiz and Faro. In general, the 534
HIPOCAS data correctly represented the directional storm climate in the Gulf of Cadiz 535
and mainly the one coming from the northwestern Atlantic. The locally accelerated 536
easterly winds in the area of the Strait of Gibraltar are not well represented due to the 537
relative large scale of the re-analysis data. However, these events are not affecting storm-538
related hazards along the coastline of the study area except for the zone of Faro, as they 539
are mostly related to high atmospheric pressure situations; furthermore, shoreline 540
orientation and short fetch determine a negligible impact of easterly waves along the 541
northeastern coast of the Gulf of Cadiz. 542
543
In terms of wave activity two seasons can be distinguished: the storm and the calm 544
season. The former extends from November to March and shows higher mean monthly 545
significant wave height and distinguishable wave period and direction than the calm 546
season. Based on these results further analysis was undertaken following the above 547
seasonal pattern and not the atmospheric season convention. NAO presented negative 548
correlations with the monthly parameters of the storm season. When the mean wave 549
climatology was subtracted from the data this correlation was extended to the entire year 550
(anomalies) suggesting influence of the NAO to the calm wave conditions . Positive 551
correlations were obtained with the EA pattern that probably represents the zonal 552
extension of the storm tracks over the study area during positive EA phases. Better 553
correlations were identified for the total storm hours (Storm Index) and the residual mean 554
sea level but not with the maximum wave height. The above results suggest that although 555
negative NAO values increase the storminess over the study area they do not control the 556
magnitude of the wave height, which is probably affected by mesoscale atmospheric 557
patterns. The combined NAO and EA patterns explain a large part of the mean wave 558
variability, also positive EA patterns are correlated with more westerly directions of the 559
storm waves. 560
561
Joint probability analyses showed dependence between storm conditions and positive 562
residual mean sea level on the basis of 367 events. This dependence is more pronounced 563
over storm events with large wave heights. Study of storm events over distinct NAO 564
index values showed a dominance of storm events during negative NAO phases. At 565
extreme negative NAO phases the coexistence of large SLres and large storm events are 566
present. This is not the case in positive NAO phases, where small storm events are 567
present with disperse SLres response. In terms of coastal hazards and risk the coexistence 568
of storm events and high SLres can potentially increase the vulnerability of the coastal 569
areas to erosion and/or flooding episodes. The fact that these two parameters have a high 570
joint probability especially during the negative NAO phases is of great importance and 571
can be very useful at the design stage of coastal protection systems and civil protection 572
plans. Furthermore, such result provides valuable information for understanding and 573
reconstructing the long-term coastline evolution of the Gulf of Cadiz due to the long 574
record of NAO index. 575
576
Acknowledgments 577
The authors would like to acknowledge Puertos del Estado for providing the wave buoy 578
data for the coastal area of Cadiz, and CEDEX for providing the HIPOCAS data. This 579
work has been supported by the MICORE project (EU grant FP7-ENV-2007-1-202798, 580
the GERICO project (CGL2011-25438) and the RISCKIT project (Resilience-Increasing 581
Strategies for Coasts - toolKIT", EU grand number 603458, www.risckit.eu). IL was 582
financially supported by the Spanish Ministry of Science and Technology ("Juan de la 583
Cierva Programme", the project ALCOVA (CTM2012-37839) and by the research group 584
RNM-337 of the PAI. TAP, JB and LdR were also supported by the research group 585
RNM-328 of the PAI. The contribution of the two reviewers in the improvement of the 586
manuscript is greatly acknowledged. 587 588 589 6. References 590 591
Allan, J.C. and Komar, P.D., 2000. Are ocean wave heights increasing in the eastern
592
North Pacific? Eos, Transactions, American Geophysical Union, 47: 561-567.
593
Almeida, L.P., Ferreira, O., Vousdoukas, M.I. and Dodet, G., 2011. Historical
594
variation and trends in storminess along the Portuguese South Coast. Nat.
595
Hazards Earth Syst. Sci., 11(9): 2407-2417.
596
Almeida, L.P., Vousdoukas, M.V., Ferreira, O., Rodrigues, B.A. and Matias, A.,
597
2012. Thresholds for storm impacts on an exposed sandy coastal area in
598
southern Portugal. Geomorphology, 143-144(0): 3-12.
599
Anderson, T.R., Frazer, L.N. and Fletcher, C.H., 2010. Transient and persistent
600
shoreline change from a storm. Geophys. Res. Lett., 37(8): L08401.
601
Bacon, S. and Carter, D.J.T., 1991. Wave climate changes in the North-Atlantic and
602
North-Sea International Journal of Climatology, 11(5): 545-558.
603
Barnston, A.G. and Livezey, R.E., 1987. Classification, Seasonality and Persistence
604
of Low-Frequency Atmospheric Circulation Patterns. Monthly Weather
605
Review, 115(6): 1083-1126.
606
Benavente, J., Del Río, L., Anfuso, G., Gracia, F.J. and Reyes, J.L., 2002. Utility of
607
morphodynamic characterization in the prediction of beach damage by
608
storms. Journal of Coastal Research, SI36,: 56-64
609
Benavente, J., del Rio, L., Plomaritis, T.A. and Menapace, W., 2013. Impact of
610
coastal storms in a sandy barrier (Sancti Petri, Spain). In: Conley, DC,
611
Masselink, G., Russell, PE and O'Hare, TJ (eds.), Proceedings 12th
612
International Coastal Symposium, Journal of Coastal Research, Special Issue
613
No. 65: pp. 666-671, ISSN 0749-0208.
614
Benavente, J., Gracia, F.J. and Lopez-Aguayo, F., 2000. Empirical model of
615
morphodynamic beachface behaviour for low-energy mesotidal
616
environments. Marine Geology, 167(3-4): 375-390.
617
Bertin, X., Prouteau, E. and Letetrel, C., 2013. A significant increase in wave height
618
in the North Atlantic Ocean over the 20th century. Global and Planetary
619
Change, 106(0): 77-83.
620
Carter, D.J.T. and Draper, L., 1988. Has the north-east Atlantic become rougher?
621
Nature, 332(6164): 494-494.
622
Cooper, J.A.G., Jackson, D.W.T., Navas, F., McKenna, J. and Malvarez, G., 2004.
623
Identifying storm impacts on an embayed, high-energy coastline: examples
624
from western Ireland. Marine Geology, 210(1-4): 261-280.
Criado-Aldeanueva, F., Garcia-Lafuente, J., Navarro, G. and Ruiz, J., 2009.
626
Seasonal and interannual variability of the surface circulation in the eastern
627
Gulf of Cadiz (SW Iberia). Journal of Geophysical Research-Oceans, 114.
628
Davis, R.A. and Hayes, M.O., 1984. What is a wave-dominated coast? Marine
629
Geology, 60(1-4): 313-329.
630
Del Rio, L., 2007. Riesgos de erosión costera en el litoral atlántico gaditano. Ph.D.
631
Thesis, University of Cadiz, 485 p.
632
Del Rio, L., Plomaritis, T.A., Benavente, J., Valladares, M. and Ribera, P., 2012.
633
Establishing storm thresholds for the Spanish Gulf of Cadiz coast.
634
Geomorphology, 143-144(0): 13-23.
635
Del Rio, L. et al., 2010. The impact of two different storm seasons on a natural
636
beach of the Gulf of Cádiz (Spain): high versus low energy events,
637
Geophysical Research Abstracts 12, pp. 15118. EGU2010.
638
Dodet, G., Bertin, X. and Taborda, R., 2010. Wave climate variability in the
North-639
East Atlantic Ocean over the last six decades. Ocean Modelling, 31(3-4):
120-640
131.
641
Dorman, C.E., Beardsley, R.C. and Limeburner, R., 1995. Winds in the Strait of
642
Gibraltar. Quarterly Journal of the Royal Meteorological Society, 121:
1903-643
1921.
644
Dupuis, H., Michel, D. and Sottolichio, A., 2006. Wave climate evolution in the Bay
645
of Biscay over two decades. Journal of Marine Systems, 63(3-4): 105-114.
646
Efthymiadis, D., Hernandez, F. and Le Traon, P.Y., 2002. Large-scale sea-level
647
variations and associated atmospheric forcing in the subtropical north-east
648
Atlantic Ocean. Deep-Sea Research Part Ii-Topical Studies in Oceanography,
649
49(19): 3957-3981.
650
Emery, W.J. and Thomson, R.E., 2001. Data Analysis Methods in Physical
651
Oceanography (second edition revised). Elsevier Science, Amsterdam.
652
Feng, X., Tsimplis, M.N., Quartly, G.D. and Yelland, M.J., 2014a. Wave height
653
analysis from 10 years of observations in the Norwegian Sea. Continental
654
Shelf Research, 72(0): 47-56.
655
Feng, X., Tsimplis, M.N., Yelland, M.J. and Quartly, G.D., 2014b. Changes in
656
significant and maximum wave heights in the Norwegian Sea. Global and
657
Planetary Change, 113(0): 68-76.
658
Fenster, M.S., Dolan, R. and Morton, R.A., 2001. Coastal storms and shoreline
659
change: Signal or noise? Journal of Coastal Research, 17(3): 714-720.
660
Ferreira, O., 2006. The role of storm groups in the erosion of sandy coasts. Earth
661
Surface Processes and Landforms, 31(8): 1058-1060.
662
Fisher, R.A., 1970. Statistical Methods for Research Workers. Oliver & Boyd.
663
Garcia, T., Ferreira, O., Matias, A. and Dias, J.A., 2005. Coastal Hazards
664
Representation for Praia do Barril (Algarve, Portugal). Journal of Coastal
665
Research: 28-33.
666
Gomez-Enri, J., Aboitiz, A., Tejedor, B. and Villares, P., 2012. Seasonal and
667
interannual variability in the Gulf of Cadiz: Validation of gridded altimeter
668
products. Estuarine Coastal and Shelf Science, 96: 114-121.
669
Gomez Lahoz, M. and Carretero Albiach, J.C., 2005. Wave forecasting at the
670
Spanish coasts. Journal of Atmospheric & Ocean Science, 10(4): 389-405.
Harley, M.D., Turner, I.L., Short, A.D. and Ranasinghe, R., 2009. Interannual
672
variability and controls of the Sydney wave climate. International Journal of
673
Climatology, 30(9): 1322-1335.
674
Jackson, D.W.T., Cooper, J.A.G. and del Rio, L., 2005. Geological control of beach
675
morphodynamic state. Marine Geology, 216(4): 297-314.
676
Kalnay, E. et al., 1996. The NCEP/NCAR 40-year reanalysis project. Bulletin of the
677
American Meteorological Society, 77(3): 437-471.
678
Kamphuis, J.W., 2000. Introduction to Coastal Engineering and Management.
679
Advanced Series on Ocean Engineering, Vol. 16. World Scientific Publishing,
680
Singapore, 437 pp.
681
Keim, B.D., Muller, R.A. and Stone, G.W., 2004. Spatial and temporal variability of
682
coastal storms in the North Atlantic Basin. Marine Geology, 210(1-4): 7-15.
683
Kundu, P.K., 1976. Ekman Veering Observed near the Ocean Bottom. Journal of
684
Physical Oceanography, 6(2): 238-242.
685
Laiz, I., Gomez-Enri, J., Tejedor, B., Aboitiz, A. and Villares, P., 2013. Seasonal sea
686
level variations in the gulf of Cadiz continental shelf from in-situ
687
measurements and satellite altimetry. Continental Shelf Research, 53: 77-88.
688
List, J.H., Farris, A.S. and Sullivan, C., 2006. Reversing storm hotspots on sandy
689
beaches: Spatial and temporal characteristics. Marine Geology, 226(3-4):
690
261-279.
691
Lopez-Doriga, U., Benavente, J. and Plomaritis, T.A., 2010. Natural recovery
692
processes in an urban beach, La Victoria (Cádiz, SW Spain). In Hmimsa Y.
693
et al. (eds.): Book of abstracts - 1er Colloque International Littoraux
694
Méditerranéens: états passés, actuels et futurs.
695
Loureiro, C., Ferreira, O. and Cooper, J.A.G., 2013. Applicability of parametric
696
beach morphodynamic state classification on embayed beaches. Marine
697
Geology, 346: 153-164.
698
Lozano, I., Devoy, R.J.N., May, W. and Andersen, U., 2004. Storminess and
699
vulnerability along the Atlantic coastlines of Europe: analysis of storm
700
records and of a greenhouse gases induced climate scenario. Marine Geology,
701
210(1-4): 205-225.
702
Marcos, M., Jordá, G., Gomis, D. and Pérez, B., 2011. Changes in storm surges in
703
southern Europe from a regional model under climate change scenarios.
704
Global and Planetary Change, In Press, Corrected Proof.
705
Marcos, M. and Tsimplis, M.N., 2007. Variations of the seasonal sea level cycle in
706
southern Europe. Journal of Geophysical Research-Oceans, 112.
707
Martinez-Asensio, A. et al., 2014. Impact of the atmospheric climate modes on
708
Mediterranean sea level variability. Global and Planetary Change, 118(0):
1-709
15.
710
Medina, J.M., 1991. La flecha de El Rompido en la dinámica litoral de la costa
711
onubense. Ingeniería Civil, 80, : 105-110.
712
Mendez, F.J., Menendez, M., Luceno, A. and Losada, I.J., 2006. Estimation of the
713
long-term variability of extreme significant wave height using a
time-714
dependent Peak Over Threshold (POT) model. Journal of Geophysical
715
Research-Oceans, 111(C7).
Morris, B.D., Davidson, M.A. and Huntley, D.A., 2001. Measurements of the
717
response of a coastal inlet using video monitoring techniques. Marine
718
Geology, 175(1-4): 251-272.
719
Morton, R.A., Gibeaut, J.C. and Paine, J.G., 1995. Mesoscale transfer of sand
720
during and after storms - Implications for prediction of shoreline movement.
721
Marine Geology, 126(1-4): 161-179.
722
Nesterov, E.S., 2009. East Atlantic oscillation of the atmospheric circulation.
723
Russian Meteorology and Hydrology, 34(12): 794-800.
724
O'Connor, M.C., Cooper, J.A.G. and Jackson, D.W.T., 2011. Decadal Behavior of
725
Tidal Inlet-Associated Beach Systems, Northwest Ireland, in Relation to
726
Climate Forcing. Journal of Sedimentary Research, 81(1): 38-51.
727
Osborn, T., 2011. Winter 2009/2010 temperatures and a record-breaking North
728
Atlantic Oscillation index. Weather, 66(1): 19-21.
729
Ranasinghe, R., McLoughlin, R., Short, A. and Symonds, G., 2004. The Southern
730
Oscillation Index, wave climate, and beach rotation. Marine Geology,
731
204(3–4): 273-287.
732
Rangel-Buitrago, N. and Anfuso, G., 2013. Winter wave climate, storms and
733
regional cycles: the SW Spanish Atlantic coast. International Journal of
734
Climatology, 33(9): 2142-2156.
735
Ratsimandresy, A.W., Sotillo, M.G., Carretero Albiach, J.C., Αlvarez Fanjul, E. and
736
Hajji, H., 2008. A 44-year high-resolution ocean and atmospheric hindcast
737
for the Mediterranean Basin developed within the HIPOCAS Project.
738
Coastal Engineering, 55(11): 827-842.
739
Ribera, P. et al., 2011. Reconstruction of Atlantic historical winter coastal storms in
740
the Spanish coasts of the Gulf of Cadiz, 1929-2005. Nat. Hazards Earth Syst.
741
Sci., 11(6): 1715-1722.
742
Roelvink, D. et al., 2009. Modelling storm impacts on beaches, dunes and barrier
743
islands. Coastal Engineering, 56(11-12): 1133-1152.
744
Rogers, J.C., 1997. North Atlantic Storm Track Variability and Its Association to
745
the North Atlantic Oscillation and Climate Variability of Northern Europe.
746
Journal of Climate, 10(7): 1635-1647.
747
Sebastiao, P., Guedes Soares, C. and Alvarez, E., 2008. 44 years hindcast of sea level
748
in the Atlantic Coast of Europe. Coastal Engineering, 55(11): 848.
749
Short, A.D., Tremblanis, A.C. and Turner, I.L., 2000. Beach oscillation, rotation
750
and the Southern Oscillation, Narrabeen Beach, Australia, 27th
751
International Conference on Coastal Engineering. ASCE, Sydney, pp.
2439-752
2452.
753
Thomas, T., Phillips, M.R., Williams, A.T. and Jenkins, R.E., 2011. Short-term
754
beach rotation, wave climate and the North Atlantic Oscillation (NAO).
755
Progress in Physical Geography, 35(3): 333-352.
756
Tsimplis, M.N. and Shaw, A.G.P., 2008. The forcing of mean sea level variability
757
around Europe. Global and Planetary Change, 63(2-3): 196-202.
758
Tsimplis, M.N., Shaw, A.G.P., Flather, R.A. and Woolf, D.K., 2006. The influence of
759
the North Atlantic Oscillation on the sea-level around the northern European
760
coasts reconsidered: the thermosteric effects. Philosophical Transactions of
the Royal Society a-Mathematical Physical and Engineering Sciences,
762
364(1841): 845-856.
763
Van Dongeren, A. et al., 2014. RISC-KIT: Resilience-Increasing Strategies for
764
Coasts - toolkit. In: Green, A.N. and Cooper, J.A.G. (eds.), Proceedings 13th
765
International Coastal Symposium (Durban, South Africa), Journal of
766
Coastal Research, Special Issue No. 70: 366-371.
767
Vousdoukas, M.I., Almeida, L.P.M. and Ferreira, O., 2012. Beach erosion and
768
recovery during consecutive storms at a steep-sloping, meso-tidal beach.
769
Earth Surface Processes and Landforms, 37(6): 583-593.
770
WAMDI-Group, 1988. The WAM Model - A Third Generation Ocean Wave
771
Prediction Model. Journal of Physical Oceanography, 18(12): 1775-1810.
772
Wang, X.L. and Swail, V.R., 2001. Changes of Extreme Wave Heights in Northern
773
Hemisphere Oceans and Related Atmospheric Circulation Regimes. Journal
774
of Climate, 14(10): 2204-2221.
775
Wang, X.L. and Swail, V.R., 2002. Trends of Atlantic Wave Extremes as Simulated
776
in a 40-Yr Wave Hindcast Using Kinematically Reanalyzed Wind Fields.
777
Journal of Climate, 15(9): 1020-1035.
778
Wettstein, J.J. and Wallace, J.M., 2010. Observed Patterns of Month-to-Month
779
Storm-Track Variability and Their Relationship to the Background Flow*.
780
Journal of the Atmospheric Sciences, 67(5): 1420-1437.
781
Woolf, D.K., Challenor, P.G. and Cotton, P.D., 2002. Variability and predictability
782
of the North Atlantic wave climate. J. Geophys. Res., 107(C10): 3145.
783
Woolf, D.K., Shaw, A.G.P. and Tsimplis, M.N., 2003. The influence of the North
784
Atlantic Oscillation on sea-level variability in the North Atlantic region The
785
Global Atmosphere and Ocean System, 9(4): 145-167.
786 787 788 789 790 List of Tables 791 792
Table 1: Comparison of the correlation coefficients between mean monthly
793
values and anomalies and NAO index for wave height (Hsc), wave
794
direction (Dir) and residual sea level (SLres). Significance levels are
795
<99%.
796
Hannual Hstorm Dirannual Dirstorm SLresannual SLresstorm
Cadiz Mean Values -0.32 -0.58 -0.11 -0.136* -0.37 -0.67 Anomalies -0.43 -0.59 -0.12 -0.133* -0.42 -0.70 Faro Mean Values -0.27 -0.54 -0.09* - -0.36 -0.66
Anomalies -0.42 -0.56 -0.11* - -0.42 -0.70
Zahara Mean Values -0.28 -0.54 -0.10 -0.17 -0.37 -0.67 Anomalies -0.42 -0.56 -0.12 -0.17 -0.42 -0.70
Seville Mean Values -0.34 -0.60 -0.06* - -0.38 -0.65 Anomalies -0.44 -0.61 - - -0.42 -0.70
Huelva Mean Values -0.31 -0.61 -0.16 -0.22 -0.38 -0.67 Anomalies -0.43 -0.62 -0.20 -0.23 -0.42 -0.70 * Significance level of <95% 797 798 799 800
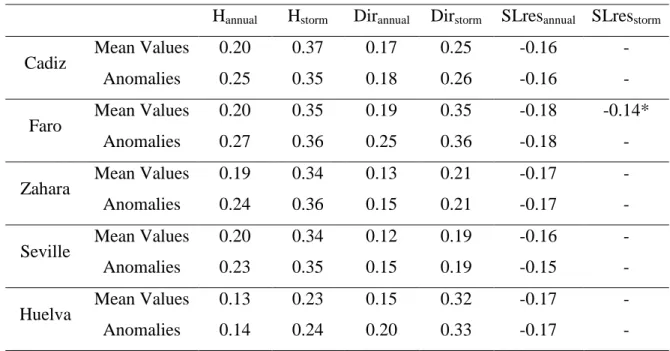
Table 2: Comparison of the correlation coefficients between mean monthly
801
values and anomalies and EA for wave height, wave direction and
802
residual sea level. Significance levels are <99%.
803
Hannual Hstorm Dirannual Dirstorm SLresannual SLresstorm
Cadiz Mean Values 0.20 0.37 0.17 0.25 -0.16 - Anomalies 0.25 0.35 0.18 0.26 -0.16 -
Faro Mean Values 0.20 0.35 0.19 0.35 -0.18 -0.14* Anomalies 0.27 0.36 0.25 0.36 -0.18 -
Zahara Mean Values 0.19 0.34 0.13 0.21 -0.17 - Anomalies 0.24 0.36 0.15 0.21 -0.17 -
Seville Mean Values 0.20 0.34 0.12 0.19 -0.16 - Anomalies 0.23 0.35 0.15 0.19 -0.15 -
Huelva Mean Values 0.13 0.23 0.15 0.32 -0.17 - Anomalies 0.14 0.24 0.20 0.33 -0.17 - * Significance level of <95%
804 805
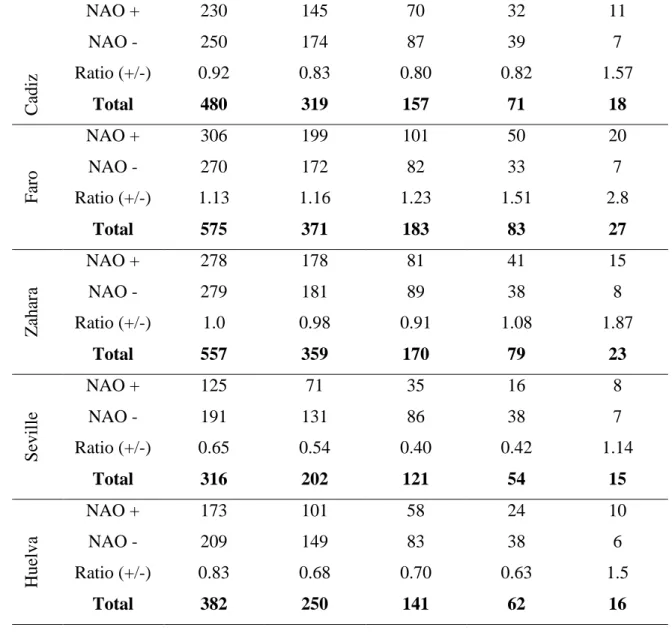
Table 3: Number of storm events identified for different positive and negative
806
NAO thresholds.
807
C ad iz NAO + 230 145 70 32 11 NAO - 250 174 87 39 7 Ratio (+/-) 0.92 0.83 0.80 0.82 1.57 Total 480 319 157 71 18 F ar o NAO + 306 199 101 50 20 NAO - 270 172 82 33 7 Ratio (+/-) 1.13 1.16 1.23 1.51 2.8 Total 575 371 183 83 27 Z ah ar a NAO + 278 178 81 41 15 NAO - 279 181 89 38 8 Ratio (+/-) 1.0 0.98 0.91 1.08 1.87 Total 557 359 170 79 23 S ev ille NAO + 125 71 35 16 8 NAO - 191 131 86 38 7 Ratio (+/-) 0.65 0.54 0.40 0.42 1.14 Total 316 202 121 54 15 H ue lva NAO + 173 101 58 24 10 NAO - 209 149 83 38 6 Ratio (+/-) 0.83 0.68 0.70 0.63 1.5 Total 382 250 141 62 16 808 809 810
List of Figures (Captions)
811 812
Fig. 1: Bathymetric map of the study area showing the HIPOCAS data points and
813
the location of the coastal buoys of Cadiz and Faro. Superimposed wave
814
rose presents the annual wave height (m) at the central part of the Gulf of
815
Cadiz.
816 817
Fig. 2: Comparison between modelled (HIPOCAS), measured (buoy), and 818
corrected data for significant wave height (Hs) for a) Cadiz and b) Faro.
819
Station locations in Figure 1
820 821
Fig. 3: Comparison of the difference between mean wave direction for the 822
corrected (HIPOCAS) and measured (buoy) data for 2001 for the buoys of
823
Cadiz (top panel) and Faro (bottom panel). Colour scale represents the
824
data density.
825 826
Fig. 4: Comparison between modelled (HIPOCAS), measured (buoy), and 827
corrected for the North-South and East-West components of significant
828
wave height for Cadiz (a, b) and Faro (c, d).
829 830
Fig. 5: Average seasonal cycle for the entire reanalysis period of: (a) Significant 831
wave height; (b) Mean wave direction; (c) Peak wave period and (d)
832
Residual mean sea level.
833 834
Fig. 6: Correlations between NAO index and mean monthly significant wave 835
height for all stations. Colour scale represents the data density.
836 837
Fig. 7: Correlations between EA index and wave direction standard deviation 838
during the storm months for all stations. Colour scale represents the data
839
density.
840 841
Fig. 8: Correlation between the Storm Index and the mean monthly significant 842
wave height. Colour scale represents the data density.
843 844
Fig. 9: Observed joint occurrence of storm wave heights and residual mean sea 845
level. Colour scale indicates the probability of occurrence.
846 847
Fig. 10: Observed joint probability distribution of storm wave heights and residual 848
mean sea level for: (a) storm events during NAO>+1.5 and (b) storm events
849
during NAO<-1.5. Colour scale represents the probability of occurrence.
850 851 852 853