THERMAL PERFORMANCE IN A
CONVENTIONAL FIREPLACE AND IN AN
INSET APPLIANCE
N. Sousa, M. C. Nunes, C. Santos
EST – Universidade do Algarve, Faro, Portugal
Abstract The objective of this study is to compare the performance of the equipment currently employed in the domestic heating with firewood, the conventional fireplace and the inset appliance with close firedoors. For such, it was followed the European Standard EN13229:2001/A2:2004. Efficiency and heat output is determined and the major heat losses that penalize the appliance performance are identified and calculated.
Tests in laboratory were developed in two inset appliances, and tests in situ in one conventional fireplace. One of the appliances uses only staging as primary air, and the other only grate air
In inset appliances, with a heat output near 10 kW, the average efficiency varies between 67% and 73%, while in a conventional fireplace that value lies at 30%. In all these devices the major losses take place as sensible heat in the flue gases,
23% to 30 % in inset appliances and above 50% in a conventional fireplace. The second most important heat loss happens by chemical losses in the flue gases.
It takes values near 17% in a conventional fireplace and may be disregarded in an inset appliance.
Keywords Inset appliance efficiency, fireplace efficiency, domestic heating
INTRODUCTION
The energetic consumption for heating represents an important share in the final energy consumption. The European Renewable Energy Council alerted to this reality. In Europe the final energy demand for heating is higher than for electricity or for transport. In fact it is almost equal to the sum of this last two [1].
Although the demand for heating is high, its exergetic value is low, by what it can be questionable the use of noble energy resources, like electricity or fuel, to satisfy this demand.
The use of fossil fuels has a lot of inconvenient, such as the scarcity of the resources, the environment effects and the dependence of exterior supply. The last one is even more worrying when the supply comes from countries with political instability or terrorist activity. The development of the biomass market is strategic since this does not only contribute to the reduction of CO2 emission but can also replace imported fuels by local jobs,
in the collect and processing of biomass or in the construction of conversion equipment, such as boilers, stoves and inset appliances.
Combustion of biomass to provide space heating is used since the man discovered fire. Today, beyond the equipments above mentioned the open fireplace still in use.
The main objective of this study is to compare the performance of the open fireplace with the performance of an inset appliance. To achieve this propose, it was followed the standard EN13229:2001/E2:2004 [2,3] that establishes the test procedure for the thermal performance of these equipments.
Tests in laboratory were developed in two inset appliances, and tests in
situ in one conventional open fireplace. It was chosen to do the tests of the
open fireplace not in laboratory but in a house equipped with this construction in order to quantify some parameters that were not referred by the test standard but considered that can not be disregarded. These are the thermal losses by air infiltration in the room and thermal losses in the chimney if this is located in an exterior wall of the room.
All combustion equipment operates in a batch process. One of the appliances uses only staging as primary air, and the other only grate air.
The laboratory is composed by a bench with 279 thermocouples, distributed in a trihedron that record the nearby temperature, precision scale to measure fuel consumption and combustion gases analyzer with continuous measuring. The exhaust draught is also controlled.
In the conventional fireplace testing, the fuel mass was only measured at the beginning and at the end of the test since it was not possible to use a scale bellow it. The nearby temperature was measured using thermograph equipment. Since part of the heat is exchanged along the chimney, from the fireplace till the ceiling, the chimney was equipped with thermocouples to register the flue behaviour inside it.
EFFICIENCY CALCULATION
Combustion in a conventional fireplace or even in an inset appliance using wood logs happens in a bath process. The European Standard EN13229:2001/E2:2004 summarizes the tests results in power and efficiency average values. That can be adequate to the product consumer, but is not sufficient for the manufacturer, who can use these results to improve its product. In this way, the calculus expressed in the standard was detailed to provide information for every instant of the batch process.
To achieve the efficiency, it were identified the losses terms in the system, that are respectively losses through sensible heat in the flue gases, chemical losses in the flue gases, losses through combustible constituents in the residue passing though the grate, heat losses in the chimney if this is located in an exterior wall of the room and losses through air infiltrations in the room. The last two terms are disregarded when using inset appliances, and are not considered in the standard EN13229:2001/E2:2004. To quantify these parcels equations and methods were derived.
The efficiency is obtained by:
) (
100− qa +qb+qr +qe+qi =
η
(1)The thermal looses by sensible heat, referred to the unit of mass of test fuel, through the flue gases are obtained by [2,3]:
u a a Q H q =100× / (2)
(
)
⎟⎟ ⎠ ⎞ ⎟ ⎠ ⎞ ⎜ ⎝ ⎛ × × + ⎜⎜ ⎝ ⎛ + ⎟⎟ ⎠ ⎞ ⎜⎜ ⎝ ⎛ + × − × × − = 100 H 9 92 . 1 CO CO 536 . 0 C C ) ( 2 2 W O CpmH Cpmd t t Q r rm a a (3)Where the specific heat of dry flue gases, Cpmd is calculated by:
⎟ ⎟ ⎠ ⎞ × ⎟ ⎟ ⎠ ⎞ ⎜ ⎜ ⎝ ⎛ ⎟ ⎠ ⎞ ⎜ ⎝ ⎛ × − × + + × ⎟ ⎟ ⎠ ⎞ ⎜ ⎜ ⎝ ⎛ ⎟ ⎠ ⎞ ⎜ ⎝ ⎛ × − × + ⎜ ⎜ ⎝ ⎛ + ⎟ ⎠ ⎞ ⎜ ⎝ ⎛ × + × + × = 100 1000 2 . 0 1000 19 . 0 03 . 0 100 1000 14 . 0 1000 19 . 0 085 . 0 1000 034 . 0 1000 008 . 0 361 . 0 6 . 3 2 2 2 2 CO t t CO t t t t Cpmd a a a a a a (4)
And the specific heat of water vapor CpmH2O is calculated by: ⎟ ⎟ ⎠ ⎞ ⎜ ⎜ ⎝ ⎛ ⎟ ⎠ ⎞ ⎜ ⎝ ⎛ + × + × = 2 2 1000 034 . 0 1000 038 . 0 414 . 0 6 . 3 ta ta O CpmH (5)
Other important losses parcel, qb, is due to the unburned fuel in the flue gases [2,3]. u b b Q H q =100× (6)
(
CO CO)
100 536 . 0 C C CO 12664 2 × + × − × × = r b Q (7)The losses due to combustible constituents in the residue passing through the grate are obtained by:
u r r Q H q = 100× (8) 100 R b 335× × = r Q (9)
Suggested by the standard test procedure [2,3], these heat losses, qr, represent 0.5 points of efficiency when using wood logs.
Considering that: 100 b R× ≈ r C (10) In this way: 33500 5 . 0 u r H C ≈ × (11)
The next terms are only considered with the conventional fireplace. They are not reported in the standard procedure, since when calculated in inset appliances with closed firedoors their value is very low.
In the case of fireplaces located in an exterior wall of the room, part of the heat released during the combustion process is lost by conduction in this wall. Depending on the wall thermal characteristic and operating temperatures these losses should not be ignored.
u e e Q H q = 100× (12)
(
)
3600 × − × × = B T T U A Q L aw e e (13)The values obtained by this equation were matched up to the heat released in the exterior of the room. This was achieved with a thermographic camera to measure wall temperatures and using an approximation for the convection heat transmission [4,5]. The values revealed to be similar.
With fireplaces or with inset appliances there is a need for combustion air. Usually this air comes from the room and its replacement comes from infiltration. The thermal losses associated with this depend on air flow and temperature difference between the exterior and the interior of the room. In a conventional fireplace, without firedoors a large air flow subsist through the chimney and the infiltration loss reported below can not be neglected.
u i i Q H q = 100× (14)
(
)
⎟ ⎠ ⎞ ⎜ ⎝ ⎛ × − × − × = 3.6 1 B m T T Cpair Qi r e (15)HEAT OUTPUT
The heat output is calculated from the mass of fuel burned per hour, B, appliance efficiency and calorific value of the test fuel.
360000 u
H B
EXPERIMENTS
This study was developed using two installations. The inset appliance was tested in laboratory. Combustion gas composition, temperatures and fuel consumption were recorded every minute [6]. The test of the conventional fireplace was made in situ. In this way it was taken all the necessary instrumentation to proceed with analysis, such as: gas analyzer, thermocouples and a scale. To examine the walls temperature nearby, and behind (exterior wall) the fireplace photos were taken with a thermographic camera.
The fuel used was eucalyptus wood logs with typical dimensions of 300 mm length and 50 mm wide, with the following proximate and ultimate analysis, as fired basis. This analysis was performed by an accredited laboratory.
Table 1. Proximate and ultimate analysis, as fired, of the used firewood, eucalyptus Moisture [%of mass] Lower Heat Value [kJ/kg] Carbon [% of mass] Hydrogen [% of mass] Nitrogen [% of mass] Sulfur [% of mass] 7.7 16363 46.0 6.5 0.2 Not detected
The fuel load for each firing was calculated considering the formula.
(
×η
)
× × = n b u fl P t H B 360000 (17)The test procedure consists of two parts: an ignition, one pre-test period and one or two consecutive test periods. Pre-test is made to reach the equipment nominal operation. For inset appliances with closed firedoors it is expected that the test duration takes more than 45 minutes. However, the test duration is defined when the firebed plus the ash from the fuel burned at the end of the test period do not differ from that at the end of the previous test period by more than 50 g. For each separate test result to be valid it shall not differ from the heat output mean value by more than 10 %. In the next figures only the results for the first valid test are shown.
Inset appliance results
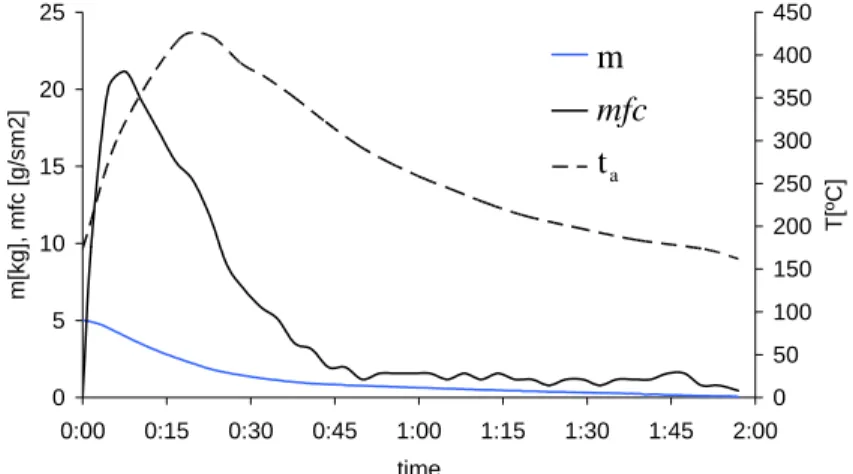
After the fuel load, the highest mass fuel consumption, mfc, take place after 5 to 10 minutes, reaching values of 21 g/m2s in the appliance with staging air. These values are lower than the presented in the bibliography [7-11], Blasiak et all [7] pointed maximum values of 60 g/m2s for wood logs combustion. The difference can be explained by the fact that not all the appliance combustion floor be covered with wood logs.
The maximum mass fuel consumption coincides with the maximum power output, as shown in figure 2 and figure 8, but the highest value for the flue gas temperature only occurs some minutes later when the mass fuel consumption is approximately the half of its maximum value.
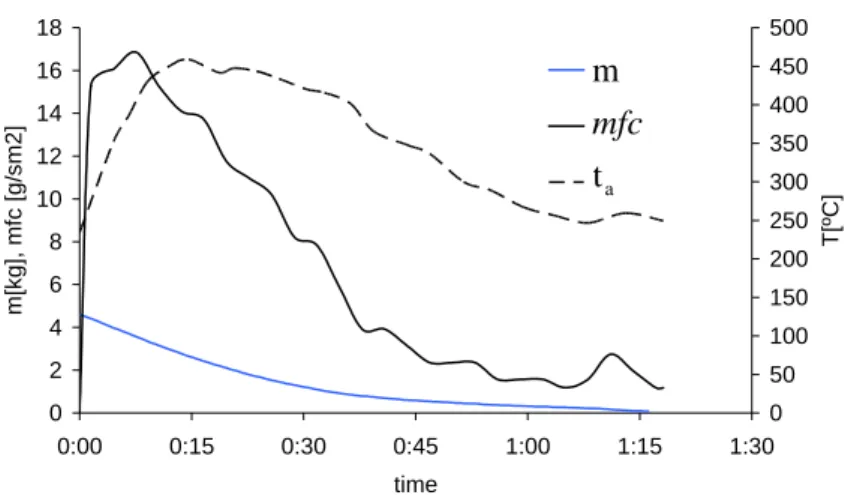
In the appliance with grate air the maximum fuel mass fuel consumption occurs at the same time but it presents a lower value, 17 g/m2s
0 5 10 15 20 25 0:00 0:15 0:30 0:45 1:00 1:15 1:30 1:45 2:00 time m[ kg], m fc [g/ sm2] 0 50 100 150 200 250 300 350 400 450 T[ºC] ta
Figure 2. Evolution of fuel mass, mass fuel consumption and flue gas temperature along the test of the appliance with staging combustion air
a t m
0 2 4 6 8 10 12 14 16 18 0:00 0:15 0:30 0:45 1:00 1:15 1:30 time m[ kg], m fc [g/ sm2] 0 50 100 150 200 250 300 350 400 450 500 T[ºC] ta
Figure 3. Evolution of fuel mass, mass fuel consumption and flue gas temperature along the test of the appliance with grate combustion air
In both appliances the mass fuel consumption attains a minimum rate approximately at 45 minutes. In the first 45 minutes the average mass fuel consumption is similar in the tested appliances, 9.7 g/m2s with staging air and 9.4 with grate air. After 45 minutes from the beginning of the test there is only glowing embers in the appliance floor. In the staging air appliance the time needed to reduce these embers to 50 g took more than the double of the time observed in the appliance with grate combustion air. One of the advantages of using staging air is that this is blown on the glass of the door what conducts to its cleaning.
All tests were conducted at nominal heat output. This means that the combustion air control setting is completely open. The combustion products shown in figures 4 and 5 are in dry basis.
The combustion is always poor, reaching near stoichiometry at maximum mass fuel consumption were the excess air is 1.2 and 1.3 in staging and grate combustion air respectively. In the first 45 minutes the grate combustion air appliance operates with higher excess air than staging air appliance. This and the higher flue gas temperatures in the grate combustion air appliance will conduct to a lower overall efficiency. After the first 45 minutes the excess air is similar in both appliances.
a t m
0 2 4 6 8 10 12 14 16 18 20 0:00 0:15 0:30 0:45 1:00 1:15 1:30 1:45 2:00 time O2, CO2 [%] 0 2000 4000 6000 8000 10000 12000 CO [ppm] O2 [%] CO2 [%] CO [ppm]
Figure 4. Evolution of flue gas composition along the test of the appliance with staging combustion air 0 2 4 6 8 10 12 14 16 18 0:00 0:15 0:30 0:45 1:00 1:15 1:30 time O2, CO2 [%] 0 1000 2000 3000 4000 5000 6000 7000 8000 9000 10000 CO [ppm] O2 [%] CO2 [%] CO [ppm]
Figure 5 - Evolution of flue gas composition along the test of the appliance with grate combustion air
The carbon monoxide concentration in flue gas is used to calculate chemical losses and to classify the appliance according to the EN 13229/A2 [3]. This standard state that the mean carbon monoxide concentration calculated to 13% oxygen content in the flue gas shall not exceed 1%. There are two periods were the carbon monoxide concentration is high. The first period is when the mass fuel consumption is maximum and the other is at the end of the test. The first period is understandable since the combustion
is near stoichiometry, but at the end of the test the excess air is above 4.5 what suggests that the lower combustion temperature drive to this result.
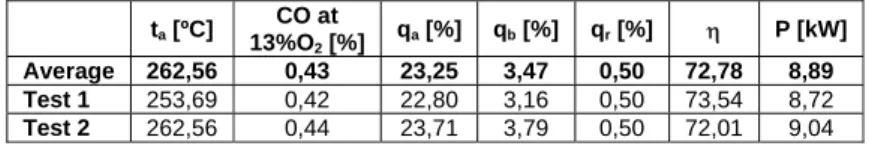
The values in the above figures allow the calculation of the heat losses and consequently the net heat output and appliance efficiency with the formulas in equation 1 to 16. The final results are obtained from the average of at least two valid tests.
Table 2 - Staging combustion air appliance thermal performance ta [ºC] CO at 13%O2 [%] qa [%] qb [%] qr [%] η P [kW] Average 262,56 0,43 23,25 3,47 0,50 72,78 8,89 Test 1 253,69 0,42 22,80 3,16 0,50 73,54 8,72 Test 2 262,56 0,44 23,71 3,79 0,50 72,01 9,04
Table 3 - Grate combustion air appliance thermal performance
ta [ºC] 13%OCO at
2 [%] qa [%] qb [%] qr [%] η P [kW] Average 373,76 0,27 30,80 1,90 0,50 66,81 11,53 Test 1 352,54 0,25 31,03 1,90 0,50 66,56 10,52
Test 2 394,97 0,29 30,56 1,89 0,50 67,06 12,53
The results in table 2 and table 3 show that the combustion process in theses appliances is not regular, but in general, the loss terms and efficiency are similar for each equipment. This result is acceptable since the fuel used (wood logs) is heterogeneous as the manner it is placed on the combustion chamber.
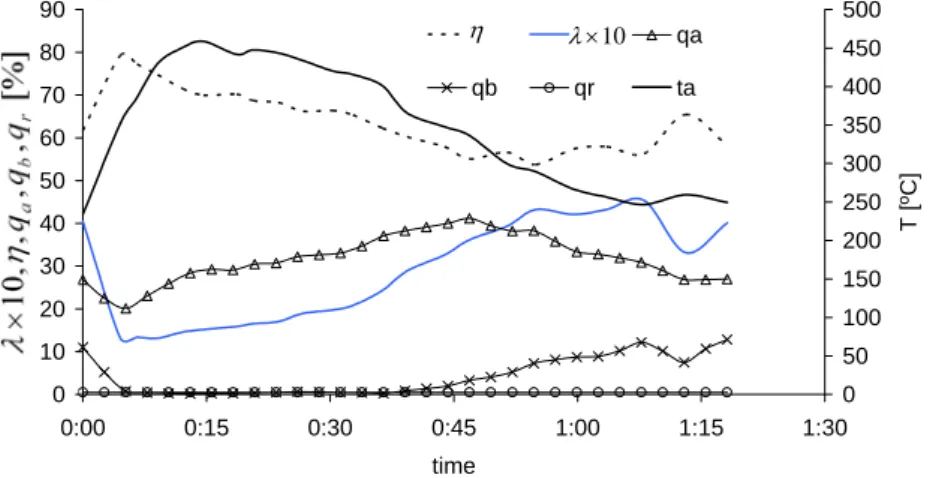
Calculating the heat losses terms along the test, for instantaneous fuel conversion, the thermal behavior of the appliances can be better understand. The heat loss by sensible heat in the flue gas, qa, is the major loss along the test duration, and depends on flue gas temperature and the excess air in combustion. Chemical heat loss due to unburned fuel in the flue gas depends on the excess air used in combustion. Nevertheless, as can be seen in table 2, table 3 this term is small compared with qa. This happens because most of the fuel is consumed in the first 45 minutes when qb is very small. After that qb rises but since the mass fuel consumption is small, the heat loss Qb lose importance. This can be seen comparing figures 6 and 8 or figures 7 and 9.
0 10 20 30 40 50 60 70 80 90 0:00 0:15 0:30 0:45 1:00 1:15 1:30 1:45 2:00 time % 0 50 100 150 200 250 300 350 400 450 T [ºC] qa qb qr ta
Figure 6 – Proportion of heat losses, efficiency, excess air and flue gas temperature along the test of the appliance with staging combustion air
0 10 20 30 40 50 60 70 80 90 0:00 0:15 0:30 0:45 1:00 1:15 1:30 time % 0 50 100 150 200 250 300 350 400 450 500 T [ ºC] qa qb qr ta
Figure 7 - Proportion of heat losses, efficiency, excess air and flue gas temperature along the test of the appliance with grate combustion air
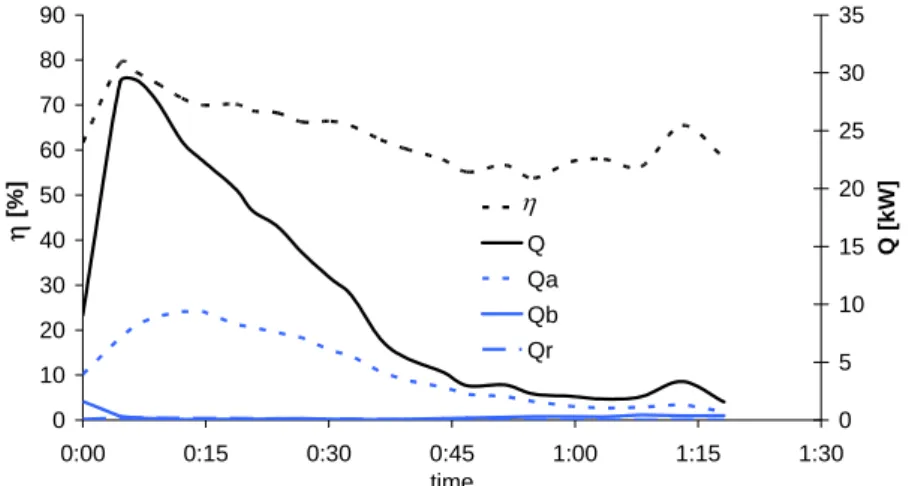
The power of the heat losses is achieved multiplying the above variables by the mass fuel consumption. It is verified that in both appliances the major part of the test can be resumed in the first 45 minutes.
The appliance nearby temperature was measured in the trihedron. The highest value and its localization depend on appliance design. In the appliance with staging air was recorded 146 ºC in the trihedron floor in front of the firedoor. In the appliance with grate air the highest temperature nearby was in the trihedron floor bellow it presenting a value of 185 ºC.
η λ×10 η λ×10
0 10 20 30 40 50 60 70 80 90 0:00 0:15 0:30 0:45 1:00 1:15 1:30 1:45 2:00 time η [%] 0 5 10 15 20 25 30 35 40 45 Q [kW] Q Qa Qb Qr
Figure 8 - Efficiency and total heat losses along the test of the appliance with staging combustion air 0 10 20 30 40 50 60 70 80 90 0:00 0:15 0:30 0:45 1:00 1:15 1:30 time η [% ] 0 5 10 15 20 25 30 35 Q [kW] Q Qa Qb Qr
Figure 9 – Efficiency and total heat losses along the test of the appliance with grate combustion air
Fireplace results
During the test it was not possible to use a scale for continuous fuel consumption measurement in the fireplace. The fuel consumption was calculated measuring the initial and final masses. This allows to calculate the average thermal performance characteristics but not the instantaneous values associated with fuel consumption, such as instantaneous power output.
η
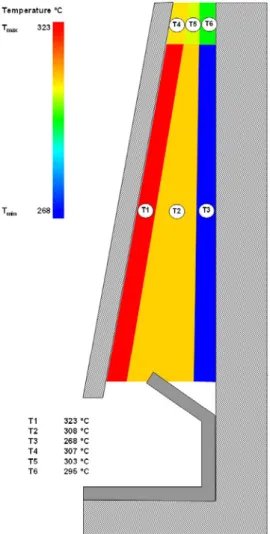
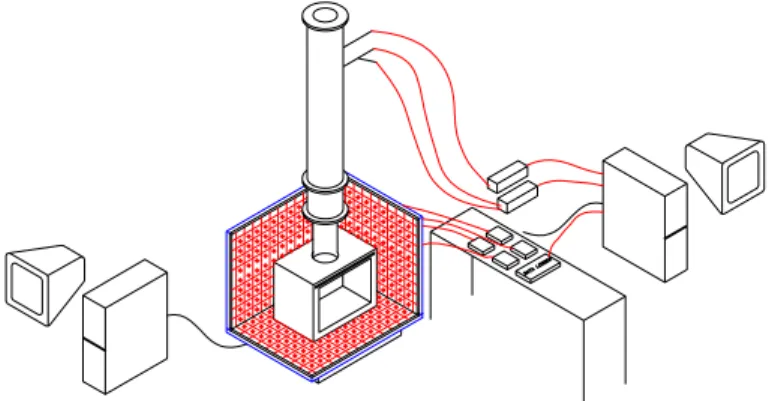
The flow inside the fireplace chimney is expected to be different from the flow inside the laboratory duct, since the boundary conditions in the chimney are different at each side. Three sides face up to the room and other side face up to the exterior. So, instead of getting the temperature with only one thermocouple, three thermocouples were placed in the chimney near the ceiling. The average temperature, ta, is the average of those three readings. Another three thermocouples inside the chimney were also installed, at the half of its height, in order to know the flue temperature profile and to estimate heat losses by the exterior wall. The position of the thermocouples is shown in figure 10.
Figure 10 – Temperature distribution inside the fireplace chimney at maximum flue gas temperature
The average temperature of thermocouples 3 and 6 is used to estimate thermal losses through the chimney exterior wall, qe.
Table 4 – Fireplace thermal performance
ta [ºC] CO at 13%O2 [%] qa [%] qb [%] qr [%] qi [%] qe [%] η P [kW] Average 137,63 0,44 50,34 17,38 0,50 1,29 0,73 29,76 6,68 Test 1 136,86 0,39 50,93 15,60 0,50 0,95 0,68 31,24 7,07 Test 2 138,39 0,49 49,75 19,16 0,50 1,63 0,78 28,28 6,29 0 5 10 15 20 25 0:00 0:15 0:30 0:45 1:00 1:15 time O2, CO2 [%] 0 200 400 600 800 1000 1200 CO [ppm] O2 [%] CO2 [%] CO [ppm]
Figure 11 - Evolution of flue gas composition along the test of the fireplace
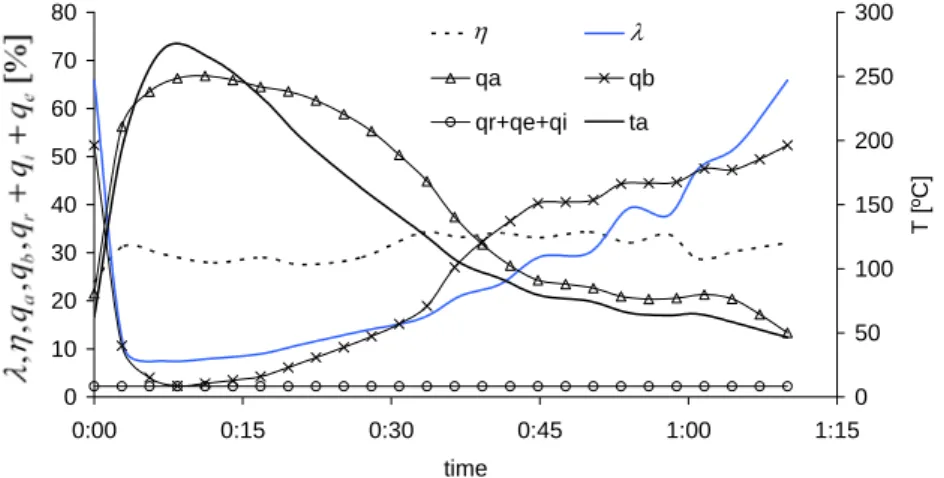
0 10 20 30 40 50 60 70 80 0:00 0:15 0:30 0:45 1:00 1:15 time % 0 50 100 150 200 250 300 T [ ºC] qa qb qr+qe+qi ta
Figure 12 - Proportion of heat losses, efficiency, excess air and flue gas temperature along the test of the fireplace
The flue gas temperature in the fireplace is bellow the values measured in inset appliances. Nevertheless, the excess air present in combustion is ten times greater than the one observed in inset appliances and that conducts to high losses. The losses through sensible heat represent near 50 % of the fuel energy and the chemical losses that were small in inset appliances rise to 15%. The carbon monoxide emissions are lower than the ones measured in inset appliances but that must be analysed with caution once the excess air is so high.
The losses terms qe and qi are small, but the test was done with difference between exterior and room temperature around 4 ºC. The values of these losses as function of the difference between exterior and room temperature can be estimated. However, the chimney draught depends on those temperature differences and the room air depression. Increasing the temperature difference will increase the chimney draught.
Doing a conservative calculation, considering that the chimney draught is constant the infiltration loss with a difference between exterior and room temperature of 20 ºC will increase to approximately 8 %. The loss by conduction in the chimney through the exterior wall, qe, would remain bellow 1%. The highest nearby temperature recorded by the thermograph camera was 32 ºC in front of the fireplace on the room floor.
CONCLUSIONS
The use of inset appliances with close firedoors revels to be a good choice for space heating. The average power output of these equipments allows heating one or more rooms, since some appliances are equipped with hot air ducts. The appliance efficiency is lower than conventional fossil fuel boilers, but beside the environment advantage of using biomass, the wood lower price turns this solution interesting [6].
Comparing with a conventional fireplace the inset appliance with closed firedoors has more than the double of efficiency, 70 % versus 30%.
The major energy loss happens through sensible heat in the flue gas, qa. In inset appliances with 70 % efficiency, this represents about 25% of the fuel energy. The remaining are chemical losses in the flue gas, due to uncompleted combustion, qb, or by fuel that stays in the ash, qr.
The main variables that influence the appliance efficiency is the temperature of the flue gas and the excess air in combustion. These variables depend on the design of the appliance. Two types were tested: one with only staging combustion air and the other with only grate combustion
air. Their performances are similar having the first one higher efficiency and taking more time to consume the embers. Both appliances operate near stoichiometry at maximum mass fuel consumption, but with lean burn along the rest of the test. The average excess air was around 3.
In a fireplace the excess air, who is about ten times greater than the one verified in an inset appliances amplifies the energy losses. With efficiency around 30%, 50% is lost by sensible heat in the flue gas and 17% by chemical losses. The rest is lost through air infiltration and by conduction if the chimney is located in an exterior wall of the room. If the temperature difference between room interior and exterior is high, the losses due to air infiltration will increase appreciably. For a temperature difference of 20 ºC this loss can achieve values of about 8 % of the fuel energy.
The use of closed firedoors in inset appliances has other advantages, such as the security on it operation. It guarantees that no sparks leave the appliance and reduce the release of dangerous gases to the room, such as carbon monoxide. The actual legislation set the maximum concentration of carbon monoxide allowable during 8 hours to 9 ppm. The gas analyzer used in this study is not recommended to measure such low concentrations but reveal critical values for carbon monoxide concentration in the room where the conventional fireplace is located. Such was not observed with the inset appliance with closed doors.
NOMENCLATURE
b Combustible constituents in material passing through the grate and in residue referred to mass of residue material, % of mass
B Mass of fuel fired hourly (as fired basis), kg/h
C Carbon content of the test fuel (as fired basis), % of mass CO Carbon monoxide content of the dry flue gases, % of volume CO2 Carbon dioxide content of the dry flue gases, % of volume Cpair Specific heat of room air, kJ/kg.K
Cpmd Specific heat of dry flue gases in standard conditions, depending on temperature and composition of the gases, kJ/K.m3
CpmH2O Specific heat of water vapor in standard conditions, depending on temperature of the gases, kJ/K.m3
H Calorific value of the test fuel (as fired basis), kJ/kg
H Hydrogen content of the test fuel (as fired basis), % of mass
m Flue gas mass flow, g/s
O2 Oxygen content of the dry flue gases, % of volume P Total heat output, kW
q Proportion of losses referred to the calorific value in the test fuel (as fired basis), %
Q Heat losses referred to the unit of mass of the test fuel, kJ/kg R Residue passing through the grate, referred to the mass of the
fired test fuel, % of mass
t Temperature, ºC
W Moisture content of the test fuel, % of mass
Subscript
a flue gas
aw flue gas near the inside face of the exterior wall
b chemical e exterior
fl fuel load
i infiltration n nominal
r residue passing through the grate
rm room u lower
REFERENCES
1. Renewable Heating action Plan for Europe, European Renewable Energy Council, 2007 (PROJECT REPORT)
2. EN13229:2001 Inset appliances including open fires fired by solid fuels, requirements and test methods, European Committee for Standardization, 2001 (EUROPEAN STANDARD) 3. EN13229:2001/A2 Inset appliances including open fires fired by solid fuels, requirements and test methods, European Committee for Standardization, 2004 (EUROPEAN STANDARD)
4. P. G. Ellis, P.A. Torcellini, Simulating tall buildings using energyplus, Ninth International IBPSA Conference Montréal, Canada August 15-18, 2005 (CONFERENCE
PROCEEDINGS)
5. M. N. Ozisik, Heat Transfer a basic approach, McGrawHill 1985 (BOOK)
6. N. Sousa, M. Nunes, Caracterização Energética e Segurança na Utilização de Recuperadores de Calor para Lareiras, 1st International Congress of Energy and Environment Engineering and Management (CIIEM), Portalegre, May – 2005. (CONFERENCE PROCEEDINGS)
7. R. Friberg, W. Blasiak, Measurements of mass flux and stoichiometry of conversion gás from three different wood fuels as function of volume flux of primary air in packed-bed combustion, Biomass and Bioenergy 23 (2002) 189-208 (JOURNAL ARTICLE)
8. Soren Kaer, Numerical modeling of a straw-fired grate bolier, Fuel 83 (2004) 1183-1190 (JOURNAL ARTICLE)
9. B. Staiger, S.Unterberg, R. Berger, Klaus R. G. Hein, Development of an air
staging technology to reduce NOx emissions in grate fired boilers, Energy 30
(2005) 1429-1438 (JOURNAL ARTICLE)
10. Henry Thunman, Bo Leckner, Co-current and counter-current fixed bed
combustion of biofuel – a comparison, Fuel 82 (2003) 275-283 (JOURNAL
ARTICLE)
11. L.B.M. van Kessel, A.R.J. Aredsen, P.D.M. de Boer-Meulman, G. Brem, The
effect of air preheating on the combustion of solid fuels on a grate, Fuel 83 (2004)
![Figure 4. Evolution of flue gas composition along the test of the appliance with staging combustion air 024681012141618 0:00 0:15 0:30 0:45 1:00 1:15 1:30 time O2, CO2 [%] 0 100020003000400050006000700080009000 10000 CO [ppm]O2 [%]CO2 [%]CO [ppm]](https://thumb-eu.123doks.com/thumbv2/123dok_br/18938165.939310/9.892.225.684.291.533/figure-evolution-flue-composition-test-appliance-staging-combustion.webp)