Event Timestamping Tool: a simple
PC based kernel to timestamp
distributed events
Pedro Martins
António Casimiro
DI-FCUL
TR–00–4
July 2000
Departamento de Informática
Faculdade de Ciências da Universidade de Lisboa
Campo Grande, 1700 Lisboa
Portugal
Technical reports are available at http://www.di.fc.ul.pt/biblioteca/tech-reports. The files are stored in PDF, with the report number as filename. Alternatively, reports are available by post from the above address.
Event Timestamping Tool: a simple PC based kernel to
timestamp distributed events
Pedro Martins [email protected] FC/UL٭ António Casimiro [email protected] FC/UL
Abstract
This report describes the design and implementation of a tool to timestamp distributed events, using a standard PC hardware platform. The Event Timestamping Tool (ETT) is a small software kernel that detects externally generated events using two probe sources, and stores the respective timestamps with known precision bounds. A specialized kernel solution minimizes the response time for an event detection and registration and, consequently, maximizes the precision of the tool. Our approach exploits the Pentium µprocessor internal timestamp counter to provide timestamps with fine granularity.
1 Introduction and Motivation
In distributed systems computations are not restricted to one local machine and may take several machines to execute a single function. A computation is composed by a set of actions bounded by a start event, when the first action starts, and by an end event, when the last action terminates. In distributed computations (or actions), start and end events occur in different machines. The duration of an action is measured by the difference between the end and the start event instants.
Event timestamping consists in assigning timestamps to events, using some reference clock. Therefore, by timestamping the events that bound distributed actions it is possible to measure distributed durations. Pre-operational duration measurements (e.g. configuring timing variables that depends on the system execution environment) are very important in systems that have QoS requirements and are crucial in systems where timeliness has to be guaranteed, like in hard real-time systems.
To measure the duration of a local action, it is possible to use the local clock (assuming the clock is correct) to obtain the timestamps of the start and end events. However, since a distributed action is bounded by events occurring in two different machines, local clocks cannot be used to obtain timestamps because they might not be synchronized. Using a clock synchronization protocol to obtain a global time reference, introduces an error in the duration measurement that depends on the particular protocol that is used. This error can only be avoided if the same time reference is used to timestamp the events.
٭ Faculdade de Ciências da Universidade de Lisboa. Bloco C5, Campo Grande, 1749-016 Lisboa –
There are few software solutions available for event timestamping, and hardware equipments are expensive or of restricted use [8].
One of the approaches to measure durations consists in using an oscilloscope. However, this technique is only appropriate to observe periodic events or to obtain a small number of measurements, but it is not adequate to analyze high volumes of information. This limitation is imposed by the small memory capacity of normal oscilloscopes.
Today’s PC hardware platforms are equipped with highly precise hardware clocks. The Intel Pentium processor family [4,5] has an internal processor timestamp register that makes possible to timestamp events with a granularity of a single CPU clock cycle. For example, using a 500Mhz CPU, it is possible to timestamp events with a granularity of two nanoseconds.
The idea of the proposed tool is to use the clock of a dedicated machine as the time reference, and provide the means for that machine to detect external events. With a correct system implementation, it is possible to build a low cost PC software solution for distributed event timestamping that provides good precision and fine time granularities. In this document, we describe a small PC kernel (the Event Timestamping Tool) that is able to detect, timestamp and record external events.
The document is organized as follows. The next section presents a description of the tool and some relevant concepts used throughout this document. In the section 3 we describe the implementation details of the Event Timestamping Tool. Section 4 discusses the timing behavior of the tool and section 5 presents a concrete response time analysis using a 500Mhz PentiumIII PC. The document concludes with some considerations about future work.
2 System Overview
The system is composed by one measurement machine, where the tool runs, and probe cables that are connected to the data bits of the machine’s parallel port. A probe cable carries events from their sources to the measurement machine.
Since there are eight data bits on the parallel port, it would be possible to implement the Event Timestamping Tool with up to eight probes (using one data bit per probe). However, in the implementation described in this document a scheme with two probes is considered, which is already sufficient to perform measurements of distributed actions. In this “double probe” scheme, each cable contains four data lines that are connected to half of the parallel port data bits (one of the probes is connected to the lower four bits, and the other to the higher ones).
The tool detects external events by reading parallel port inputs. Physically, an event occurs whenever any of the data bits of the parallel port is modified. More precisely, an event signaled to one of the probes will modify the lower nibble data bits on the port, and events signaled to the other will modify the higher nibble data bits. Since the presented tool is specifically targeted to deal with events, we present bellow the exact definitions of some relevant concepts that we will extensively use throughout this document.
• Event Instant: An event occurs when it is signaled at the data bit pins of the parallel port. We considerer that the delay introduced by the probes is negligible.
• Event Detection Instant: An event is detected by the application when it reads the parallel port, and verifies that some data bits have changed.
• Event Timestamping Instant: An event is timestamped by the application as soon as it is detected.
• Timestamping Precision Bound: Considerer a global timeline materialized by a continuous (i.e. non granular) physical clock G (which we assume to be reliable, with a negligible drift rate with respect to non-observable real time), and let G(t) be the clock time that is observed at any real time instant t, ts the real time instant a which some event e is signaled to the ETT and te the latest instant at which the event can be timestamped by the application. The precision of the timestamps provided by the tool is bounded by: G(te) - G(ts)
Event sources can be of any kind, provided that they conform to the electrical specifications of the parallel port (see subsection 3.2.1). Naturally, the most obvious measurement scenario consists in connecting the probe cable extremities to parallel ports of other computers.
The primary goal of the tool is to detect changes on the parallel port data lines (i.e. an event signaling), and provide timestamps for those events using a local clock. Given the above definition of timestamping precision, a dedicated kernel solution enforces a small and bounded difference between the instants of an event signaling and the respective timestamping.
The complete tool package comprehends three main stages of operation: a setup stage, during which the application binary is loaded into the main memory and executed; a capture stage, during which the application detects, timestamps and records (in the main memory) external events; and an analysis stage (after the capture stage), during which event information can be consulted or saved for later analysis, using a specific interface.
During the capture stage, the tool enters in a loop waiting for new events on the parallel port. When a new event is detected, the tool builds an information structure containing three fields: the probe number that generated the event, an event code, and the event corresponding timestamp. This information is stored in the main memory. These operations are cyclically executed in a loop, until a termination event is detected in one of the probes, or until the memory capacity is exhausted.
During the analysis stage, the event information acquired during the capture stage is presented to the user. This information may be saved into a diskette, allowing an a posteriori analysis in another system using specific analysis software.
3 Tool Description
The tool is composed of three operational stages: a setup stage, a capture stage and an analysis stage. In this section, we describe each of these operational stages and their implementation details using a PC hardware platform.
The tool software is a small binary (about 2KBytes) that is loaded into the main memory during the bootstrapping phase of the PC. For simplicity, the binary can be stored in a diskette to avoid the creation of an extra partition in the hard disk. The application code is a 16-bit binary that runs in real mode and has no operating system support (runs on the bare hardware). Basically, and apart from the interfacing aspects, the application consists of a small loop that reads parallel port inputs waiting for new events, assigns timestamps to those events and records them in the memory.
3.1 Setup Stage
The bootstrap of a PC from a diskette drive entails the following operations. First, the system firmware in the BIOS ROM executes a power-on self test (POST), runs BIOS extensions in peripheral board ROMs, and invokes software interrupt INT 19H (Bootstrap). The INT 19H handler typically performs the standard PC-compatible boot, which consists in reading the first physical sector from the first diskette drive into the main memory at memory address 0000H:7C00H. Then the processor jumps to the first byte of the boot sector image stored in memory.
The Event Timestamping Tool boots from a diskette. The application data that is stored in the diskette contains the boot sector code and the application code merged into a single binary. After the bootstrapping process, the first 512 bytes of the application code are stored at memory address 0000H:7C00H. The application starts its execution by setting up the stack segment and the stack pointer values. Then, the boot sector is copied into memory address 1000H:0000H (Code Segment of the application) and the rest of the application code is copied into the main memory using BIOS INT 13H.
3.2 Capture Stage
During the capture stage, the tool enters in a loop waiting for new events on the parallel port. During the loop execution, interrupts are disabled to avoid any undesirable extra activities. The following lines present the main instructions of this capture loop, using a C-like notation.
…
cli(); // disable interrupts
byte in_val= get_lpt1_byte();
byte probe1_val=in_val & 0x0F; // only the lower 4 bits byte probe2_val=in_val >> 4; // only the upper 4 bits byte last_probe1=probe1_val; //last value read from probe1 byte last_probe2=probe2_val; //last value read from probe2
while ( (probe1_val<>0) && (probe2_val<>0)) // a zero value
in_val= get_lpt1_byte(); ts = get_timestamp(); probe1_val=in_val & 0x0F; probe2_val=in_val >>4; if (probe1_val<>last_probe1) { register_event(ts,prob1_val); last_probe1=prob1_val; } if (probe2_val<>last_probe2) { register_event(ts,prob2_val << 4); last_probe2=prob2_val; } }
The application detects an event by a change of the state of data bits on the port. The value represented by these data bits is considered as an event code, which means that there are 16 different codes (4 bits) to be considered. From the point of view of the system that is generating the events there is a restriction on the event codes that may be signaled in order to be detected by the tool. In fact, no two equal events codes can be sequentially signaled on the same probe because they would not be distinguishable. Also, since the capture loop terminates when an event with a zero code is detected on one of the probes, events with this zero code have a restricted usage. Actually, it would be possible to terminate the capture loop by detecting a direct user order, signaled through the keyboard. However, this feature would increase the WCET (Worst Case Execution Time) of the capture loop and consequently decrease the tool precision (see section 4). Nevertheless, and although not being shown in the presented code, the loop always terminates when there is not enough memory to store more events.
This loop includes reading the parallel port, reading the local clock and storing event information into the memory. We will now discuss these operations in detail.
3.2.1 Parallel Port
The Parallel Port allows the input of up to nine bits or the output of twelve bits at any one given time, thus requiring minimal external circuitry to implement many simpler tasks. The port is composed of four control lines, five status lines and eight data lines.
Newer Parallel Ports are standardized accordingly to the IEEE 1284 standard, first released in 1994. This standard defines five modes of operation, which are the following:
1. Compatibility Mode. 2. Nibble Mode.
3. Byte Mode.
4. EPP Mode (Enhanced Parallel Port). 5. ECP Mode (Extended Capabilities Mode).
The aim of standardization is to allow the design of new drivers and devices that are compatible with each other and also backwards compatible with the Standard Parallel Port (SPP). Compatibility, Nibble and Byte modes use just the standard hardware available on the original parallel port cards while EPP and ECP modes require additional hardware on the parallel port card, which can run at faster speeds, while still being backwards compatible with the Standard Parallel Port.
Compatibility mode can only send data in the forward direction (i.e. from computer to device). In order to receive data, a mode change to either Nibble or Byte mode has to be done. Nibble mode can input a nibble (four bits) in the reverse direction (i.e. from device to computer). Byte mode uses the Parallel's bi-directional feature (found only on some cards) to input a byte (eight bits) of data in the reverse direction.
The Event Timestamping Tool application uses the Byte mode of the Standard Parallel Port to input bytes from the port. Parallel's bi-directional feature, which is found only on some cards, is typically available in all recent computers. Note that even if the parallel port card is an EEP or an ECP, there is no problem in using the Event Timestamp Tool since they are backwards compatible with the Standard Parallel Port hardware.
The application assumes that the first parallel port located at IO port address 378H, is the one used to connect the probes. Nevertheless, if a different IO port has to be used this value can be reconfigured. For a detailed description of the parallel port the reader can refer to [1]. Here, we just explain how to set up the bi-directional feature of the SPP port, how to get the data from the input and how to connect the probes to the data pins of the parallel port.
Setting up the bi-directional feature of the parallel port consists in activating the fifth bit on the control port located at IO address base+2 (or, 378H+2). To read a byte, it is sufficient to read from the data port located at IO base address (378H). The C-like code procedures to do these operations are presented next:
void set_bi_directional_lpt1() { byte ctrl; ctrl=inb(37Ah); set_bit(ctrl,5); outb(37Ah,ctrl); } byte get_lpt1_byte() { byte bt; bt=inb(378h); return bt; }
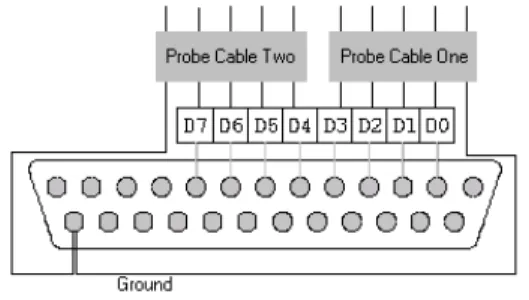
Parallel port data bits (D0-D7) of the measurement machine, are multiplexed by two probe cable input lines. Each probe cable has four data bit lines, which are connected as depicted in Figure 2. The ground pin on the connector is shared by the two probe sources.
Figure 2 – Configuration of a D-25 parallel port cable connector, for use with two measurement probes
A byte read from the parallel port is interpreted as follows: the first four bits represent the code of an event got from probe one; the four high significant bits represent an event got from probe two. Therefore, 16 event codes can be obtained from each probe
The voltage level that must be applied on the parallel port data bits to generate a logical value of one, is of 5.0 Vdc. The current sink capacity varies from port to port. Most parallel ports implemented in ASIC, can sink around 12mA. However, some ports have sink capacities of 6mA, 16mA or 20mA.
3.2.2 Timing on the Intel PC family
PC hardware has three main sources of timing; the counter/time chip, the real time clock, and the processor timestamp counter, only available in the Pentium family.
A crystal oscillator, or oscillator module, generates a 14.31818 MHz clock that is divided by 12 to generate a 1.193182 MHz clock (being the period 0.8381 microseconds) pulsing to the three channels of the 8253/8254 counter/timer chip (CTC) [2,6]. The CTC divides this frequency to lower frequencies using programmable divisors, and produces three output signals.
The CTC channel zero output is connected directly to IRQ0 on the primary PIC (8259A interrupt controller chip [3]), and generates INT 8, the timer tick interrupt, about 18.2065 times per second, or once every 54.9254 milliseconds. The timer tick is a periodic interrupt, which allows certain actions to be executed periodically.
The CTC divides its 1.193182 MHz clock down to 18.2065 Hz using a 16-bit counter. It is possible to read the actual count in progress in the CTC. In combination with the tick count variable, this can give an absolute time value, in units of 0.8381 µs, for timestamping. If a timer tick rate faster than 18.2065 times per second is required, this can be achieved by reprogramming the CTC.
The Real Time Clock (RTC) was introduced with the AT, and all hardware-compatible AT’s and later machines have one. The RTC is completely independent of the CTC. It uses a 32.768 kHz crystal for timekeeping and is battery backed up (i.e. continues to keep time while the computer is powered off). It can be used to generate a periodic interrupt, usually at 1024 Hz (1024 interrupts per second).
In the Intel Pentium processor family, an internal 64-bit processor timestamp counter was introduced. This counter, which is incremented at every CPU clock cycle, tracks the number of CPU clock cycles since the system booted up.
RDTSC – Read Time-Stamp Counter OPCODE – 0F31
The above instruction loads the current value of processor’s timestamp counter into the EDX:EAX registers. Using the Pentium timestamp counter it is possible to have a time reference with a granularity equal to one CPU clock cycle time. The granularity of timestamps given by the processor’s internal counter is:
ε = ( 1 / CPU speed in Hertz ) seconds
Besides the fine time granularity achieved by the Pentium internal counter, there are other important advantages in event timestamping using this approach. There is no need for an IO port read when getting a timestamp (when using the CTC source, a read port operation must be done to get the internal counter value of the CTC). Interrupt handling of CTC generated IRQ0 (that is, the IRQ is generated by the PIC but the stimulus to the PIC is given by the CTC channel 0) is avoided. Those two advantages reduce the response time of the ETT, that is, the maximum execution time to register an event, which is a feature of extreme importance for the tool precision (see Section 4).
The time source used by the application to timestamp events is the Pentium internal timestamp counter. This approach forces the usage of a Pentium machine to run the ETT software, the processor speed is not a restriction factor, but higher processor speeds provide smaller clock granularities (see subsection 3.2). Processor speed is also important to the machine response time when processing incoming events (see section 4).
The following code is used to read the internal Pentium timestamp counter.
timestamp get_timestamp() { rdtsc; return EDX:EAX; } 3.2.3 Memory Layout
The application runs in real mode and has access to the lowest 640Kbytes of main memory. The application data segments are used to store event information during the capture stage. Each event information stored in the main memory contains an eight bytes timestamp and a four bytes event code. Note that since each event code is stored in four bytes (an event code is a 4-bit value) the double word memory alignment is preserved and in consequence a better event registering performance is achieved.
Designation Segment BIOS 0000h
Application Code Segment 1000h
Application Stack Segment 2000h
Application Data Segment 3000h
… …
Application Data Segment 9000h
3.3 Analysis Stage
In the analysis stage, the event information acquired during the capture stage is presented to the user. This information can be saved in a diskette to a posteriori analysis in a system equipped with analysis tools.
3.3.1 User Interface
The application user interface pretends to be very simple and intuitive. When the application starts, it waits for the user to press the enter key (using BIOS INT 16H) before starting the capture stage. After that, the application enters in the capture stage and stays there until it detects a zero code event on one of the probes, or until there is no available memory to record event information.
After the capture stage, the application enters in the analysis stage. In the analysis stage a scroll box containing the information of the capture stage is presented to the user. Each line of the scroll box contains the information of one event, which is presented in four columns containing a sequence number that corresponds to the order of the event recording in the system, a probe number that specifies the probe that generated the event, the code of the event and the timestamp of the event. The user is able to view all the lines contained in the scroll box by pressing the PGUP/PGDOWN keys. Pressing the ‘S’ key the results will be saved in a diskette and pressing the ESC key the application will return to the initial state (before the capture stage).
3.3.2 Raw File-System
In the analysis stage, the user has an option to save the results into the diskette. The save operation consists in a dump of memory data segments into the sectors of a diskette, using the BIOS INT 13H.
The ETT package includes a Linux tool to extract a raw diskette image file and convert it to a Linux text file. The utility, named fextract, can be used as follows:
fextract <diskette_image_file> <dest_file> <cpu_speed>
The parameter cpu_speed refers to the machine where the ETT has been executed. The utility converts processor clock cycles to nanoseconds using this processor speed value. Image_file is the output file generated by the fextract command. Each line of this text file contains an event. Each event consists of three values: a timestamp (represented in nanoseconds), the event code and a probe number. The resulting file can be used for later analysis.
Under Linux, a diskette image can be converted to a file using the following command:
cp /dev/fd0 image_file
4 Timing Analysis
response time of the tool, and therefore it is only meaningful during the capture stage. The worst response time (τmax) corresponds to the worst case execution time of a
capture loop step.
τmax = WCET (capture loop step)
The response time has a direct impact on the tool precision and on the minimum inter-arrival time allowed for events signaled in the same probe.Note that the number of probe cables connected to the measurement machine influences the execution time of the main loop. For each additional probe in the system, the respective event detection test and event registry instructions will have to be added to the main loop code, which will slightly increase its WCET. In what follows these relations will be carefully analyzed.
4.1 Timestamping Precision
Like it was introduced in section 2, the precision of the timestamps generated by the tool depends on the execution time of the action bounded by the instants of an event signaling and the correspondent timestamping instant. Note that due to the cyclic nature of the capture loop and the asynchronous nature of the events that are signaled, the duration of such an action can take up to τmax, that is, the WCET of a capture loop step.
Suppose that an event is timestamped at the instant ti. The next timestamp will be processed at time t < ti+τmax, that is, timestamping will only be performed again at time ti+τmax. Now suppose that just after the timestamping is done, another event is signaled
on the port. The latter will only be timestamped at time ti+τmax. The response time may
take up to the maximum time τmax.
Recall the definition of timestamping precision provided in section 2, but assume, now, that the physical clock G has a granularity of ε. The precision π [7] of the timestamps provided by the tool is equal to τmax + ε, that is, be ts the instant at which
some event e is signaled to the application and te the latest instant at which the event can be timestamped by the application. The precision of the timestamps provided by the tool is bounded by: G(te) - G(ts) <τmax + ε. We can only define an interval for the event
signaling instant, not an absolute value: G(te) ∈ [G(ts)..G(ts) + τmax + ε[.
4.2 Precision of an Action Duration Measurement
An action is defined by one start even and one end event. The duration of an action is given by the difference between the instants of those events. When measuring durations of actions with the Event Timestamping Tool, the precision of such measurements depends on the precision of the two timestamps obtained for the boundary events.
Consider the clock described in the previous subsection. Be ts and te the real time instants at which a start and an end event occur, and ts’and te’ the real time instants at which their respective timestamps are generated.
te-ts gives the real time duration of the action. Given our assumption about the clock
G(ts’) ∈ [G(ts), G(ts) + τmax + ε[ and G(te’) ∈ [G(te), G(te) + τmax + ε[ ⇒ G(te’)-G(ts’) < G(te) + τmax + ε - G(ts) ! G(te’)-G(ts’)< G(te)-G(ts)+ π ! G(te’)-G(ts’)< te - ts+ π
When measuring an action with the Event Timestamping Tool, the maximum error that could be undertaken is π.
4.3 Response Capacity
The minimum inter-arrival time between two consecutive events signaled in the same probe is determined by the capacity of the tool to detect both events. Look back at the example described in subsection 4.1 and suppose that the rate of incoming events is τmax /2. Now consider the following scenarios where three events are consecutively
signaled on one of the probes. In the first scenario, one event is signaled at time ti, the second at time ti+τmax /2 and the third at time ti+τmax. In this case it is obvious that the
second event will not be detected because after the first event is read from the parallel port the application only will read again the input at time ti+τmax. Since at time ti+τmax
the second event has been replaced by the third event, the data bits correspondent to the second event have, by then, be lost.
A necessary condition to guarantee that the application does not loose events, is that the minimum inter-arrival time between events from the same probe source, be a least equal to the response time τmax.
4.4 Implementation considerations
Like it was described in the previous subsections, the WCET of the capture main loop determines the precision and the response capacity of the tool, therefore the main loop code was designed in order to minimize its WCET.
An operating system, even if it is a real-time one, needs to perform some background tasks, such as interrupt handling, to ensure its operability and functionality. Those background activities have some impact in the execution time of user applications because they compete with them on the access to the hardware, and normally have higher priorities. For example, the execution of a user application has to be preempted each time an interrupt is serviced. Operating system activities are asynchronous to user applications and generate an overhead that increases the WCET of user applications.
Software activities that occur asynchronously with respect to the normal execution flow of user applications, will increase the WCET of these applications not only for the amount of time they use the processor (and the context switching time), but also degrade the system performance due the negative impacts on the pipelining and caching mechanisms.
For performance reasons, some operating systems concede some degree of operational autonomy to the devices in the system, allowing them to perform operations
devices and memory are initiated by a device without any CPU intervention. The problem is that DMA activities compete with the processor on the access to the system bus, and since they have priority they will stop the processor execution during the bursts of information transfers on the system bus.
The use of a specialized kernel solution guarantees that all machine resources are available to the application, and guarantees that they are used in an optimal manner for the purpose of the tool. Note that during the execution of the capture main loop, there are no other background activities running in parallel with the main loop, since interrupts are disabled and there are no devices starting DMA transfers (the devices in the system must be initialized by the operating system before starting operating, and the tool does not perform the initialization of any device).
Unfortunately, there are some hardware overheads that can not be eliminated, even by a specialized kernel. The hardware architecture is composed by a set of components and its way of operation does not always exhibit synchronous behavior. The memory refreshing operation on a PC, which performs the refreshment of electrical signals on the dynamic memory of the system, is a periodic activity that is asynchronous to the processor execution. This periodic activity stops the processor executions, periodically, during the time interval that takes to execute the refresh operation on the hardware. It is obvious that during the execution of some loop steps, the overhead generated by this asynchronous activity has impact on the execution time of those loop steps.
5 Case-study for a 500Mhz PentiumIII PC
In this section we will present a set of measurements obtained using a PentiumIII PC with processor speed of 500Mhz. Experiments were done with no external measurement instrumentation. The results provide a practical view of the upper bounds for the tool precision.
The execution time of the capture loop was calculated using the following approach: in all loop steps the application records an event; differences between two sequential events corresponds to the execution time of a loop step.
τmax = 2080 ns
Figure 4 – Distribution of capture loop execution times using a 500Mhz PC Observing this graphic, we can see that the majority of executions times are lower than 1522 nanoseconds. For instance, using the results of the experience we can assume a τmax of 1522 with a coverage near 1.
Assumed ττττmax (ns) Coverage Assumption
1522 .955 1800 .997 2080 1 Next table shows the precisions for three different assurance levels obtained for
three values of τmax and their respective coverage.
π = τmax + + ε
ε = ( 1 / CPU speed in Hertz ) seconds = 2 ns
ττττmax εεεε Coverage
Assumption Precision π (ns)
2080 2 1 2082
1800 2 .997 1802
1522 2 .955 1524
The tool guarantees that it does not loose events for a minimum event rate of 2080 nanoseconds per probe source.
6 Conclusions and Future Work
Using ordinary PC hardware to timestamp distributed events is not necessarily a bad solution since it may not depend on the timing behavior of an underlying operating system. If a correct system implementation is employed it is possible to build a tool that provides highly precise timestamps for distributed events.
The keys for a successful implementation consist in using a fine granularity clock reference and in minimizing the time between the signaling of an event on the parallel port and its respective timestamping. A specialized kernel avoids operating system and hardware overheads that increase the maximum execution time of the ETT main loop.
We have described the implementation details of an event timestamping tool. The description corresponds to a first implementation approach that can still be optimized for a better resource utilization and increased performance. For instance, the machine can run in protected mode with a 32-bit binary code, which is smaller and faster than a 16-bit version. Also, in protected mode the entire system memory can be accessed, allowing more events to be registered during the capture stage. Another improvement that can be made consists in replacing the diskette raw file system by a file system that mounts a Linux disk partition, or by a NFS file system.
7 References
[1] Craig Peacock. Interfacing the Standard Parallel Port, available from http://www.beyondlogic.org/spp/parallel.htm.
[3] Intel Corporation. 8259A Programmable Interrupt Controller. Order Number 231468-003.
[4] Intel Corporation. The Intel Architecture Software Developer’s Manual, Volume 1: Basic Architecture. Order Number 243190.
[5] Intel Corporation. The Intel Architecture Software Developer’s Manual, Volume 2: Instruction Set Reference. Order Number 243191.
[6] Kris Heidenstrom. Timing on the PC family under DOS, available from http://208.128.17.166/zone7/cat128/1481.htm.
[7] Paulo Veríssimo, Luís Rodrigues. Distributed Systems for System Architects. To be published.
[8] Pedro Gomes and Rui Rijo. PET: uma ferramenta universal para a avaliação de desempenho em sistemas distribuídos. In Proceedings of Primeiro Encontro de