The Impact of Privatization on Firms’ Financial Performance
An Analysis to REN – Redes Energéticas Nacionais
Miguel Ângelo Folgado Mateus
Project submitted as partial requirement for the conferral of Master in Management
Supervisor:
Prof. João Francisco Rosário, Visiting Assistant Professor, ISCTE Business School Finance Department
- Lombada –
T
H
E
IMPACT
O
F
PRIV
A
T
IZ
A
T
IO
N
O
N
FIRMS
’ FIN
A
N
CI
A
L
PE
RFO
R
MA
N
C
E
M
ig
uel
Â
n
g
el
o
F
o
lg
a
d
o
M
a
teus
I
Sumário
A privatização de instituições públicas é um tema muito debatido e com capacidade de gerar um vasto leque de opiniões e críticas nos vários setores da sociedade Portuguesa. Sendo que, nas últimas décadas, várias empresas foram alvo deste tipo de processo, incluindo a REN – Redes Energéticas Nacionais.
Assim, recorrendo a dados oficiais e no período compreendido entre 2010 e 2015, foi analisado um conjunto de indicadores financeiros, com o intuito de concluir sobre o impacto da privatização nos resultados financeiros desta empresa em específico. Os resultados indicam que a curto prazo este processo apenas teve como impacto significativo um aumento do valor total do Ativo e como consequência, uma diminuição significativa no Asset Turnover.
Relativamente aos restantes rácios, respeitantes à performance financeira da REN, nenhum outro sofreu quaisquer efeitos significativos, apesar de ligeiras melhorias em alguns indicadores.
Estas conclusões poderão ser úteis para elementos de estruturas financeiras de empresas que foram ou poderão vir a ser privatizadas, bem como a investidores.
Classificação JEL: L33, G32
II
Abstract
Privatization of state-owned enterprises is a much debated subject and usually triggers different opinions and points of view within the Portuguese society. In the last decades several firms were affected by this process, including REN - Redes Energéticas Nacionais.
Furthermore, using official data and within the period between 2010 and 2015, a set of financial indicators was analysed in order to conclude about the impact of privatization on this firm’s financial results. The results indicate that, in the short-term, this process had only a significant impact on the increase of the Total Assets value and subsequently a significant decrease in the Asset Turnover Ratio.
Concerning the remaining ratios, associated to REN’s financial performance, none of them suffered any significant effect despite some slight improvements on some indicators.
These conclusions could be useful for individuals in companies’ financial departments, which were or may be privatized as well as for investors.
JEL Classification: L33, G32
III
Acknowledgments
I would like to express my gratitude to my supervisor Prof. João Rosário for all of his advices and availability.
I also want to thank my family for the moral support.
IV
List of Contents
Sumário ... I Abstract ... II Acknowledgments ... III List of Tables ... VI List of Figures ... VII List of Acronyms ... VIIISumário Executivo ... 1
1. General Context about REN – Redes Energéticas Nacionais ... 3
1.1 Description of the Group ... 3
1.2 History of REN ... 4 1.3 Energy Industry ... 5 2. Problem Definition ... 7 3. Literature Review ... 8 3.1 State-owned Organizations ... 8 3.2 Private Firms ... 9 3.3 Privatization ... 10 3.4 Natural Monopolies ... 12 4. Research Problem ... 14 5. Methodology ... 15 5.1 Profitability ... 15 5.1.1 Profit Margin... 15 5.1.2 Return on Assets ... 16 5.1.3 Return on Equity ... 16 5.2 Efficiency ... 17
5.2.1 Asset Turnover Ratio ... 17
5.3 Liquidity ... 17
5.3.1 Current Ratio... 17
5.4 Solvency ... 18
5.4.1 Debt-to-Equity ... 18
5.4.2 Interest Coverage Ratio ... 19
V
5.6 Stock Price ... 20
6. REN’s Financial Performance ... 22
6.1 Profitability ... 22 6.2 Efficiency ... 24 6.3 Liquidity ... 25 6.4 Solvency ... 26 6.5 Credit Rating ... 28 6.6 Stock Price ... 29 Concluding Remarks ... 30 References ... 34 Appendices ... 40 Annexes A ... 40 Annexes B ... 43
VI
List of Tables
5.1 Credit Rating’s Quantitative Variables... 20
B.1.1 Profit Margin Samples Statistics ... 43
B.1.2 Profit Margin Samples Test ... 43
B.2.1 Return on Assets Samples Statistics ... 43
B.2.2 Return on Assets Samples Test ... 43
B.3.1 Return on Equity Samples Statistics ... 44
B.3.2 Return on Equity Samples Test... 44
B.4.1 Asset Turnover Ratio Samples Statistics ... 44
B.4.2 Asset Turnover Ratio Samples Test ... 44
B.5.1 Current Ratio Samples Statistics ... 45
B.5.2 Current Ratio Samples Test ... 45
B.6.1 Debt-to-Equity Samples Statistics ... 45
B.6.2 Debt-to-Equity Samples Test ... 45
B.7.1 Interest Coverage Ratio Samples Statistics ... 46
B.7.2 Interest Coverage Ratio Samples Test ... 46
B.8.1 Credit Rating Samples Statistics ... 46
B.8.2 Credit Rating Samples Test ... 46
B.9.1 Stock Price Samples Statistics ... 47
VII
List of Figures
1.1 REN Shareholders’ Structure. ... 3
1.2 REN’s Corporate Structure. ... 4
6.1 Profit Margin Values (2010-2015) ... 22
6.2 Return on Assets Values (2010-2015) ... 23
6.3 Return on Equity Values (2010-2015)... 24
6.4 Asset Turnover Ratio Values (2010-2015) ... 25
6.5 Current Ratio Values (2010-2015) ... 26
6.6 Debt-to-Equity Values (2010-2015) ... 27
6.7 Interest Coverage Ratio Values (2010-2015) ... 27
6.8 Credit Rating Values (2010-2015) ... 28
6.9 Stock Price Values (2010-2015) ... 29
A.1 Revenue and Net Income Values (2010-2015) ... 40
A.2 Total Assets and Current Assets Values (2010-2015) ... 40
A.3 Shareholders’ Equity Values (2010-2015) ... 41
A.4 Total Liabilities and Current Liabilities Values (2010-2015) ... 41
VIII
List of Acronyms
CNE – Companhia Nacional de Electricidade D/E – Debt-to-Equity
EBIT – Earnings Before Interest and Taxes EDP – Energias de Portugal
ENTSO-E – European Network of Transmission System Operators for Electricity ENTSOG – Network of Transmission System Operators for Gas
ERSE – Entidade Reguladora dos Serviços Energéticos PPAS – Power Purchase Agreements
PSI 20 – Portuguese Stock Index REE – Red Eléctrica de España REN – Redes Energéticas Nacionais RNT – Rede Nacional de Transporte
RNTGN – Rede Nacional de Transporte de Gás Natural ROA – Return on Assets
ROE – Return on Equity SOE – State-owned Enterprises
SRPV – Serviço de Redes Privativas de Voz TSO – Transmission System Operator
1
Sumário Executivo
Sendo a principal operadora do sistema de transporte de energia em Portugal, a REN – Redes Energéticas Nacionais foi uma das várias instituições públicas a passar por um processo de privatização. Este foi efetuado em três fases distintas, em 2007, em 2012 e finalmente em 2014. No entanto, a fase mais marcante neste processo ocorreu em 2012 com as aquisições de 25% e 15% do capital da empresa, por parte da State Grid of China e da Oman Oil respetivamente.
Assim como a grande maioria das privatizações em Portugal, como por exemplo, os casos da EDP, da ANA ou dos CTT, também o processo que envolveu a REN originou uma enorme contestação e um aceso debate relativos às vantagens e desvantagens para o país, considerando pontos de vista económicos, sociais e políticos bem como a atual situação financeira do país.
Quer em Portugal quer noutros pontos do globo, o tema privatização levanta, na maior parte dos casos, não só as questões acima mencionadas, mas também, dúvidas em relação ao seu impacto nas instituições envolvidas. Quer ao nível financeiro, ao nível dos seus recursos humanos, nas suas relações com os clientes e investidores ou no seu modelo de gestão.
Portanto, com o intuito de averiguar que tipo de efeito tem um processo de privatização numa empresa, considerou-se que o presente trabalho tivesse como objetivo abordar um aspeto relevante e específico como a performance financeira de uma empresa e concluir acerca do impacto que um processo deste tipo tem sobre o resultado financeiro da empresa, usando o exemplo da REN para análise.
Para o efeito, foi considerado como momento-chave no processo, a entrada no capital da empresa, em 2012, dos dois maiores acionistas atuais, State Grid e Oman Oil. Assim foram considerados resultados até 2012 como anteriores à privatização efetiva e os resultados de 2013 em diante como valores já afetados pelo processo.
Sendo assim, o método utilizado consistiu na análise da evolução de rácios presentes nos seguintes indicadores financeiros, rentabilidade (Profitability), eficiência (Efficiency), liquidez (Liquidity) e solvência (Solvency), bem como dos valores associados ao Rating e ao preço das ações da empresa.
Estes valores trimestrais referem-se ao período entre 2010 e 2015, tendo como ponto de referência o ano de 2012, como referido anteriormente. Foram, portanto, objeto de análise
2 estatística com base na comparação dos valores médios dos dois períodos. De modo a determinar a existência de diferenças significativas entre os períodos analisados.
Esta análise permitiu concluir a inexistência de um impacto significativo na maior parte dos indicadores respeitantes aos resultados financeiros da empresa a curto prazo. Apesar destes resultados, o aumento significativo do valor total do Ativo e consequente impacto na eficiência em gerar receita a partir dos seus ativos, bem como pontuais evoluções positivas de alguns indicadores financeiros quando comparados com períodos anteriores, são algumas das conclusões a retirar relativamente aos efeitos a curto prazo deste processo de privatização.
3
1. General Context about REN – Redes Energéticas Nacionais
1.1 Description of the Group
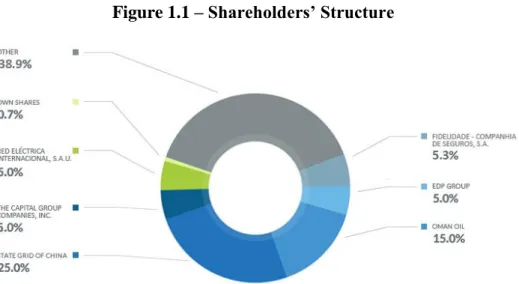
REN – Redes Energéticas Nacionais is the main Portuguese energy transmission operator, which transports and stores electrical energy and natural gas. The group is mainly owned by State Grid of China (25%) and Oman Oil (15%). However, also the EDP Group, Fidelidade – Companhia de Seguros, S.A. and other companies have participations in REN’s shareholder structure (see Figure 1.1).
The company’s mission is to secure electrical energy and natural gas supply with quality, safety, lower costs and avoiding interruptions. Moreover, it is essential to maintain the balance between consumers, energy producers and distributors concerning infrastructures usage.
Figure 1.1 – Shareholders’ Structure
Figure 1.1 shows REN’s current Shareholders’ Structure. The Shareholders presented are State Grid of China, Oman Oil, EDP Group, Fidelidade – Companhia de Seguros, S.A., The Capital Group Companies, Inc., Red Eléctrica Internacional, S.A.U., own shares and Other.
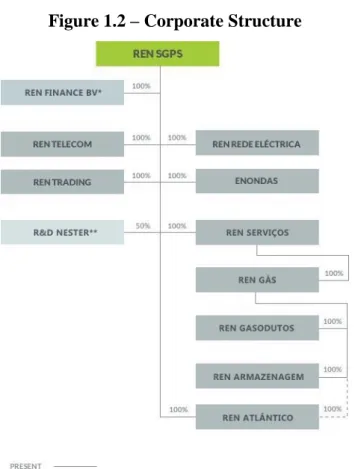
Besides its core business (REN Rede Eléctrica and REN Serviços), the group is also comprised by the following companies (see Figure 1.2):
REN Finance, B.V. – provides management advices to other companies and acquires and assigns industrial and intellectual property rights;
RENTELECOM – telecommunications public network operator. Provides optical fibre networks for electrical energy and natural gas transportation. Offers specific
4 technical areas for telecommunication structures (antennas and support equipment). It also delivers IT services, such as Private Voice Network (SRPV) services and consultancy in telecommunication networks;
REN Trading – focused on purchasing, selling, importing and exporting electrical energy. It also provides management services regarding Energy Acquisition Contracts (PPAS);
ENONDAS – develops and improves the production of wave power energy, aiming to connect this energy source to the public energy grid;
R&D Nester – focused on research, development and innovation in energy systems. Provides consultancy services concerning the energy sector.
Figure 1.2 – Corporate Structure
Figure 1.2 presents REN’s current Corporate Structure. The group is comprised by REN Finance BV (*company incorporated under the laws of The Netherlands), REN Telecom, REN Trading, R&D Nester (**this company is a result of a partnership between REN and State Grid regarding R&D in the energy sector), REN Rede Eléctrica, Enondas, REN Serviços, REN Gás, REN Gasodutos, REN Armazenagem and REN Atlântico.
1.2 History of REN
Established in 1994 as REN - Redes Energéticas Nacionais, its history remotes to 1947 when CNE- Companhia Nacional de Electricidade was founded as the national electricity
5 grid operator. REN foundation resulted from EDP’s restructuring process, which originated several energy-related companies.
In 2000, due to Group EDP’s privatization process and by government’s decision to avoid the energy sector segments (production, transportation and distribution) to be owned by just one company, REN left the Group EDP to become the main Portuguese energy grid operator.
As several important Portuguese state-owned companies, REN was privatized and this process was done through three stages.
First Stage – Occurred in 2007, through public offering the Portuguese state earned €275 million by selling a 19% stake;
Second Stage – In 2012, the government sold 40% of its shares to two foreign companies namely, 25% to State Grid of China and 15% to Oman Oil, by €387,15 million and €205,06 million, respectively;
Third Stage – Finally in 2014, the privatization process was concluded. The Portuguese state sold its remaining stake through public offering, thus getting €157 million for 11% of the company’s shares.
As other similar processes in Portuguese former state-owned companies, REN’s privatization is highly related to political and economic situations. Moreover, this whole process changed significantly REN’s shareholder structure (see Figure 1.1) and had a considerable impact on firm’s strategy and management.
1.3 Energy Industry
All around the world, public utilities are often associated to natural monopolies, the energy transport sector in Portugal is no exception. It is regulated by ERSE (Entidade Reguladora dos Serviços Energéticos), which is responsible for the regulation of the electricity and natural gas markets. As the only Portuguese energy grid operator REN holds the National Electricity Transmission Grid (RNT) and the National Natural Gas Transportation Grid (RNTGN).
Regarding RNT, by covering the country REN has established interconnections with the Spanish network (REE). With which it have been developing new agreements aiming a strong interconnection between the two countries. Regarding the investment, it has been keeping up with the growth of consumption and reinforcing the grid, in order to integrate renewable generation, especially wind power, in the transmission system. Also, the
6 company has a 50-year concession, since 2007, for very-high voltage transmission services and technical management of the Portuguese electricity system.
About RNTGN, the investment has been increasing as well as the country’s consumption in this sector. Mainly in order to create conditions to integrate diversified sources and to guarantee the security of the grid and the country’s supply. Concerning the regulatory context of this industry, REN has 40-years concessions, since 2006, for high-pressure transmission services and technical management of the domestic natural gas system, storage and regasification of liquefied natural gas and underground storage of natural gas. REN, as a European Transmission System Operator (TSO), is also a member of ENTSO-E (ENTSO-European Network of Transmission System Operators for ENTSO-Electricity) and ENTSO-ENTSOG (Network of Transmission System Operators for Gas). These two organizations aim to stimulate and coordinate the European grid in order to provide secure operations and facilitate the integration of new generation energy sources.
Being part of this sector, REN aims to a sustainable development framework, with Portugal remaining its core market. Moreover, the continuous investment in R&D is crucial to improve the technological grid performance as well as its reliability. Concerning a possible internationalization strategy, REN’s approach is to gradually explore new opportunities abroad, in order to diversify revenues streams, lower regulatory and financial risk and create shareholder value. Thus, this recent entry of two important players in the global energy sector (State Grid and Oman Oil) in REN’s shareholder structure, will allow the company to access new markets and new technology.
7
2. Problem Definition
In a privatization process context, a discussion concerning its effects on the country’s political, economic and social aspects is usually triggered. However, this debate should be done considering the company’s perspective too. Regarding this perception, the impact can be analysed through several features, including changes in the company’s global strategy, in the quality of its services or products, in its human resources strategy, in the consumer’s perception, its management system or its financial performance.
Thus, the objective of this thesis is to determine the impact on the last one, the impact of privatization on a company’s financial results.
In order to understand these effects and conclude about the differences between the pre- and post-privatization financial performance, the following subjects will be analysed, through a literature review:
I. How state-owned organizations approach its financial results; II. How private firms approach its financial performance; III. Privatization and natural monopolies;
IV. Privatization effects on a company’s financial results;
In the next section a brief literature review will be done, aiming to understand and analyse the existing literature on the above topics.
8
3. Literature Review
3.1 State-owned Organizations
The existing literature regarding privatization emphasizes the differences between state-owned enterprises (SOEs) and private firms, as well as the importance of privatization’s effects on former SOEs and respective countries’ economy and politics. One major element in this subject is the government and its approach to SOEs’ corporate governance. A state-owned company is defined as “a legal entity that is created by the government” and it can be either wholly or partially owned by a state.
“Governments are not famous for efficiency” (Olson, 1973), prior studies have showed
that state-owned corporations are less likely to achieve better financial and operating performances than privatized firms (Megginson & D'Souza, 1999).
This type of organizations is usually related with lack of efficiency and profitability. Related with this corporate inefficiency are factors such as the difficulty to manage and control this large sized corporations, the lack of competition and political interference that may occur. However these factors depend significantly on the country’s context and situation, states with high percentage of corruption and doubtful democracy systems are more likely to influence negatively the factors mentioned above.
Therefore, this government failure leads to a discrepancy between the political power and the social welfare responsibilities in state-owned corporations (Vickers & Yarrow, 1991). According to M.Shirley and P.Walsh, there are two sets of assumptions regarding government behaviour and SOEs, namely the Social-Welfare Maximizing Government and the Self-Interested Government.
In the first one, government’s objective is to maximize social welfare, assuming that political markets work efficiently. However, in this situation, the approach to market failure depends on factors as the ease with which contracts are monitored, potential competition among private suppliers or the importance of non-contractible quality and innovation.
Concerning the Self-Interested Government set, it defines the conditions under which politicians will use SOEs to meet political goals. Such as the correlation between that behaviour and the degree of imperfection in the political markets, the ease with which budgets and regulations can be manipulated or the nature of the institutional relationship between the government and the company, as a ministry’s department or through a board of directors.
9 Although state-owned organizations are related to low profitability and corporate efficiency, there are several state-owned companies that, not only provide essential services but also achieve positive financial and operating results. Through this type of performance, public sector corporations can be used to influence economic activity in a positive way.
Thus, although the global image of poor performance corporations, state-owned companies can aim to efficiency and profitability along with a positive influence in a country’s economy. It all ends up on how the government leads with the factors already mentioned, in order to provide quality services to its population and still achieve a good corporate performance.
This type of companies are regularly evaluated and compared to private companies, a brief comparison and introduction to this issue will be discussed in the next topic.
3.2 Private Firms
According to Merriam-Webster dictionary, a private corporation is defined as a
“corporation organized for the profit of its members or in which the entire interest is not held by the state.”
Prior studies on the contrast between state-owned and private firms indicate that privately owned companies demonstrate better overall performance outcomes (Savickaite & Rimkus, 2011).
The reasons considered by several studies to conclude that privately owned corporations achieve better financial and operating performances than firms owned by governments are related with some factors. As politics, mentioned in the previous topic, which is related with corruption, abuse of power and problematic political contexts in some countries. Regarding competition intensity and differences between markets, which in case of failure it can lead to variances between welfare objectives and a company’s profitability (Vickers & Yarrow, 1991). Also, regarding social welfare, private companies do not have the need and the responsibility to provide quality services and products to the general population, although it must be part of a company’s ethics.
Additionally, the difference between a state and a privately owned company are the goals concerning its performance. Whilst a government must aim to satisfy its population needs through quality and social responsibility, a private firm may focus on satisfying its shareholders goals through the best financial performance possible.
10 Thus, in contrast with state-owned corporations, “the private sector should not be
presumed to act in the public interest; clearly their primary accountability is to their shareholders” (Aulich & Hughes, 2013).
These differences between government and private management, sometimes lead to privatization processes. Which will be addressed in the next subject of this literature review.
3.3 Privatization
“Privatization encompasses the whole or partial sale of state-owned companies to private investors” (Layne, 2000). Several scholars have discussed the impact of privatization on
the world economy, politics and society. Also addressing this discussion to forms of privatization, which type of companies and sectors should be privatized along with the benefits and risks concerning this process.
Regarding the arguments and risks directly linked with the process of privatization, The Chicago Council on Global Affairs developed a strategic framework to assess what should be privatized and how, not only in US cities but also worldwide. They addressed several arguments for privatization such as, funding infrastructural needs, provide a source of direct revenue for public budgets and better efficiency at a lower cost. More advantages can be added concerning less political interference and also depending on the type of market, this process can increase competition, due to the deregulation that occurs alongside with the privatization of most of state-owned monopolies.
Concerning the risks of this process, The Chicago Council on Global Affairs considers aspects as, constraint of future options regarding specific markets, social implications that may affect negatively some groups of the country’s population and the possible undervaluation of the sold assets. Besides these features, risks as potential dividends losses by governments and the regulation of a possible private monopoly, should be analysed by each state in order to protect the public interest.
About the impact of privatization on firms’ employees, is usually associated to layoffs. However, some scholars concluded that this process involves no negative consequences to employees (Brown, Earle, & Telegdy, 2005).
Furthermore, concerning a company’s stock value, prior studies show that the effects of this process are exceptionally positive. Several scholars have analysed this impact and concluded that it increases liquidity of the privatized firms’ shares.
11 Moreover, it influences positively not only the privatized stocks, but also the stock market as a whole. These potential benefits are associated with cross-listing, which enhances the participation of foreign investors in domestic markets, increasing the liquidity in these markets, especially regarding developed countries (Bortolotti, De Jong, Nicodano, & Schindele, 2004).
Privatization is also highly associated to have a positive effect on the global stock market trading volume and to market-adjusted returns on shares purchased by investors during a privatization process (Megginson & Boutchkova, 2000).
Regarding credit rating, usually it is higher for public firms than for private ones, due to the low probability of default of government activities. Therefore, privatized companies are associated with higher costs of debt. However, fully privatized firms have lower credit spreads than those partially owned by the state. This correlates complete privatizations to improvements on firms’ competitiveness and productivity, whilst partially privatized companies are in-between these two types of conditions (Borisova & Megginson, 2011). Regarding the privatized companies financial and operating performance, several studies indicate that in terms of profitability and efficiency, its results improve after the privatization (Fischer, Gutierrez, & Serra, 2002).
Moreover, a study conducted by D’Souza and Megginson during the period of 1990 to 1996, which compared the pre- and post-privatization financial performance of 85 companies from 13 developing and 15 industrialized countries, concluded that “Privatization “works,” and it works in almost every institutional setting examined.” Therefore, most of prior literature concerning privatization effects on firms have been drawing similar conclusions about this subject, by setting the privatization process with positive consequences to privatized companies.
However, privatization results will depend on the environment and industry where it is implemented. The governments, regulation and management strategies play a strong role on whether this process has a positive or negative impact on a firm. Thus, this type of process as to be examined and evaluated on a case to case basis (Dawley & Haidar, 2008). The next subject will address existing literature regarding natural monopolies contexts, in order to understand the effects of the privatization process in a natural monopoly situation.
12
3.4 Natural Monopolies
Among several definitions, “if the entire demand within a relevant market can be satisfied
at lowest cost by one firm rather than by two or more, the market is a natural monopoly”
(Posner, 1968). Moreover, a natural monopoly can be defined as a type of monopoly which results from high fixed costs of operating a business in a certain industry.
The most common example associated with natural monopolies is the utilities industry, such as water supply systems, railroads and energy transmission systems. These industries are usually considered natural monopolies due to its extremely high fixed costs associated with infrastructure and other tangible assets. As in any monopoly scenario, other characteristics of this type of monopoly are the existence of economies of scale and the fact that multiple firms cannot benefit from this feature. Thus, in a natural monopoly, the major entry barrier would be the need to duplicate infrastructures and network to be able to compete in that specific industry.
When the subject concerns to natural monopolies, the most discussed topic among scholars and economists, is definitely regulation. Policies regarding this type of monopolies have been varying from limited regulation to dramatic expansion reforms, mainly regarding the scope of price and entry policies. However these changes on regulation, have been extended to industries that are not natural monopolies. These adverse effects of economic regulation led to the deregulation of industries previously under the scope of price and entry regulation, to a reduction of the application of this type of scope and to a new form of regulatory mechanisms based on performance (Joskow, 2007).
Moreover, the regulation of this type of industries can be perceived through the government’s point of view or through its role on the company’s scheme. Government policies are influenced by the fear that, without regulation, privatized public firms will raise their product and service prices which would have negative effects on social welfare. Regarding the role of regulation on the company’s structure, when natural monopoly public enterprises are privatized in an unregulated market on which property rights are not secured, management is likely to take a short run view of profit maximization. The ideal institutional environment would be the one in which incentives to investment of resources are a main feature, in order to improve the quality of services provided by newly privatized firms (Bradburd, 1995).
13 This literature review suggests that, mainly in developed countries, the effects of privatization, alongside with proper market regulation, are positive concerning a company’s financial and operating performance. Furthermore the expected impact of this type of process is associated also, to growth on a country’s economy and stock market exchange.
14
4. Research Problem
As the literature review conducted in the previous section shows, the differences between public and private management lead in many countries to privatization processes. These privatizations influence a wide range of features, either on a company’s management or in a country’s economy. Moreover, if this process occurs in a different type of market, such as a natural monopoly, other conditions will arise, for instance regulatory mechanisms and policies. Furthermore, the existing literature refers to privatization as a positive resolution when complemented with realistic regulatory policies.
Regarding REN’s case and relating it with the topics above mentioned, REN’s privatization process ended in 2014 with several effects on the company and the country. Two large shareholders have entered the company’s capital (State Grid of China and Oman Oil) and the Portuguese government completed the privatization of the main Portuguese energy transmission operator, which runs the energy grid natural monopoly in the country.
Thus, a detailed investigation will be conducted concerning the financial performance of REN, before and after the second stage of the privatization process. The moment of this comparison was chosen due to its importance in the whole process, after this stage the government held only 11% of the company’s shares and the entry of the two large shareholders mentioned above is seen as an important step in the whole process.
Furthermore, in order to understand the impact of privatization on REN’s financial performance, a conceptual framework is made to comprehend the following extents:
I. The impact of privatization on REN’s financial ratios; II. The effects of privatization on REN’s credit rating; III. The impact of privatization on REN’s stock price.
These three features result from the literature review and how it relates with REN’s case and will be analysed individually and between each other, through the methodology presented in the next section.
15
5. Methodology
In this section, in order to better examine the impact of privatization on REN’s financial performance, a methodology for data analysis will be determined by addressing the three features included on the conceptual framework raised in the previous section: the impact of privatization on REN’s financial ratios, the effects of privatization on REN’s credit rating and the impact of privatization on REN’s stock price.
Subsequently the analysed data will be collected from REN’s and Portuguese market official sources, such as the company’s quarterly and annual reports as well as the Portuguese Stock Exchange. The examined data will concern to the 2010-2015 period, in order to compare the performance before and after 2012, when a major step occurred in the privatization process.
Thus, in order to measure each feature mentioned on the conceptual framework, the following financial ratios will be analysed.
5.1 Profitability
Profitability ratios are used to evaluate the company’s ability to generate profits relating it with other financial features, such as equity, assets or expenses.
These indicators are often used to compare the company’s results with its competitors, on the other hand, these features are also frequently compared within the company itself, in order to determine whether or not the company is becoming more profitable throughout the years. The ratios to be examined are the following:
5.1.1 Profit Margin
Profit margin measures how much out of the selling price turns into profit. There are several types of analysis and conclusions resulting from profit margin ratios. Low profit margins are usually related with low market share, industries in recession, poor cost control management and poor pricing strategy. In contrast, a higher profit margin points toward a relatively profitable company, with better control and decisions over its cost and pricing strategies compared with its competitors.
Additionally, profit margin has limitations such as it should be used to compare companies within the same industry as companies in different industries will probably
16 have different business models. Also, comparing companies without profit should be done with different measures and ratios. The formula for this ratio is as follows:
Profit Margin = 𝑁𝑒𝑡 𝐼𝑛𝑐𝑜𝑚𝑒𝑅𝑒𝑣𝑒𝑛𝑢𝑒 (5.1)
5.1.2 Return on Assets
Return on assets indicates how profitable a company is using its assets to generate profit. The ROA indicator provides investors a measure of how effectively the firm is converting its assets or investments into net income. A higher percentage of ROA indicates that the company is earning more money on less investment.
Besides being highly dependent on the industry, different industries may have different ROA averages, as well as profit margin indicator, ROA should be used to compare companies within the same industry or with the company’s previous ROA numbers. The formula for this financial indicator is the following:
ROA = 𝑇𝑜𝑡𝑎𝑙 𝐴𝑠𝑠𝑒𝑡𝑠𝑁𝑒𝑡 𝐼𝑛𝑐𝑜𝑚𝑒 (5.2)
5.1.3 Return on Equity
Return on Equity measures how much profit a company generates with shareholder’s equity, it indicates how effectively shareholder’s money is being employed.
This indicator may be compared within an industry with an averaged ROE of that specific market, although there are some variations depending on the type of business. Usually annual ROEs above 15% are considered as attractive investment indicators.
However, ROE indicator has a recognized weakness. The more amount of debt a company has, the less equity it has. Thus, considering a smaller equity base, a high ROE could still be generated by a small net income value. This ratio is calculated as follows:
17
5.2 Efficiency
Efficiency ratios are used to analyse how well a firm manages its assets and liabilities. These indicators should be compared within the same industry in order to comprehend the management efficiency among similar companies. Improvements in these ratios are usually associated with improved profitability. Thus, the only efficiency indicator to be analysed will be the asset turnover ratio.
5.2.1 Asset Turnover Ratio
This financial indicator measures the company’s ability to generate revenues using its assets. It depends on the type of industry, so companies of different sectors cannot be compared.
Generally, the higher the ratio, the more efficient the company is. However, it is possible for a company to have an increase in this ratio compared with previous years and, simultaneously, suffer a decline in its efficiency. In order to comprehend these variations, the changes in the ratio’s components must be analysed. Asset Turnover ratio is calculated as follows:
Asset Turnover = 𝑇𝑜𝑡𝑎𝑙 𝐴𝑠𝑠𝑒𝑡𝑠𝑅𝑒𝑣𝑒𝑛𝑢𝑒 (5.4)
5.3 Liquidity
Liquidity ratios are essentially used to determine a firm’s ability to pay off its short-term debt obligations. The two main components of these indicators are company’s liquid assets and its short-term liabilities. In general, when facing a higher valued ratio, one may determine the ability of a company to pay its short-term debts whilst funding its normal operations.
In contrast, a firm with low liquidity ratios may not be able to meet its obligations, as well as its operational costs. Furthermore, the liquidity indicator to be analysed will be the current ratio.
5.3.1 Current Ratio
The current ratio measures a company’s ability to meet its current liabilities. A low value of this indicator suggests that the firm would be unable to pay off its current obligations. However, it does not necessarily points towards bankruptcy, it will depend on the
18 company’s expectations of future earnings. On the other hand, a high ratio may suggest that current assets are not being used efficiently, poor financing decisions or poor management of its working capital.
Moreover, this indicator has limitations such as ratios from different industries can differ, so the comparison between firms should focus in the same industry and its lack of specificity, since it includes all of a company’s current assets, whether easily liquidated or not. The current ratio is calculated as follows:
Current Ratio= 𝐶𝑢𝑟𝑟𝑒𝑛𝑡 𝐿𝑖𝑎𝑏𝑖𝑙𝑖𝑡𝑖𝑒𝑠𝐶𝑢𝑟𝑟𝑒𝑛𝑡 𝐴𝑠𝑠𝑒𝑡𝑠 (5.5)
5.4 Solvency
Solvency ratios measure the ability of a company to meet its long-term obligations. These financial indicators are often related with liquidity ratios, in order to better comprehend how able is the firm to meet its financial obligations, both long and short-term. As the majority of financial ratios, this financial analysis depends on the type of industry and a situation of insolvency would force a company to go bankrupt.
Thus, the solvency ratios to be analysed will be Debt-to-Equity and the Interest Coverage ratio.
5.4.1 Debt-to-Equity
Debt-to-Equity ratio is a debt indicator used to measure a company’s financial leverage. It indicates how much debt is used to finance a firm’s assets compared with its shareholders’ equity value. The higher the ratio, the more aggressive is a firm’s financing strategy through debt. Moreover, higher values of debt are associated with high levels of risk. Furthermore, if the cost of debt is out of control, it can lead to bankruptcy.
As most ratios, D/E analysis must consider the industry in which a firm operates, due to the different amounts of capital necessary to operate in different industries. Utilities industry is usually associated with high levels of debt. The formula to calculate this financial indicator is the following:
19
5.4.2 Interest Coverage Ratio
Interest coverage ratio is used to measure how easily a company can pay interest on its outstanding debt. It determines the margin of safety a company has for paying interest with its available earnings, during a given period. Which indicates if a firm would be able to survive if unexpected financial problems would arise.
A low ratio, 1.5 or lower, means that the company’s ability to meet its interest expenses is unreliable. Furthermore, values below 1 indicate that revenues are not sufficient to satisfy firm’s interest expenses.
An analysis to interest coverage ratios over time will provide a reliable picture about a company’s financial position. Moreover, this ratio is considered to be highly variable, so stability may be an indicator of a good financial strategy. Bearing in mind the main subject of this paper, it is useful to consider that an interest coverage ratio of 2 is a suitable standard for a utility company. This financial indicator is calculated as follows:
Interest Coverage Ratio= 𝐼𝑛𝑡𝑒𝑟𝑒𝑠𝑡 𝐸𝑥𝑝𝑒𝑛𝑠𝑒𝐸𝐵𝐼𝑇 (5.7)
5.5 Credit Rating
Credit rating determines the probability of a borrower to pay back a loan within the period considered in the loan agreement. This assessment of creditworthiness is generally done by credit rating agencies such as Standard & Poor’s, Moody’s and Fitch.
It also determines whether or not the borrower will be receiving a loan, as well as the interest rate to be included in the agreement. Moreover, it can be considered from the investor’s point of view as an important feature to analyse when deciding to whether or not purchase the company’s bonds.
A poor credit rating indicates that the borrower has had some problems paying back loans in the past. In the other hand, a high credit rating suggests that the loan will be paid back entirely without any issues.
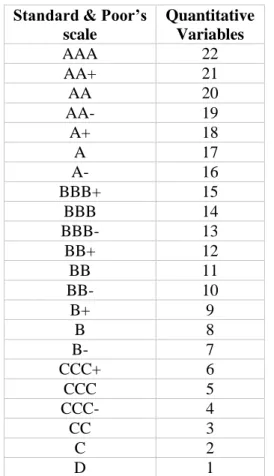
Furthermore, the scale to be considered for this study will be the Standard and Poor’s one. Which will be modified, through quantitative variables, in order to proceed with the statistical analysis. Thus, the following table shows how each number is addressed to each credit rating level.
20
Table 5.1 – Credit Rating’s Quantitative Variables Standard & Poor’s
scale Quantitative Variables AAA 22 AA+ 21 AA 20 AA- 19 A+ 18 A 17 A- 16 BBB+ 15 BBB 14 BBB- 13 BB+ 12 BB 11 BB- 10 B+ 9 B 8 B- 7 CCC+ 6 CCC 5 CCC- 4 CC 3 C 2 D 1
Table 5.1 shows how each quantitative variable is attributed to each Standard & Poor’s Credit Rating level.
5.6 Stock Price
The cost of purchasing a security on an exchange is extremely volatile. Its changes are related with demand and supply and how the stock is perceived by buyers and sellers. This perception can be influenced by several causes such as the type of news related with the company, its earnings or the dividends they expect to deliver to their shareholders. Thus, stock price indicates what investors feel a company is worth, however, stock price does not stand for company’s value.
Furthermore, the privatization’s impact on REN’s financial performance will be determined through the analysis of the financial indicators mentioned above in this methodology (Profitability, Efficiency, Liquidity, Solvency, Credit Rating and Stock Price).
The main data sources used in this study were REN’s annual and quarterly reports. It concerns to the 2010-2015 period, which comprises three year pre-privatization and three year post-privatization financial data. The currency used is the Euro and the accounting standards remained the same during the period mentioned above.
21 This analysis was done by using SPSS’s dependent samples t-test (paired samples t-test) at the p < .05 acceptance level to detect significant changes within the pre and post-privatization period. Meaning that, if “Sig (2-Tailed)” presented in SPSS results tables is greater than .05, the conclusion is that there is no statistically significant difference between the two conditions. On the other hand, if this value is less or equal to .05 it is possible to conclude that there is a statistically significant difference between the two conditions.
22
6. REN’s Financial Performance
As mentioned in the previous section, a dependent samples t-test (paired samples t-test) will be conducted at the p < .05 acceptance level on each ratio within the financial indicators previously determined (Profitability, Efficiency, Liquidity, Solvency, Credit Rating and Stock Price).
These statistical tests will be used to compare the means of two related groups (pre-privatization and post-(pre-privatization results) in order to determine if the means are significantly different from each other or relatively the same. The pre-privatization group is comprised by 2010, 2011 and 2012 financial results and the post-privatization group is defined by 2013, 2014 and 2015 financial outcomes.
The objective of these tests is to detect any significant changes that may exist on each financial feature within the 2010-2015 period.
6.1 Profitability
The following tests will evaluate the company’s ability to generate profits before and after the privatization process. As mentioned before, the financial indicators to be analysed in this section are Profit Margin, ROA and ROE.
Profit Margin
Regarding Profit Margin and how much out of the selling price turns into profit, the following figure shows this indicator’s values within the 2010-2015 period.
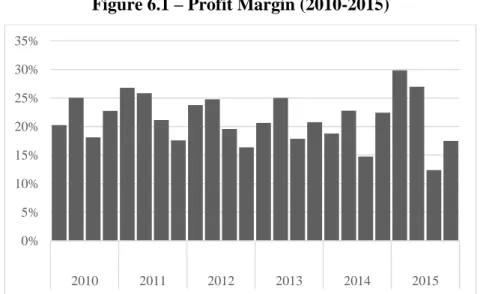
Figure 6.1 – Profit Margin (2010-2015)
Figure 6.1 represents Profit Margin values during 2010-2015 period, according REN’s official Reports.
0% 5% 10% 15% 20% 25% 30% 35% 2010 2011 2012 2013 2014 2015
23 As Figure 6.1 shows, the Profit Margin has been relatively stable throughout the last six years, due to the stability of Net Income and Revenue values (see Figure A.1). Reaching, within this period, its maximum value of around 30%, in the first quarter of 2015 and its minimum in the third quarter of the same year, with a Profit Margin of less than 13%. Moreover, a paired-samples t-test was conducted to compare Profit Margin results before and after the privatization (see Table B.1.1 and Table B.1.2). Furthermore, there is not a statistically significant difference between this two conditions, pre-privatization (M=0.2186, SD=0.035) and post-privatization (M=0.2080, SD=0.050); t(11)=0.809, p=0.436.
Return on Assets
Concerning ROA indicator, Figure 6.2 shows how profitable the company was using its assets to generate profit in the last six years.
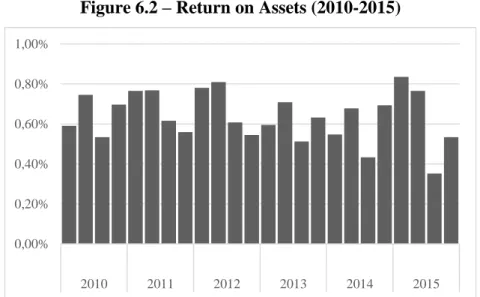
Figure 6.2 – Return on Assets (2010-2015)
Figure 6.2 exhibits Return on Assets values during 2010-2015 period, according REN’s official Reports.
As seen in Figure 6.2, the company’s quarterly ROA, concerning the third and fourth quarters, is been slightly decreasing since 2012, reaching a minimum of less than 0.40% in 2015. Meaning that after the privatization the company’s assets were generating less profit, which is explained by an increase of the Assets total value in 2013, while Net Income remained stable (see Figure A.1 and Figure A.2).
Moreover, the paired-samples t-test conducted to compare ROA means between 2010 and 2015 (see Table B.2.1 and Table B.2.2), resulted in a non-significant difference between
0,00% 0,20% 0,40% 0,60% 0,80% 1,00% 2010 2011 2012 2013 2014 2015
24 the two means. Pre-privatization (M=0.0067, SD=0.0010) and post-privatization (M=0.0061, SD=0.0014); t(11)=1.900, p=0.084.
Return on Equity
About ROE values, Figure 6.3 indicates how much profit the company generated with shareholder’s equity since 2010.
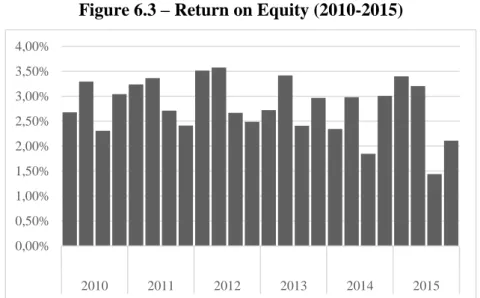
Figure 6.3 – Return on Equity (2010-2015)
Figure 6.3 presents Return on Equity values during 2010-2015 period, according REN’s official Reports.
The figure above shows a decreasing ROE since 2012, especially for the third and fourth quarters, reaching a minimum of 1.44% in 2015, this change, similar to ROA’s case, have happened due to the increase of Shareholder’s Equity values (see Figure A.3).
Additionally, the paired-samples t-test conducted to compare ROE results (see Table B.3.1 and Table B.3.2), concluded that there is not a statistically significant difference between the values before and after the privatization. Pre-privatization (M=0.0294, SD=0.0045) and post-privatization (M=0.0265, SD=0.0063); t(11)=1.953, p=0.077.
6.2 Efficiency
Regarding Efficiency and how the company managed its assets over the last six years, the already mentioned t-test will analyse a single financial indicator which is the Asset Turnover Ratio. 0,00% 0,50% 1,00% 1,50% 2,00% 2,50% 3,00% 3,50% 4,00% 2010 2011 2012 2013 2014 2015
25
Asset Turnover Ratio
Concerning the Asset Turnover Ratio, Figure 6.4 below shows the generated revenues by assets usage throughout the last six years.
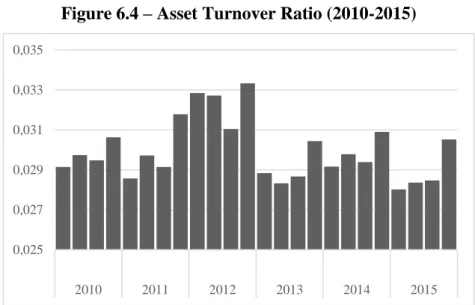
Figure 6.4 – Asset Turnover Ratio (2010-2015)
Figure 6.4 shows Asset Turnover Ratio values during 2010-2015 period, according REN’s official Reports.
As seen in Figure 6.4, this ratio had a substantial decrease between 2012 and 2013, mainly due to the fact that Revenues remain stable and the Total Assets value increased (see Figure A.1 and Figure A.2)
Furthermore, the t-test results showed that there is a significant difference between the pre-privatization and the post-privatization values (see Table B.4.1 and Table B.4.2). Pre-privatization (M=0.3075, SD=0.0017) and post-Pre-privatization (M=0.029, SD=0.0011); t(11)=2.916, p=0.014.
6.3 Liquidity
About Liquidity and how the firm is able to pay off its short-term obligations, the paired samples t-test will evaluate the company’s Current Ratio before and after the privatization procedure.
Current Ratio
The firm’s ability to meet its current liabilities over the last six years is represented in the figure below. 0,025 0,027 0,029 0,031 0,033 0,035 2010 2011 2012 2013 2014 2015
26
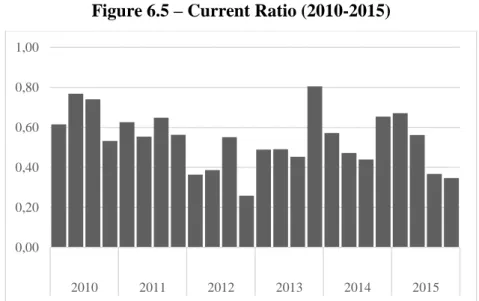
Figure 6.5 – Current Ratio (2010-2015)
Figure 6.5exhibits Current Ratio values during 2010-2015 period, according REN’s official Reports.
As Figure 6.5 indicates, this ratio had a major decrease in 2012, explained by the fact that Current Liabilities increased substantially and Current Assets values remained stable (see Figure A.2 and Figure A.4). This ratio values returned back to normal in 2013, reaching a maximum value of over 0.8.
Additionally, the paired-samples t-test concluded that the Current Ratio values before and after the privatization process are not significantly different (see Table B.5.1 and Table B.5.2). Pre-privatization (M=0.5508, SD=0.151) and post-privatization (M=0.5267, SD=0.1328); t(11)=0.401, p=0.696.
6.4 Solvency
Regarding the firm’s ability to meet its long-term obligations, the statistical test will analyse the D/E ratio and the Interest Coverage ratio over the last six years, and determine whether privatization had a significant impact or not on these values.
Debt-to-Equity
Furthermore, in the figure below is presented the company’s financial leverage and how much debt was used to fund the company’s assets in comparison with its equity since 2010. 0,00 0,20 0,40 0,60 0,80 1,00 2010 2011 2012 2013 2014 2015
27
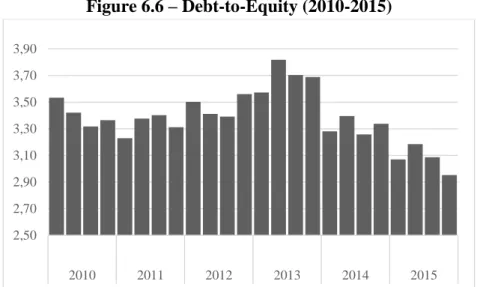
Figure 6.6 – Debt-to-Equity (2010-2015)
Figure 6.6 presents Debt-to-Equity values during 2010-2015 period, according REN’s official Reports.
As seen in Figure 6.6, the company’s D/E after reaching a maximum of almost 3.90 in the second quarter of 2013, has been decreasing substantially. Mainly due to a decrease in the firm’s Total Liabilities and a growth in Shareholder’s Equity value (see Figure A.3 and Figure A.4).
Additionally, the paired-samples t-test conducted to compare D/E values between 2010 and 2015 (see Table B.6.1 and Table B.6.2), resulted in a non-significant difference between the two conditions. Pre-privatization (M=3.40, SD=0.0946) and post-privatization (M=3.36, SD=0.279); t(11)=0.416, p=0.685.
Interest Coverage Ratio
About Interest Coverage ratios throughout the last six years, the following figure shows the margin of safety the company has had for paying interest with its earnings.
Figure 6.7 – Interest Coverage Ratio (2010-2015)
Figure 6.7 shows Interest Coverage Ratio values during 2010-2015 period, according REN’s official Reports.
2,50 2,70 2,90 3,10 3,30 3,50 3,70 3,90 2010 2011 2012 2013 2014 2015 1,50 2,00 2,50 3,00 3,50 2010 2011 2012 2013 2014 2015
28 As Figure 6.7 indicates, the Interest Coverage values were decreasing until 2013, in the following years this ratio have been growing considerably. This process is explained by the fact that the value of Interest Expenses has been falling substantially over the last 3 years (see Figure A.5).
Additionally, the t-test results showed that there is not a significant difference between the pre-privatization and the post-privatization Interest Coverage ratio values (see Table B.7.1 and Table B.7.2). Pre-privatization (M=2.508, SD=0.403) and post-privatization (M=2.277, SD=0.3399); t(11)=1.386, p=0.193.
6.5 Credit Rating
Regarding the Credit Rating, assessed by Standard & Poor’s, during the period of 2010-2015, it was determined that, in order to proceed with a statistical analysis, the ratings should be modified into quantitative variables, represented in Table 5.1. The following figure represents this financial feature throughout the referred period.
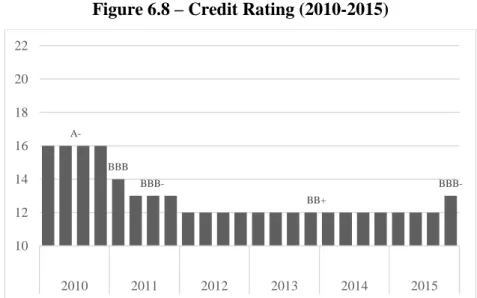
Figure 6.8 – Credit Rating (2010-2015)
Figure 6.8 presents Credit Rating values during 2010-2015 period, according REN’s official Reports.
As seen in Figure 6.8, in 2011 the company’s rating decrease substantially to a BBB- credit rating, this occurred due to the downward revisions of the credit risk levels of the country. This indicator remained relatively stable over the last years.
Furthermore, the paired samples t-test conducted showed that there is a significant difference between the pre-privatization and the post-privatization values (see Table B.8.1 and Table B.8.2). Pre-privatization (M=13.75, SD=1.765) and post-privatization (M=12.08, SD=0.289); t(11)=3.079, p=0.010. A-BBB BBB-BB+ BBB-10 12 14 16 18 20 22 2010 2011 2012 2013 2014 2015
29
6.6 Stock Price
Concerning the firm’s Stock Price in PSI 20 between 2010 and 2015, Figure 6.9 shows how investors perceived the company’s value during that period.
Figure 6.9 – Stock Price (2010-2015)
Figure 6.9 exhibits Stock Price values during 2010-2015 period, according REN’s official Reports.
As the figure above indicates, in 2012 REN’s Stock Price reached its minimum value, in the last six years, of less than 2,05€. Following this event, in 2013, the entry of two major shareholders into the company, namely State Grid of China and Oman Oil, with an acquisition of 40% of the firm’s shares, seemed to have a positive impact on these values as well as the public offering, the last stage of the privatization process in 2014. Since then the company’s Stock Price has been recovering former values.
Moreover, the paired-samples t-test conducted to compare Stock Price values before and after the privatization concluded that there is not a statistically significant difference between this two conditions (see Table B.9.1 and Table B.9.2). Pre-privatization (M=2.38, SD=0.327) and post-privatization (M=2.52, SD=0.247); t(11)= -0.909, p=0.383. 1,900 2,100 2,300 2,500 2,700 2,900 3,100 2010 2011 2012 2013 2014 2015
30
Concluding Remarks
Every privatization process triggers a long-lasting debate about the impact of this event on a company as well as in a country’s economy. Usually this discussion is highly focused on the country’s point of view, by determining which political, economic and social aspects are under the impact of this type of process.
Regarding the firm’s perspective, the debate may address the effect on a wide range of features such as in the company’s global strategy, consumer’s and shareholder’s perception, human resources strategies, financial results and several more aspects within a corporation. Also, other conditions may arise depending on the type of market, especially regarding regulatory mechanisms and policies.
Furthermore, this work is motivated by the attempt to comprehend the impact of privatization on a company’s financial performance by assessing the privatization of the Portuguese company, REN, the main energy transmission operator in the country. Over the last years, several Portuguese firms have been privatized, one major case was REN’s process. Each one of these situations raised political, social and economic queries among the Portuguese society. Concerning REN’s case, its privatization was composed by three stages, the first one in 2007, the second in 2012 and completed in 2014. The most important one was clearly in 2012, when two large shareholders entered the company’s capital (State Grid of China and Oman Oil).
Thus, 2012 was used as reference in order to compare the financial results of REN before and after the event described above, entry of new shareholders. Moreover, the data analysed refers to the quarterly financial results within the 2010-2015 period and was collected from REN’s and Portuguese market official sources. Financial indicators, Profitability, Efficiency, Liquidity, Solvency, Credit Rating and Stock Price, were examined and compared pre-privatization with post-privatization values. A statistical test, the paired samples t-test, was considered in order to determine the existence of significant differences between these values.
About the Profitability ratios, Profit Margin remained relatively stable throughout the years, ROA’s values decreased in some quarters just after the privatization however have returned to pre-privatization values last year and ROE has been decreasing substantially, especially regarding the second semester of each year. Although there were some changes in these ratios, the statistical tests concluded that there is not a statistically significant difference between the two periods.
31 Concerning Efficiency, the Asset Turnover Ratio had a substantial decrease, moreover the t-test results indicate a significant difference between pre-privatization and post-privatization results. Mainly due to the increase of Total Assets value and the stability of Revenues.
Regarding Liquidity, the Current Ratio had a major decrease in the privatization year, 2012, however it is returning to pre-privatization values. Also, these differences between the two periods were considered non-significant by the statistical test.
Furthermore, Solvency ratios as D/E, which has been decreasing substantially over the last years, and Interest Coverage Ratio, which has been increasing and returning to former values, after a considerable decrease in the first year after privatization. Despite a clear decrease in D/E values, the statistical test concluded that there is not a significant difference on both ratios pre-privatization and post-privatization values.
About the Credit Rating, despite the decrease in 2011, due to Portugal’s poor financial situation, it has been stable over the last years. Also, the t-test obviously confirms a significant difference between the examined periods.
Regarding Stock Price, after a low value of 2.01€ in the third quarter of 2012, it has been increasing and returning to former values. The statistical test results consider that there is a non-significant difference between pre-privatization and post-privatization values. As this statistical analysis indicate, privatization had a significant impact in two financial features. Regarding the Asset Turnover Ratio, this significant decrease means that the company’s ability to generate revenues using its assets was negatively impacted in the short-term. These values are explained by the increase of Total assets value started in 2012.
Concerning Credit Rating levels, the statistical difference is directly related to the downgrade of the country’s rating and it is the result of the impact of the financial crisis in Portugal’s economy. Thus, in this particular case, it is possible to conclude that the privatization process had no direct impact in these results.
The remaining financial indicators have not suffered any significant effects from privatization. Concluding, this privatization process had no significant impact in the short-term for the majority of the company’s financial results. For the Asset Turnover Ratio, the major component affected was the Total Assets value.
Moreover, there are some financial features which seem to be improving since privatization, such as the recovering to normal values regarding the Stock Price. Also, the decreasing values of D/E, which represents a decrease in the firm’s levels of debt.
32 Additionally, the growing Shareholders’ Equity values through increasing retained earnings, which contributes for the D/E results and to an improvement of investors’ perception.
Thus, looking back at the differences between SOEs and private firms, some of the mentioned impacts, analysed by scholars, are assessed in REN’s case. Starting with the Shareholders’ Equity value, which increased throughout the last years, it represents the focus on satisfying shareholders’ goals by reinvesting part of the profits in the company’s core business, in growth opportunities and also in paying debt.
Concerning the firm’s stock price, the increasing liquidity as well as the positive effects on its values mentioned in the literature review section, are being confirmed since the price have returned to normal values in 2014.
Regarding REN’s Credit Rating, although previous studies relate privatized companies with higher cost of debt and considering the impacts of the last financial crisis in Portugal, last year REN’s rating was raised and associated with a positive outlook. Which shows that companies can still achieve lower cost of debt, depending on the circumstances, even when they are not under government management.
About the significant decrease on Asset Turnover, it reveals the investment that is being done in assets and since REN is in the utilities market, it would be challenging to reach a good value of turnover, considering the massive values of Total Assets, usually associated with this type of industry. Also, as addressed in previous studies, in a privatization process governments and regulation are crucial on what type of impact this process has on a company. In REN’s case, the existence of a natural monopoly validates this knowledge and this is the reason why each privatization process should be evaluated in a case to case basis.
Furthermore, one of the constraints concerning this study relates to the period analysed, since it is restricted for a period of six years (2010-2015). Which disregards the first stage of the process in 2007. Also, it is only possible to conclude about the short-term results of privatization.
The second limitation is related with the sources used to obtain data. This analysis is based only on official sources and no other studies or works about REN or privatization’s effects in the Portuguese market were considered.
Thus, this work focused on studying the effects of privatization on firm’s financial results, using REN’s case in order to add a narrow scope to existent literature that approaches privatization’s impact on economy and companies performance. However, further
33 research should be made in order to assess the impact of privatization in the long term on Portuguese companies’ financial outcomes. Also, the development of studies regarding specifically, the effects of privatization on firms’ debt and equity, would be useful for future studies and scholars. The results of this type of studies would eventually support future decisions on whether privatization is a worthy option or not.
34
References
References taken from the Internet:
REN’s Strategy:
REN's Strategy. (n.d.). Retrieved September 25, 2015, from REN's Website:
http://www.ren.pt/en-GB/quem_somos/a_nossa_estrategia/ REN Trading:
REN Trading. (n.d.). Retrieved September 25, 2015, from REN's Website:
http://www.ren.pt/pt-PT/o_que_fazemos/outros_negocios/ren_trading/ ENONDAS:
ENONDAS. (n.d.). Retrieved September 25, 2015, from REN's Website:
http://www.ren.pt/en-GB/o_que_fazemos/outros_negocios/enondas/ RENTELECOM:
RENTELECOM. (n.d.). Retrieved September 25, 2015, from REN's Website:
http://www.ren.pt/en-GB/o_que_fazemos/outros_negocios/rentelecom/ REN Finance, B.V.:
REN Finance, B.V. - Special purpose financial information related to auditor's report. (2013, May 10). Retrieved September 26, 2015, from REN's Website:
http://www.ren.pt/files/2013-07/2013-07-30184418_4c65f7f1-2e56-4968-a1af- 585420fa64e0$$398db5f7-0776-4087-8ba6-a9123d15b2ef$$b1725142-2198-439e-93b3-84987eb42558$$file$$pt$$1.pdf
R&D Nester:
R&D Nester Profile. (n.d.). Retrieved September 26, 2015, from R&D Nester Website:
http://rdnester.pt/en-GB/about_us/profile/ First Stage of Privatization:
Agência Lusa. (2007, July 9). Privatização da REN superou expectativas, diz ministro
das Finanças. Retrieved November 20, 2015, from Publico's Website:
https://www.publico.pt/economia/noticia/privatizacao-da-ren-superou-expectativas-diz-ministro-das-financas-1298950
Second Stage of Privatization:
Cavaleiro, D. (2012, May 25). Privatização concluída: State Grid e Oman Oil já
compraram 40% da REN. Retrieved November 20, 2015, from Jornal de Negócios'
Website:http://www.jornaldenegocios.pt/empresas/detalhe/privatizaccedilatildeo_conclu iacuteda_state_grid_e_oman_oil_jaacute_compraram_40_da_ren.html
Third Stage of Privatization:
Carregueiro, N. (2014, June 13). Estado encaixa 157 milhões com privatização da REN
pouco concorrida por pequenos investidores. Retrieved November 20, 2015, from Jornal
de Negócios' Website:
http://www.jornaldenegocios.pt/empresas/detalhe/estado_encaixa_157_milhoes_com_p rivatizacao_da_ren_pouco_concorrida_por_pequenos_investidores.html