Nathália Santos Serrão de Castro
Msc. In Genetics and Molecular Biology
DNA
-
Protein interaction: a response regulatory protein
associated with Mo homeostasis in
Desulfovibrio alaskensis
G20.
Dissertation for a degree in Doctor in Sustainable Chemistry
Supervisor: Isabel Maria Andrade Martins Galhardas de Moura, Prof. Dr., FCT-UNL
Co-supervisor: Marta Sofia Peixe Carepo, Dr., FCT-UNL
President: Dr.Manuel Luís Magalhães Nunes da Ponte Examiners: Dr. Francisco Jorge Fernandes Caldeia
Dra. Sofia Rocha Pauleta Dra. Ana Rosa Leal Lino
Dr. Manuel Aureliano Pereira Martins Alves Dr. Stéphane Pierre Besson
Dr. Francisco Manuel Ferreia Girio
Members: Dra. Isabel Maria Andrade Martins Galhardas de Moura Dra. Marta Sofia Peixe Carepo
Dr. César António Tonicha Laia
DNA-Protein interaction: a response regulatory protein associated with Mo homeostasis in Desulfovibrio alaskensis G20
Copyright Nathália Santos Serrão de Castro, FCT/UNL and UNL
Acknowledgments
To prof. Isabel Moura to accept me in her scientific group and give me the entire laboratory supports to develop my PhD.
To Dr. Marta Carepo to be more than a co-supervisor and share with me all her knowledge about molecular cloning, protein expression, purification and characterization. Thanks to be my translator during my first days in Portugal and support me to solve all the bureaucracy that was necessary to stay here as a PhD student
To prof. José Moura to be more than a professor…to be a friend
To Dr. César Laia to be a friend and give me all the support during the fluorescence spectroscopy studies (from laboratory practice to results interpretation).
To Dr. Mireille Ansaldi, Laboratory de Chimie Bactérienne – Centre National de la Recherché Scientifique, to perform the DNase I footprinting experiments To Dr. Gustavo Sousa, Centre for Immune Regulation – Faculty of Medicine University of Oslo, to perform the nano-LC-MS experiments.
To Dr. Jose Miguel Manchenõ and Yana Alvarez, Consejo Superior de Investigaciones Científicas, thank you for the care and respect that you received me in your Institution.
To Biplap Maiti to teach me how to synthetize the phosphoramidate compound and help me with the theoretical calculations.
To Nuno Cerqueira to perform the computational biochemistry analysis. To Pablo Gonzalez e Gabriela Rivas to be a really good professionals and friends.
To Célia Silveira to be my gold key.
To my dearest Rashmi Nair to share with me her experience with proteomics and everyday moments of happiness.
To Susana Ramos to teach me to how to perform enzymatic activities studies To Magdalena Bober and Sergy George to be more than an “Erasmus” student, to be partners.
To Fundação para Ciência e Tecnologia for financial support (SFRH/BD/47040/2008).
All my love and respect to Catarina Nunes, Jacopo Marangon and Leonardo Dallagnol to be with me full time during this journey
RESUMO
Interacção entre DNA e proteína: uma proteína regulatória responsiva associada com a homeostasia do Mo em Desulfovibrio alaskensis G20
A transdução dos estímulos ambientais é fundamental para sobrevivência e adaptação bacteriana em diferentes habitats. O sistema de dois componentes é um mecanismo importante para a percepção e transdução de sinal bioquímico em bactérias. Esse sistema é composto, basicamente, por uma proteína histidina quinase e uma proteína reguladora responsiva que atuam em conjunto com a finalidade de fornecer a plasticidade bioquímica necessária para a sobrevivência e adaptação dos microorganismos.
A descoberta de um sistema envolvido na regulação da homeostasia do Mo em Desulfovibrio alaskensis G20 abriu novos questionamentos sobre quais seriam os mecanismos responsáveis pela regulação desse metal em bactérias sulfato-redutoras. Nesse sentido, postulou-se que um sistema composto por três proteínas (MorP, MorR e MorS) seria capaz de realizar a homeostasia do Mo. MorP (“molybdenum response associated protein”) é uma proteína periplasmática multimérica composta por 16-18
subunidades. Estudos de EXAFS juntamente com estudos de caracterização bioquímica mostraram que a MorP possui um centro metálico do tipo Mo-2S[2Fe-2S]-2S-Mo onde cada monómero possui um átomo de Mo e um átomo de Fe. As proteínas MorS e MorR constituiriam um sistema de dois componentes, onde a MorR actuaria como um factor 54 de transcrição do gene morP (gene responsável pela codificação da proteína MorP).
O objectivo geral desta tese é verificar se a proteína MorR interage com a região intergénica entre morP e morS, e analisar como ocorre esta interacção. Adicionalmente, pretende-se verificar qual a influência de moléculas doadores de radicais fosfato na estrutura conformacional da MorR.
A presente dissertação está dividida em cinco capítulos.
O capítulo II é constituído pelas metodologias e agentes usados para a clonagem do gene morR. As estratégias utilizadas permitiram que o gene da morR fosse clonado com sucesso e permitiram a expressão da proteína MorR tanto em pequena quanto em larga escala, resultando na forma solúvel da proteína. Adicionalmente, o contexto genómico do gene morR é avaliado e discutido.
O capítulo III é constituído por uma introdução sobre estudos envolvendo a fosforilação de proteínas similares a MorR. Esse capítulo também mostra os resultados da purificação e caracterização da proteína MorR. A proteína purificada é um monómero, e a proteína MorR recombinante não contem nem metal (Zn2+, Mo, Cu2+ and Mg2+) nem phosphoamino ácidos e, portanto, não é isolada no seu estado fosforilado. A região intergenica entre morP e morS foi amplificada e purificada, e os ensaios de mobilidade por electroforese foram realizados para mostrar se a proteína MorR ligava a esta região. Os resultados obtidos revelaram que a MorR liga a região intergenica e os experimentos de DNase I footprinting identificaram o sítio de ligação específico. O acetylphosphato e o phosphoramidato foram usados para fosforilar a MorR, e os resultados obtidos não mostraram nenhuma oligomerização após a fosforilação da proteína.
acetylphosphato.
O capítulo V é composto pelas conclusões do presente estudo e nós propomos um mecanismo que pretende explicar como a MorR actuaria como um regulador transcricional dos genes envolvidos na homeostase do Mo. Desse modo, nosso modelo propõe que na ausência do Mo, a MorR actuaria como um repressor da transcrição dos genes da morSR (via 70) e estaria inactiva para a transcrição do gene
morP (via 54). Nesse contexto, MorP actuaria como um repressor da proteína MorS, sendo esta incapaz de realizar autofosforilação, e, consequentemente, todo o sistema estaria inactivo. Na presença do metal, MorP desreprimiria MorS a qual realizaria autofosforilação, e, consequentemente, fosforilaria MorR. A MorR fosforilada desligaria do promotor 70 e seria capaz de activar a transcrição da morP via promotor 54. Desse modo, acredita-se também que a MorR possui um mecanismo de auto-regulação.
ABSTRACT
DNA-Protein interaction: a response regulatory protein associated with Mo homeostasis in Desulfovibrio alaskensis G20
The environmental signal transduction is fundamental for bacteria survival and adaptation to different habitats. The two component system is an important mechanism for the perception and transduction of the biochemical signal in bacteria. This system is composed by a histidine kinase and a responsive regulatory protein acting together in order to provide all the biochemical plasticity for the microorganism adaptation and survival.
The discovery of a Mo responsive homeostasis system in Desulfovibrio
alaskensis G20 opened new questions about the mechanisms involved in the regulation
of this metal in sulfate reducing bacteria. In this way, it was postulated that three proteins (MorP, MorS, and MorR) could be involved in the homeostasis of Mo. The MorP (“molybdenum response associated protein”) is a periplasmic multimeric protein composed by 16-18 subunits. EXAFS studies together with biochemical characterization data showed the presence of a heterometallic center, Mo-2S[2Fe-2S]-2S-Mo, shared by two subunits, where each monomer has one atom of Mo and one atom of Fe. The MorS and MorR might constitute a two component system where MorR might acts as a 54 transcriptional factor for morP gene (the gene responsible for the codification of MorP).
The general objective of this thesis is to verify if MorR interacts with the intergenic region between morP and morS, and analyze how this interaction occurs. Additionally, it does intend to verify the influence of phosphodonors molecules on MorR oligomerization.
The present thesis is divided into five chapters.
The chapter II is constituted by the methodologies and agents used to clone the morR gene. Those strategies allowed the success of the morR cloning and permitted the expression of the MorR protein both in small and in large scale, resulting in a soluble form of the protein. Additionally, the genomic context of morR gene is evaluated and discussed.
The chapter III gives an introduction about some studies of phosphorylation of proteins that shares similarities with MorR. This chapter shows the results of protein purification and biochemical characterization. The purified protein is a monomer, the purification yields is 0.5mg of pure protein per liter and the recombinant MorR does not contain neither metals (Zn2+, Mo, Cu2+ and Mg2+) nor phosphoamino acids and therefore is not isolated in a phosphorylated state. The intergenic region between morP and morS was amplified and purified and Electrophoretic Mobility Assay was performed in order to show if MorR binds to this region. The results obtained revealed that MorR is binding to the intergenic region and the DNase I footprinting experiments identified the specific binding sites. Acetylphosphate and phosphoramidate were used to phosphorylate MorR, and the results obtained did not show any oligomerization upon phosphorylation of MorR.
The chapter V is composed by the conclusions of the present study and we propose a mechanism that hopes to explain how MorR acts as a transcriptional regulator of genes involved with Mo homeostasis. In this way, our model propose that, in the absence of Mo, the MorR acts as a repressor of the transcription of the morSR genes (via 70) and would be inactive for the transcription of the morP gene (via 54). In this context, MorP would acts as a repressor of the protein MorS, which might be incapable to perform autophosphorylation, and, consequently, all the system would be inactive. In the presence of the metal, MorR would derepress MorS which would be allowed to peform autophosphorylation, and, consequently, phosphorylate MorR. The phosphorylated form of MorR would disrupt the binding to the 70 promotor and would be allowed to activate the transcription of morP gene. Moreover, we believe that MorR has a mechanism of autoregulation.
INDEX OF CONTENT
ACKNOWLEDGMENT VII
RESUMO IX
ABSTRACT XIII
INDEX OF CONTENT XVII
INDEX OF FIGURES XXI
INDEX OF TABLES XXVII
ABBREVIATIONS XXIX
Chapter I: General introduction 1
Context 3
I.1. Sulphate reducing bacteria 5
I.1.1. Molybdate in Desulfovibrio genus 6
I.2. Introduction of TCS 12
I.2.1. Sensor 13
I.2.2. Response regulator (RR) 15
I.2.2.1. TCS RR and DNA binding 16
I.3. Prokaryotic gene expression and regulation 17 I.3.1. Housekeeping 70 and transcriptional factors 19
I.3.1.1. Transcriptional activation 19
I.3.2. The 54 regulation 21
I.3.2.1. NtrC 21
I.3.2.2. CpxRA 24
I.3.2.3. ZraSR 25
I.3.2.4. torRTS system 27
I.4. Hypothesis of the present study 29
I.5. References 30
Chapter II: morR gene, cloning and MorR amino acid composition 43
Context 45
II.1. Methodology 47
II.1.1. Molecular cloning of morR 47
II.1.1.1. Cloning vector characteristic 47
II.1.1.2. DNA restriction mapping 48
II.1.1.4. Vector and fragment digestion with restriction enzymes 50
II.1.1.5. Vector and insert ligation 50
II.1.2 Protein expression 52
II.1.2.1 Small scale protein expression and optimization 52
II.1.2.2 Large scale protein expression 54
II.2. Results and Discussion 55
II.2.1. morR genomic context 55
II.2.2. Cloning 58
II.2.3 Protein expression 60
II.2.3.1. Small scale expression 60
II.2.3.2. Large scale expression 61
II.3. References 63
Chapter III: MorR biochemical characterization and DNA binding 65
Context 67
III.1. Introduction 69
III.1.1. Phosphorylation and response regulators (RR) 69
III.2. Methodology 71
III.2.1. Protein purification 71
III.2.2. UV-VIS spectroscopy 74
III.2.3. Protein quantification 74
III.2.4. N-terminal sequencing 74
III.2.5. Peptide Mass Fingerprint 74
III.2.6. Protein metal analysis 75
III.2.7. Molecular mass determination 75
III.2.7.1. Molecular mass determination upon phosphorylation 76
III.2.8.Nano LC-MS mass spectrometry 76
III.2.8.1. In solution digest 76
III.2.8.2. LC-MS/MS 76
III.2.8.3. Protein identification 77
III.2.9 Electrophoretic mobility shift assay (EMSA) 77
III.2.10. DNAse I Footprinting assay 78
(CHNS)
III.2.11.2. Nuclear magnetic resonance (NMR) 80
III.3. Results and Discussion 80
III.3.1. Amino acid residues composition: MorR 80
III.3.2. Protein purification 82
III.3.3. UV-VIS spectroscopy 83
III.3.4. Sequencing 84
III.3.5. Protein metal content 86
III.3.6. Determination of the molecular mass 86 III.3.7. Phosphorylation status of the pure MorR 88 III.3.8. Electrophoretic mobility shift assay (EMSA) 89
III.3.9. DNAseI footprinting 90
III.3.10. Ammonium hydrogen phosphoramidate synthesis 92 III.3.11. Acetylphosphate and phosphoramidate as MorR oligomeric
inductors
92
III.4. References 95
Chapter IV: MorR-DNA association and phosphorylation 99
Context 101
IV.1. Introduction 103
IV.1.1. Basic concepts of fluorescence 103
IV.1.2. Types of fluorophore 105
IV.1.2.1. Fluorescein 107
IV.1.3. Fluorescence quenching 108
IV.1.4. Fluorescence anisotropy 109
IV.2. Methodology 111
IV.2.1. dsDNA labeling with fluorescein 111
IV.2.2. Tunning the pka of dsDNA labeled with 6-FAM 112
IV.2.3. Protein-DNA binding 114
IV.2.4. MorR oligomerization 116
IV.2.5. Computational biochemistry 118
IV.3. Results and Discussion 118
IV.3.1. Fluorescein labeled oligonucleotide pka determination 118
IV.3.3. Study of MorR phosphorylation by fluorescence spectroscopy 131 IV.3.4. Identification of MorR phospho-peptides 134
IV.4. References 144
Chapter V: Conclusion 147
V. Conclusion 149
INDEX OF FIGURES
Figure I.1. Strucuture of ModAB2C2 transporter from Archeoglobus fulgidus. The ModA with Mo is represented in blue, the ModB in yellow and green and ModC in red and magenta. Taken from Aguilar-Barajas (2011) Biometals, 24, 687-707.
8
Figure I.2. The modABC operon from E.coli. The arrows above the genes represent
the transcriptional orientation mediated by ModE protein 8
Figure I.3 Structure of molybdenum cofactor (Moco) in the tricyclic form. 1)
Pyrimidine ring. 2) Pyrazine ring. 3) Pyran ring. 9
Figure I.4 The three steps of molybdenum cofactor biosynthesis 10
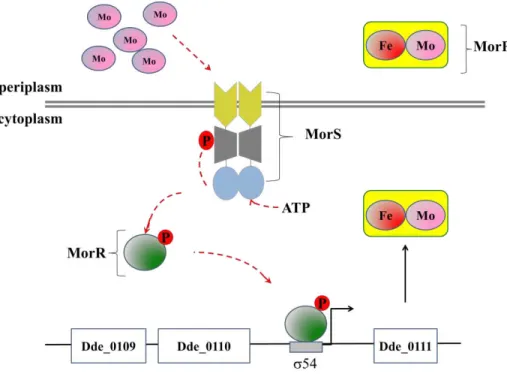
Figure I.5 Model for transcriptional activation of mor
two component system. 12
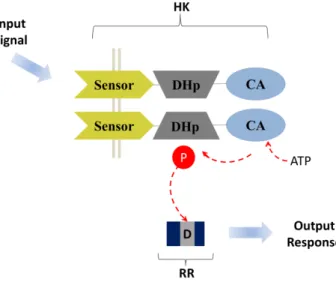
Figure I.6. Prototypic form of two component system. The histidine kinase (HK)
senses the environmental stimuli (input signal), autophosphorylates, then transfer the phosphoryl group to the cognate response regulator (RR).
13
Figure I.7. The diversity of HK sensor proteins. a) PDC sensors where the
extracellular domain senses the stimuli, b) HtrII-SrII where the sensor domain is membrane embedded, c) NtrB is a free cytoplasmic sensor domain, d) FixL is a membrane anchored that exhibit a cytoplasmic sensor domain with a PAS folding.
14
Figure I.8. Diversity of the C-terminal domain between the DNA binding regions of
response regulators. In red: the REC is the common N-terminal receiver domain. In blue: the NtrC/DctD central AAA+ ATPase domain. In green: the C-terminal DNA binding domain.
16
Figure I.9.HTH motif and DNA interaction. Taken from Carl O. Pabo (1992) Annu. Rev. Biochem, 61, 1053-1095.
17
Figure I.10. Structural organization of each subunit of bacterial core RNAP and the
holoenzyme. 18
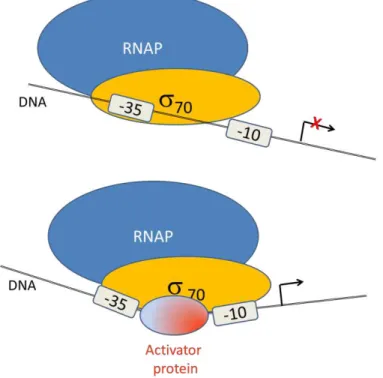
Figure I.11. Mechanism of RNAP complex stability mediated by an activator
protein. Adapted from David J. Lee (2012) Annu. Rev. Microbiol, 66: 125-152
20
Figure I.12. Mechanism of RNAP open complex formation mediated by an activator
protein. . Adapted from David J. Lee (2012) Annu. Rev. Microbiol, 66: 125-152
21
Figure I.13. Mechanism of RNAP54 transcriptional activation mediated by NtrC protein.
22
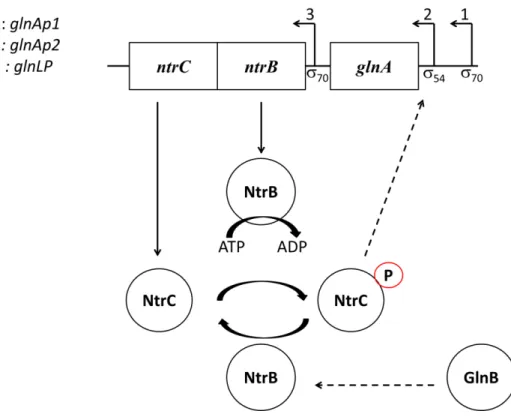
Figure I.14. ntrC/ntrB TCS regulating glnA transcription for nitrogen fixation in
bacteria. 24
Figure I.15. Mechanism of cpx regulation during envelope stress response. 25
Figure I.16. zraP and zraRS genes involved in Zn2+ and Pb2+ tolerance in bacteria. 26
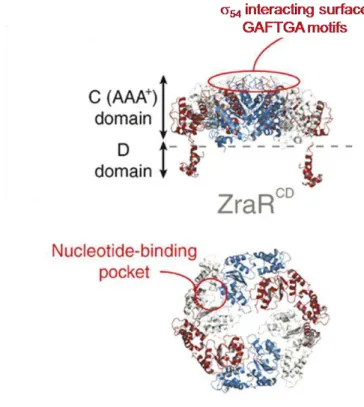
Figure I.17. The crystal strucuture of ZraR. The central (C) and DNA binding
domain (D) are highlighted. 27
Figure 1.18. The torRTS and torCAD system. 28
Figure II.1. pET21C cloning vector. A: the cloning vector map. Ap: ampicillin
resistance. Ori: origin of replication. lacI: lac repressor. T7 lac: 25bp lac operator sequence. f1 origin: bacteriophage origin of replication, and restriction sites are presented. B: The cloning/ expression region is evidenced. Adapted from Novagen pet-21-a-d (+) and Novagen 2002-2003 Catalog chapter 5.
47
Figure II.2. Restriction map for morR gene obtained from NEBcutter. The scale bar represents the number of nucleotides (1401bp) of morR from Desulfovibrio alaskensis G20, and on the top the correspondent number of aminoacids residues
(466 aa). The display below the scale shows the single cutter restriction enzymes sites for this gene sequence. Sites show in red have blunt ends, blue have 5` extensions and green 3` extensions. Enzymes marked with * are susceptible to DNA methylation.
Figure II.3. Scheme of the PCR cycle conditions. PCR thermal and time cycling are
schematically represented. 50
Figure II.4. Main principal steps of morR gene cloning. A) pET-21c (+) and PCR fragment containing morR gene with the recognition sites for NheI (in red) and EcoRI (in purple). B) pET-21c (+) and PCR fragment containing morR gene after digestion protocol exhibiting the cohesive overhangs produced. C) recombinant plasmid carrying morR gene after ligation, and subsequent plasmid transformation on Giga Blues competent cells. D) recombinant bacterial colonies in LB agar plate, isolation, and plasmid extraction and purification.
52
Figure II.5. Small scale MorR expression. The MorR expression was optimized
according to the experimental conditions: the optical density at 600nm (OD600) (0.5 and 1.0), the IPTG concentration (0, 0.5 and 1 mM) and time (T) of induction (zero hours, 4 hours and overnight).
54
Figure II.6. Genomic comparison and organization between morR and other similar response regulators in different types of gram negative bacteria. The genes are represented by arrows and the arrow direction shows the genomic orientation. The NCBI gene symbol is presented above and the description is inside the arrows. To facilitate the comprehension of this study, the morR, morS and morP nomenclature isn’t following the NCBI gene description. The scheme is organized according to megablast result taking into consideration the percentage of similarity (76% for zraR from D. vulgaris H, 72% for fis from D.vulgaris MF and 60% for zraR from E.coli O127:H6; Shigella F301 and S. Typhymurium LT2).
56
Figure II.7. Genomic context of morP, morS and morR. A) Genomic orientation. B) Intergenic region between morP and morS showing the conserved boxes, and ATG start codons. Arrows indicate the transcription direction.
58
Figure II.8. Different steps of molecular cloning process: PCR and pure insert and
plasmid after digestion. A): a) 1kb molecular ladder, b) PCR of morR gene. B): a) 1kb molecular ladder, b) purified digested PCR product, c) purified digested pET-21c (+).Running was performed in 1% agarose gel, in buffer TAE 1X, during 25 minutes at 100 V.
59
Figure II.9. Different steps of molecular cloning process: colony PCR and plasmid
extraction. A): a) 1kb molecular ladder, b-f) Colony PCR showing, each band corresponds to a single recombinant colony. B): a) 1kb molecular ladder, b-e) Isolated recombinant plasmids, each band correspond to a single recombinant plasmid. Running was performed in 1% agarose gel, in buffer TAE 1X, during 25 minutes at 100 V.
60
Figure II.10. Small scale protein expression at OD600 0.5. A 12.5% polyacrylamide
SDS-PAGE showing the expression profile of transformed BL21 (DE3) competent cells induced at OD 0.5. A) Ladders. B) Cells with 0 mM IPTG at zero hour. C) Cells with 0 mM IPTG after 4 hour. D) Cells with 0 mM IPTG after an overnight period. E) Cells induced with 0.5 mM IPTG at zero hour. F) Cells induced with 0.5 mM IPTG after 4 hours. G) Cells induced with 0.5 mM IPTG after an overnight period. H) Cells induced with 1 mM IPTG at zero hour. I) Cells induced with 1 mM IPTG after 4 hours. J) Cells induced with 1mM IPTG after an overnight period.
61
Figure II.11. Small scale protein expression at OD600 1.0. A 12.5% polyacrylamide
cells induced at OD 1.0. A) Cells with 0 mM IPTG at zero hour. B) Cells with 0 mM IPTG after 4 hours. C) Cells with 0mm IPTG after an overnight period. D) Ladders (116, 66.2, 45, 35 and 25 kDa). E) Cells induced with 0.5 mM IPTG at zero hour. F) Cells induced with 0.5 mM IPTG after 4 hours. G) Cells induced with 0.5 mM IPTG after an overnight period. H) Cells induced with 1 mM IPTG at zero hour. I) Cells induced with 1 mM IPTG after 4 hours. J) Cells induced with 1mM IPTG after an overnight period.
Figure II.12. 12.5% SDS-PAGE showing the cellular localization of MorR. A)
Ladder. B) Cellular fraction. 62
Figure III.1. Diagram of MorR purification 73
Figure III.2. Amino acids residues alignment of the D. alaskensis G20 MorR, S. typhimurium Zrar, S. Typhimurium NtrC, A. aeolicus NtrC1 and S. melilotiDctD. The three major conserved regions are represented as follows: receiver domain (red), ATPase domain (blue) and DNA binding domain (green). The phosphoacceptor aspartic acid (D55), Walker A, Walker B, GAFTGA and arginine finger (R-finger) are detached.
81
Figure III.3. Crystallographic structure of the central and C-terminal domains of
ZraR from S. typhimurium (PDB ID:1OJL).The two major conserved regions with MorR are represented as follows: ATPase domain (blue) and DNA binding domain (green). In red (Walker A), in orange (Walker B), in magenta (GAFTGA) and the arginine finger (R-finger) are detached and shown in brown in the second plane.
82
Figure III.4. 12.5% SDS-PAGE of purified MorR after each purification step. A:
ladders, B: after DEAE-FF column, C: after Source 15Q column, D: after Superdex 200 column.
83
Figure III.5. UV/VIS spectrum of purified MorR (20 M) in 10 mM Tris-HCl, pH
7.6. The arrow shows the maximum absorption peak at 278 nm.
84
Figure III.6. N-terminal and amino acid residues sequencing of MorR with the
corresponding nucleotide sequencing of pETMorR. Bold in yellow: N-terminal sequencing result. Bold in red: matched peptides by peptide mass fingerprint.
85
Figure III.7. Rf of standards proteins and MorR in 12,5% SDS-PAGE.
-galactosidase (-gal), bovine serum albumin (BSA), ovalbumin (Oval), lactate dehydrogenase (lac dehydro), REase Bsp981 (REase), -lactoglobulin (-lacto), lysozyme (lyso) and MorR.
87
Figure III.8. Determination of the molecular mass by Superdex 200 10/30 mm gel
filtration. The graphic shows the normalized values of distribution coefficient (Kav) and logarithm of molecular weight (Log MW). Standard proteins used for the calibration curve: Ribonuclease A (Ribo A), Ovalbumin (Oval), Conalbumin (Co), Aldolase (Aldo) and Ferritin (Fe)
87
Figure III.9. EMSA showing the DNA shift observed when MorR was mixed with the target DNA. The interaction was visualized in 7,5 % Native PAGE. A) DNA shift. B) free DNA.
89
Figure III.10. EMSA showing the protein shift observed when MorR was mixed
with the 233 bp intergenic region between morP and morS in 7,5 % PAGE. A) Free MorR. B) MorR shift. C) Free BSA. D) BSA mixed with the intergenic region where no shift was observed.
90
Figure III.11. MorR DNaseI footprinting experiment using the intergenic region
between morP and morS as DNA template. A 233bp labeled DNA fragment encompassing the intergenic region was digested with DNaseI. The MorR protected region are bolded in red. G, A, T and C are sequencing ladders. 1) 10 nM, 2) 6 nM, 3) 2 nM and 4) 0nM of heterologous MorR respectively.
Figure III.12 Analytical gel filtration chromatography showing the elution profile of
MorR with and without incubation with acetylphosphate or ammonium phosphoramidate (phosphoramidate). The intensity of UV280 nm was normalized.
93
Figure IV.1. Jablonski diagram and illustration of the relative positions of
absorption, fluorescence and phosphorescence spectra. IC: internal conversion (i.e. direct return to the ground state without emission of fluorescence). Dashed arrows: vibrational relaxation. ISC: intersystem crossing (possibly followed by emission of phosphorescence)
104
Figure IV.2. Normalized fluorescence spectra of W emission residues belonging to
five spectral classes A, S, I, II and III. The variability of the emission of the indole fluorophore makes W fluorescence a sensitive toll in protein analysis
106
Figure IV.3. Six ionic forms of fluorescein after Zanker and Peter (1958). Taken
from Smith and Pretorius (2002) Water SA, 28, 395-402. 107
Figure IV.4. Scheme of fluorescence anisotropy of a fluorophore according to
molecular motion upon interaction with a molecule (ligand). 111
Figure IV.5. Fluorescence emission and anisotropy of 6-FAM-67-mer dsDNA at
different pH, ranging from 5 to 9.2. A) Fluorescence emission raw spectra. B) Area normalized fluorescence emission spectra. The arrows indicate pH increase or decrease.
119
Figure IV.6. pH dependence of fluorescence intensity (circles) and steady-state
anisotropy (squares) of 6-FAM-67-mer dsDNA. Experimental fluorescence emission values were normalized for pH 7.5. Lines represent the fitting of the data assuming acid-base equilibrium which allowed the determination of pKa’s.
120
Figure IV.7. Diagram species of 6-FAM-67-mer dsDNA. At pH 7.5 the monoanioc
specie is prevalent (72%), followed by neutral (26%), dianionic (1%), and cationic (0.4%).
121
Figure IV.8. 6-FAM labeled dsDNA used for fluorescence anisotropy experiments.
The MorR nucleotide binding sites identified by DNaseI footprinting are represented in red, and the position of FAM is evidenced. A) FAM-67-mer dsDNA. B) 6-FAM-58-mer dsDNA.
123
Figure IV.9. Area normalized fluorescence emission of 6-FAM-67-mer dsDNA and
6-FAM-58-mer dsDNA along the titrations experiments. 124
Figure IV.10. Fluorescence anisotropy of 6-FAM-67-mer dsDNA and
6-FAM-58-mer dsDNA during the titrations experiments. The graphic shows the variation of anisotropy, where errors bars represent the standard deviation, and the squares and circles show the medium value obtained from seven anisotropy readings for each DNA strand. The equilibrium binding was analyzed according to equations 4.17, and the nonlinear least square mathematical model was applied and is presented as a straight line.
125
Figure IV.11. Distribution of the nucleotide binding sites of FAM-67-mer and
6-FAM-58-mer dsDNA in response to MorR interaction. The free DNA where that is no interaction with MorR is presented as line and circles. The first binding site occupancy is represented by a line and square. The second binding site occupancy is represented as line and triangle.
127
Figure IV.12. Binding sites occupancy of 6-FAM-67-mer and 6-FAM-58-mer
molecules with the fluorescence anisotropy enhancement. The first binding site occupancy is presented as line and square. The second binding site occupancy is presented as line and triangle, and the anisotropy is presented as line and asterisk.
129
Figure IV.13. Predict model for MorR-DNA interaction. The 6-FAM position is
circles represents the MorR protein
Figure IV.14. Raw spectra of MorR tryptophan emission during a titration with
phosphodonors. A) Acetylphosphate. B) Phosphoramidate. 132
Figure IV.15. Area normalized spectra of W emission during a titration with
phosphoramidate. 133
Figure IV.16. Static quenching for MorR titration with phosphoramidate (square).
The line represents the fitting of the data. 134
Figure IV.17. The MorR amino acid composition with conserved regions detached,
and the phospho-amino acids identified by nano LC-MS. The amino acids are colored according to its domain localization: red for receiver domain, blue for ATPase domain and green for DNA binding domain. W are bolded in yellow. The phospho-amino acids identified in both samples are bolded in grey and highlighted with an asterisk (*). The phospho-amino acids identified solely in sample submitted to phosphoramidate are bolded in red and highlighted with an hashtag (#).
136
Figure IV.18. Alignment between N-terminal receiver domain of MorR and E. coli CheY. The W are bolded in blue. Conservation is based on the physic-chemical properties of amino acids and the Consensus is the percentage of the modal residue per column.
137
Figure IV.19. Comparison of MorR phospho-amino acids localization in the ZraR
central domain crystal structure. A) Phospho-amino acids residues identified in sample submitted to phosphorylation with acetylphosphate and phosphoramidate. B) Phospho-amino acids residues identified solely in sample submitted to phosphorylation with phosphoramidate.
138
Figure IV.20. First step of the phosphorylation process with hydrogen-phosphoamid
and acethyl-phosphate. 140
Figure IV.21. Second step of the phosphorylation process. 141
Figure IV.22. Full energetic profile of the phosphorylation process. 142 Figure V.1. Model for morSR and morP transcriptional regulation proposed by the
INDEX OF TABLES
Table II.1. Primers designed for PCR reaction. Primer orientation, sequence
and restriction endonuclease site are shown. Restriction sites are underlined in the primer sequence.
49
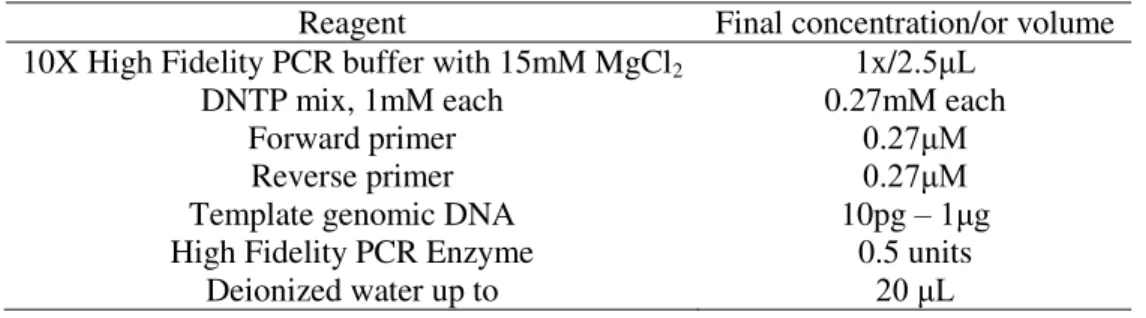
Table II.2. The PCR protocol for morR gene amplification. The PCR mixture
was designed for a total reaction volume of 20 µl. 49
Table II.3. pET-21c and morR PCR fragment preparation with restriction enzymes. Amplified morR PCR product and pET-21c were digested with endonuclease enzymes NheI and EcoRI as follows.
50
Table IV.1. Oligonucleotide name and sequence which were labeled with
6-FAM at 5` end. 112
Table IV.2. pKa values of free fluorescein, FITC-9-mer dsDNA and
6-FAM-67.mer dsDNA. 121
Table IV.3.Association constants determined for MorR binding to the
intergenic region between morS and morP following the two step binding model. K1 is the association constant for the first binding site and K2 for the second binding site. The anisotropy value (r) of the fluorophore is also shown
125
Table IV.4.MorR binding sites proposed occupancy according to the two
binding sites model. 126
Table IV.5. Fluorescein-dsDNA single-photon counting analysis as a
function of the MorR protein concentration. 131
Table IV.6. Post-translational modifications (phosphorylation) identified by
nano LC-MS mass spectrometry. The modifications are highlighted; the phospho-amino acids are underlined.
ABBREVIATIONS
6-FAM 6- Carboxyfluorescein
4aHTH Four-helix helix-turn-helix
Alfa
AAA+ Protein domain responsable for converting Adenosine Triphosphate hydrolysis to mechanical force
AgrA DNA binding response regulator belonging to LytTR family
ABC Ammonium bicarbonate
AmiR RNA binding response regulator of amidase operon
W Tryptophan
AraC Response regulator of arabinose operon
ATP Adenosine Triphosphate
Beta
BL21 Host cell for gene expression
nt Nucleotide
bp Base pair
Bprom Prediction of Bacterial Promoters
BSA Bovine Serum Albumin
CA Histidine kinase catalitic domain CAP Catabolic Activation Protein
CheA Chemotaxis protein A, histidine kinase CheW Chemotaxis protein W, purine binding CheY Chemotaxis protein Y, response regulator CheZ Chemotaxis protein Z, phosphatase
CHNS Carbon, Hydrogen, Nitrogen and Sulfur elemental analysis
cI Regulatory protein involved in the maintenance of lambda lysogeny CIAP Calf intestinal alkaline phosphatase
CpxA Envelope stress protein, histidine kinase
cpxA Gene for envelope stress protein, histidine kinase CpxP Envelope stress protein, periplasmic
cpxP Gene for envelope stress protein that codifies the periplasmic protein CpxR Envelope stress protein, response regulator
cpxR Gene for envelope stress protein that codifies the response regulator
cpxRA Genes for envelope stress of two component system CpxRA Envelope stress two component system
CSIC Consejo Superior de Investigaciones Científicas- Spain
D Aspartic acid residue
DctD C4-dicarboxylate transport system, response regulator DEAE-FF Diethylaminoethanol fast flow
DNA Deoxyribonucleic acid
DrrB Response regulator of the OmpR/PhoB subfamily dsDNA Duplex Deoxyribonucleic acid
DTT Ditiotreitol
E.coli Escherichia coli
EcoRI Restriction enzyme obtained from Escherichia coli. R means R-factor EDTA Ethylenediamine tetraacetic acid
EMSA Electrophoretic mobility shift assay FeMoco Molybdenum-Iron cofactor of nitrogenase
FIS Factor of inversion
Fis-HTH Factor of inversion helix-turn-helix FITC fluorescein isothiocyanate
FliM Flagellar motor switch protein glnA Gene of glutamine synthetase
glnAP1 Promoter for bacterial nitrogen regulation
glnAP2 Promoter for bacterial nitrogen regulation required during nitrogen starvation
GlnB PII protein involved in signalling in glutamine synthetase and regulation of NtrB activity
glnLP Promoter for bacterial nitrogen regulation, autoregulation of NtrC
GlnS Glutamine Synthetase
HK Histidine Kinase
HTH Helix-turn-helix
HydG Old nomenclature of zinc resistance response regulatory protein (ZraR)
hydH Old nomenclature of gene that codifies a zinc resistance histidine kinase protein ICP-AES Coupled Plasma Atomic Emission Spectroscopy
IDT Integrated DNA technologies
IHF Integration Host Factor
IPTG Isopropyl β-D-1-thiogalactopyranoside IRC Internal reaction coordinate
MES 2-(N-morpholino)ethanesulfonic acid
Epsilon
Kav Distribution coefficient
kDa kilo Daltons
kq Bimolecular quenching constant
L Lysine
l Lambda
lacA Gene of bacterial transacetilase of the lactose operon LacI Bacterial transcriptional repressor of lactose operon lacY Gene of bacterial permease of the lactose operon
lacZ Gene of bacterial beta-galactosidase of the lactose operon
LB Luria Broth
LC-MS Liquid chromatography mass spectrometry
min Minute
m/z Mass-to-charge ratio
MS Mass spectrometry
AGC Automatic gain Control
ppm One part per million
Da Daltons
nr
Non-redundant GenBank coding sequencing (CDS) translations + protein data bank (PDB) + Swiss-Prot + protein information resources (PIR) + protein research foundation (PRF)
LytTR atypical DNA binding domain
MALD TOF matrix-assisted laser desorption ionization time of flight
mer From Greek meros "part" denotes the oligonucleotide lenght
mg Milligrams
mM Micromolar
Mo Molybdenum
Moco Molybdenum cofactor
modA Molybdenum ABC transporter, gene of the periplasmic component
ModA Molybdenum ABC transporter, periplasmic component
modABC Molybdate transport genes
modB Molybdenum ABC transporter, gene of the membrane channel protein
ModB Molybdenum ABC transporter, membrane channel protein
modC Molybdenum ABC transporter, gene of ATP binding protein
ModC Molybdenum ABC transporter, ATP binding protein ModE Molybdenum ABC transporter, regulatory protein morP Gene for molybdenum response associated protein MorP Molybdenum Response Associated Protein
MorR Molybdenum response regulatory protein
morR Gene for molybdenum response regulatory protein morS Gene for molybdenum sensor kinase protein MorS Molybdenum sensor kinase protein
MtrA Response regulator of genes that codifies bacteria cell wall peptidases NarL Nitrate/nitrite response regulator
NbIR Non-bleaching protein B
nblA A gene involved in phycobilisome degradation (bleaching)
NCBI National Center for Biotechnology
NheI Restriction enzyme obtained from Neisseria mucosa heidelbergensis
nm nanometer
NTP Ribonucleoside triphosphate
NtrB Bacterial nitrogen assimilation, histidine kinase
ntrB Bacterial nitrogen assimilation, gene for histidine kinase
NtrC Bacterial nitrogen regulatory protein ntrC Gene for nitrogen regulatory protein NtrC 1 Nitrogen regulatory protein 1
OD Optical Density
OmpC Outer membrane porin, transport channel OmpF Outer membrane porin, transport channel OmpR Outer membrane porin, transcriptional regulator PAGE Polyacrilamide gel electrophoresis
PAS Signal sensory domain named based on three protein that it appear (Per, Arnt, Sim)
Pb Lead
PCR Polymerase chain reaction
PDB Protein Data Bank
pET plasmid vector for cloning
PleD Diguanylate cyclase
PMF Peptide Mass Fingerprint
pmol picomole
ppb One part per billion
PRM Promoter for repression maintenance
qRT-PCR Real time quantitative polymerase chain reaction
REC Response regulator domain
R-finger Arginine finger
RNA Ribonucleic acid
RNAP Ribonucleic acid polymerase
rpm Revolutions per minute
RpoS sigma 38 factor
RR Response regulator protein
rRNA Ribosomal ribonucleic acid
S Sulfur
sigma
SDS Sodium dodecyl sulfate
SMART Simple modular architecture research tool
SOC Super Optimal Broth
SRB Sulfate-reducing bacteria
STAGE-TIP Stop And Go Extraction Tip
T4 DNA Ligase Recombinant enzyme from 989. Escherichia coli NM T4 PNK T4 Polynucleotide Kinase
TAE Buffer Tris-Acetate-EDTA
TAT Twin Arginin Translocation
TCD Thermal Conductivity Detector
TCS Two Component System
TFA Trifluoroacetic acid
TMA Trimethyllamine
TMAO Trimethylamine N-Oxide
subunit
TorC Trimethylamine N-Oxide reductase I, cytochrome c-type subunit
torCAD Genes for trimethylamine N-oxide reduction system
TorD Chaperone involved in maturation of TorA subunit of trimethylamine N-oxide reductase system
TorR Trimethylamine N-Oxide reductase system, response regulator
torRTS genes for trimethylamine N-oxide two component system
TorS Trimethylamine N-Oxide reductase system, histidine kinase
TorT Trimethylamine N-Oxide reductase system, periplasmic protein
Trp Tryptophan
UV-VIS Ultraviolet Visible
omega
w-HTH winged helix-turn-helix
YJAI Old nomenclature of periplasmic zinc resistance associated protein
Zn zinc
ZraP Periplasmic zinc resistance associated protein
zraP gene for zinc resistance associated protein, the periplasmic protein
ZraR Zinc resistance associated protein, the regulator
zraR gene for zinc resistance associated protein, the regulator protein
ZraS Zinc resistance associated protein, the histidine kinase
zraS gene for zinc resistance associated protein, the histidine kinase
Chapter I
General Introduction
Context
I.1. Sulphate reducing bacteria
Microorganisms have a broad capacity to sense and rapidly respond to oscillations in the environment. This characteristic is vital to their adaptation and survival.
Escherichia coli, Bacillus subtilis and Saccharomyces cerevisiae have been used as model for the primary comprehension of the gene expression profile in response to environmental changes. However, the prokaryotic phylogeny is diverse and the prediction of a universal code of stress response becomes difficult to follow. A primary mechanism involved in signal transduction includes histidine kinase (HK) proteins belonging to Two Component System (TCS). A comparative analysis of 5.000 HK from 207 sequenced prokaryotic genomes showed that many signaling events were recently developed in the course of evolution and that some regulatory systems are not found in the key model microorganisms1,2.
SRB can be divided into four groups based on rRNA sequence analysis: Gram-negative mesophilic SRB, Gram-positive spore forming SRB, thermophilic bacterial SRB, and thermophilic archaeal SRB. Desulfovibrionaceae include a large family of Gram-negative mesophilic SRB, which comprise the genera Desulfovibrio and
Desulfomicrobium10. Until now, 26 Desulfovibrio genomes of SRB are available, and the genome of Desulfovibrio alaskensis G20 was recently updated11.
The Desulfovibrio alaskensis G20 (formerly Desulfovibrio desulfuricans G20) is a gram-negative mesophilic SRB that belongs to the delta subdivision of the Proteobacteria. The genome of delta subdivision is characterized by the presence of multiple copies of detoxification genes like rubrerythrin and the presence of predicted highly expressed 54 activator proteins12. Moreover, this strain can growth syntrophically, but no conserved genome feature has been identified as the cause of this ecological ability13. The microbial syntrophy under methanogenic conditions requires a mutual cooperation in order to transfer H2 or formate for electrons transferring. This type of interaction occurs between Desulfovibrio alaskensis G20 and Methanospirillum hungatei (methanogen bacteria), which is capable to induce Desulfovibrio alaskensis G20 growth under lactate and to produce acetate and H2 (used by methanogen to produce CH4). The quinine reductase complex (Qrc) and the tetrahaem periplasmic cytochrome c3 (TpIc3) is a family of redox complex that participate specifically in this process (of H2 and formate metabolism) and that are required by Desulfovibrio alaskensis G20 to grow syntrophically with lactate14.
I.1.1. Molybdate in Desulfovibrio genus
for nearly all living organisms (from bacteria to animals) and it is important for enzymatic reactions and acts as co-factor of proteins that are responsible for electron transfer in the processes of nitrogen fixation19–22
It is biologically available in the form of molybdate (MoO42−)20. In bacteria, molybdate enters the cell through specific transporters that are coded and regulated by the
modABCD operon23. Inside the cell, molybdate is integrated into metal cofactors, such as Moco in mononuclear Mo enzymes or FeMoco in nitrogenase24.
Figure I. 1.Strucuture of ModAB2C2 transporter from Archaeoglobus fulgidus. The ModA with Mo is represented in blue, the ModBin yellow and green and ModC in red and magenta. Taken from Aguilar-Barajas (2011) Biometals, 24, 687-707.
modABCD genes are negatively controlled by ModE protein, which binds
modA operator sequences. In the absence of molybdate ModE derepresses the modABCD
operon allowing transcription. ModE controls its own transcriptional level through a divergent promoter (figure I.2) 30,31.
Figure I. 2.The modABCD operon from E.coli. The arrows above the genes represent the transcriptional
orientation mediated by ModE protein.
contributes to the lability. The cofactor has a tricyclic pyranopterin structure with pyrimidine , pyrazine and pyran rings forming the organic moiety of Moco (often called molybdopterin (MPT)) (figure I.3). The phosphomethyl group is also labeled in the pyran ring. The Mo and W are coordinated by two dithiolene sulfurs that are attached to the pyran ring33.
Figure I. 3. Structure of molybdenum cofactor (Moco) in the tricyclic form. 1) Pyrimidine ring. 2) Pyrazine ring. 3) Pyran ring.
HN N N N O O P O P O P O -OH HO O -O O O -O -O O
H2N GTP
HN N N H H N O O P O
H2N
O O O O -MoaA/MoaC cPMP MoaD/MoaE MoeB IscS-SH HN N N H H N O H2N
O O P SH SH O -O O -Molybdopterin (MPT) MogA MoeA MoO4
2-HN N N H H N O H2N
O O P O -O O -S Mo S O O Cys
Molybdenum cofator (Moco)
Figure I.4. The three steps of molybdenum cofactor biosynthesis
isolated and characterized 41,42,43,44. Such an example is the Orange Protein (ORP) that presents a Mo-Cu-S cluster. Of the utmost importance was the recent characterization of the structural instability of the ORP cofactor and the gene transcriptional regulation of orp from D. vulgaris Hildenborough. In this context, the protein locus tag (called DVU2108) that shares 48% of identity with ORP was identified. DVU2108 is regulated by a 54 transcriptional factor and, in conjunction with other enzymes, may play a role in cell division is SRB45,46. Additionally, some studies showed that Mo is an important metal in
Desulfovibrio formate dehydrogenase (FHD) and mod gene expression47,48. In this way, Mo is capable to upregulate the Mo/W-fdh gene expression whereas downregulate the genes responsible for Mo transport. The Mo/W-fdh gene codifies a FDH that incorporate Mo or W in its structure. Moreover, isoforms of FDH, such as FdhABC3, present specific behavior and the incorporation of Mo ion into the active site of FDH is selective.
The discovery of a molybdenum response associated protein (MorP) led to the hypothesis that this protein could be involved in a Mo homeostasis. MorP is a periplasmic homomultidimer (16-18 subunit) of high molecular mass (260 13kDa). The authors suggested that each homodimer sharing a Mo-2S-[2Fe-2S]-2S-Mo cluster and therefore MorP can carry up to 16 Mo atoms per protein. The genomic analysis revealed a putative
Figure I. 5.Model for transcriptional activation of morP gene under control of a 54 two component system.
The two component signaling proteins are among the most prevalent bacterial genes and are easily identified by sequence homology. Bacterial genomes analysis revealed that the total number of two component genes per genome is proportional to genome size and ecological niches preferences. Therefore, two component systems is one most abundant in genomes of gram-negative bacteria and cyanobacteria50.
I.2. Introduction of TCS
I.2.1. Sensor
The sensor, a component of TCS, is a dimeric histidine kinase (HK) protein responsible for sensing the environmental stimuli. A prototypical HK consists of three domains: a membrane associated sensor domain which recognizes the extracellular signals (Sensor), a cytoplasmic transmitter domain responsible for dimerization and histidine phosphotransfer (DHp), and a catalytic and ATP binding (CA) domain52 (figure I.6). This prototype pursues the sensor domain as an extracellular loop located between two membrane-spanning segments. The DHp and CA domain forms the transmitter domain which is more conserved among bacterial response regulators and may reflect a common mechanism of output interection53.
Figure I. 6.Prototypic form of two component system. The histidine kinase (HK) senses the environmental stimuli (input signal), autophosphorylates, then transfer the phosphoryl group to the cognate response regulator (RR). Adapted from Richard C. Stewart (2010) Curr. Pin. Microbiol, 13: 133-141
In spite of the architecture similarities between HK, the sensor domain shows specific structural variability which relies on its capacity to undergoes a variable input signal perception54. The sensor domain can deviate from the prototypical extracellular profile to membrane-embedded or intracellular type. The extracellular model has as the main representative the proteins PhoQ, DcuS and CitA which sense divalent ions such as Mg2+, C
4-dicarboxylates and citrate respectively (figure I.7 a). The triad is also called PDC sensors and is characterized by a long N-terminal α-helix region with a central five-strand
each one preserves its own functional characteristic55–57. As an example of a membrane-embedded sensor, Rhodopsin II (SRII) lacks the prototypical extracellular domain and the transmembrane segment is involved in signal perception (figure I.7b). SRII is a retinylidene protein that forms a complex with the transducer HtrII (halobacterial transducer of rhodopsin II) in order to regulated cell flagelar motor response through binding and modulating the activity of the CheA (a chemotaxis HK)58–60. In this way, CheA controls the phosphorylation status of CheY, a cytoplasmic flagellar mortor switch regulator. The combination between SRII-HtrII complex and CheY-CheA avoid photo-oxidative damage under sunlight exposure in the presence of oxygen61. Some sensor proteins can be entirely cytoplasmic, such as NtrB (figure I.7c). Others are cytoplasmic but membrane anchored: the cytoplasmic sensor domain can be found at N-terminal before the first transmembrane domain or after the second transmembrane domain (figure I.7d)52. In spite of the cytoplasmic sensor domain localization, all of them adopt a PAS fold. PAS is a family of signaling proteins that exhibit five stranded anti-parallel β-sheet core flanked by α-helices. The intracellular sensor can be exemplified by FixL that exhibit a heme-binding-PAS domain that senses O2 in Rhizobium meliloti and participates in nitrogen fixation62.
In bacteria, serine, tyrosine, threonine, histidine and aspartic acid residues are the preferable sites for phosphorylation63–65. However, the TCS pursue its own specificity for phosphorylation of the histidine residue in the sensor HK and for the acid aspartic residue in the RR. Upon activation, the HK undergoes phosphorylation of a conserved histidine residue at its DHp domain. This autokinase activity is a conserved characteristic of sensor proteins. After phosphorylation, the phosphoryl group is selectively transferred to an acid aspartic residue (D) localized in the cognate response regulator (RR). In this way, this system works in conjunction via specific protein-protein interaction between the HK and RR using three different strategies: the molecular recognition (the inborn capacity of the HK to recognize the cognate RR), the phosphatase activity (the HK dephosphorylate the cognate RR) and the substrate competition (the cognate RR competes for phosphorylated HK)66. Under the absence of an input stimulus, the HK is capable to drive in vitro dephosphorylation of its cognate RR, resetting or limiting the cross-talk67.
I.2.2. Response regulator (RR)
Once the sensor protein of the TCS is phosphorylated, the phosphoryl group is transferred to a conserved D residue, located at the receiver domain of cognate RR. The phosphorylation of the RR drives a conformational change that induces its output response. However, the N-terminal receiver domain is not an inert partner in phosphotransfer. In fact, it has enzymatic activity catalyzing the phospho transfer from phospho His of HK to its own D residue. The phosphotransfer mediated by HK is not mandatory, and small molecules containing high energy phosphoryl groups can serve as phosphodonors (e.g. acetyl phosphate, carbamoyl phosphate and phosphoramidate) in in vitro reactions. Moreover, the RR has autophosphatase activity and regulates its own dephosphorylation. The modulation of the C-terminal effector domain is so far the most important activity known of the N-terminal regulatory domain68,69
D57 in CheY, and a conserved lysine residue, corresponding to L10970. Beyond the phosphorylation coupled to signal transduction, CheY lysine acetylation have been reported
in vitro and in vivo and this post-translation modification inhibit the binding between CheY
to CheA (the HK), CheZ (phosphatase) and FliM (flagellar motor switch protein)71,72. The majority of RR (63%) binds to DNA (e.g. OmpR, NarL, AgrA and NtrC) and the output response is associated with transcriptional activation or repression. The remaining RR are diverse and can associated with several functions, such as protein/ligand binding (CheW), enzymatic activity (PleD), RNA binding (AmiR)73.
I.2.2.1.TCS RR and DNA binding
The majority of RRs contain a C-terminal tri-helical helix-turn-helix (HTH) DNA binding domain or a variation (e.g. winged turn-helix (wHTH), four-helix helix-turn-helix (4HTH), factor of inversion helix-turn-helix (Fis-HTH) and an atypical form called LytTR domain) (figure I.8)74,75,76,77.
Figure I. 8.Diversity of the C-terminal domain between the DNA binding regions of examples of response regulators. In red: the REC is the common N-terminal receiver domain. In blue: the NtrC central AAA+ ATPase domain. In green: the C-terminal DNA binding domain.
Figure I. 9.HTH motif and DNA interaction.Taken from Carl O. Pabo (1992) Annu. Rev. Biochem, 61,
1053-1095.
I.3. Prokaryotic gene expression and regulation
In order to comprehend how RR protein acts, it’s important to understand some basic concepts of gene regulation in bacteria. Gene transcription begins with the copying of a segment of DNA into RNA, and in bacteria gene expression is frequently regulated at this level. The RNA polymerase (RNAP) is the enzyme responsible for gene transcription. The
E.coli RNAP core is constituted by a complex (α2) that forms a stable complex in the presence or absence of DNA80. Bacteria contain just one form of RNAP. The structure of bacterial E.coli and Thermus aquaticus RNAP showed conserved features and both resembles as a “crab claw” where β and β subunits forms the two pincers, the α subunit
forms a dimer and the constitutes the smallest subunit that is associated primary with the
Figure I. 10 Structural organization of each subunit of bacterial core RNAP and the holoenzyme: β (magenta), β (yellow), α NTD (green/cyan), (pink) and (orange).Taken from Tamaswati Ghosh et al., (2010) FEBS Microbiol Rev, 34, 611-627.
The specificity of RNAP is determined by a small key element called sigma () which carries the major determinant for promoter recognition87. The 70 and 54 are the main subunits used by RNAP for transcription initiation. The 70 is a large family of factors phylogenetically formed by fours groups88,89. The 70 in
E.coli belongs to group 1
(the housekeeping ) and in conjunction with RNAP binds at promoter DNA sequences90. The 70 is formed by fours structural domains (1.1, 2, 3 and 4) where 1.1 controls the DNA binding and 2, 3 and 4 recognize the -10 and -35 conserved boxes82,91,92.
ATP hydrolysis to drive a DNA conformational change essential for transcription initiation93.
Transcription is divided into three steps: initiation, elongation and termination. The general aspects of transcription initiation involve the binding of the holoenzyme to a promoter sequence. This initial structure, named closed complex, is converted to an open complex in which a localized separation of the two DNA strands occurs. This exposes the bases of the coding strand, enabling the base pairing of the ribonucleoside triphosphates (NTP) for synthesis of the RNA. The first phosphodiester bound is formed and the factor dissociates from the complex. From this point forward, the core enzyme alone is required for extension of the RNA strand until reaching a termination signal when the mRNA and the RNAP are released93.
I.3.1.Housekeeping 70 and transcriptional factors
The interaction between the housekeeping RNAP70 and transcriptional factors is the base for the discernment between transcription activation and repression. Transcriptional factors can be classified as activators or repressors according to their interaction with RNAP and promoters. In the next section, some examples illustrate the main factors involved in transcriptional regulation by activators and repressors proteins.
I.3.1.1. Transcription activation
A particular activator molecule binding at a bacterial target promoter constitutes the simplest state for RNAP70 transcription initiation. This mechanism acts by stabilizing the RNAP70-promoter complex or by accelerating the open complex formation94.
misplaced, hindering the interaction with the subunit. The MerR transcriptional regulator causes a twist in the spacer producing a conformation change that allows transcription initiation by RNAP70 (figure I.11)98–100.
Figure I. 11.Mechanism of RNAP complex stability mediated by an activator protein.Adapted from David J. Lee (2012) Annu. Rev. Microbiol, 66: 125-152
Figure I. 12. Mechanism of RNAP open complex formation mediated by an activator protein. Adapted from David J. Lee (2012) Annu. Rev. Microbiol, 66: 125-152
I.3.2.The 54 regulation
The 54 recognize promoter sequences usually located at position -24 and -12 relative to the transcriptional +1 start site. The main characteristic of RNAP54 is the inability to open the double strand DNA to form the open complex required for transcription initiation given that they depend on activator proteins, ATPases, members of the AAA+ family. The ATP hydrolysis provide the energy needed to RNAP54 holoenzyme to isomerize from closed to open promoter complex.107
I.3.2.1. NtrC
The studies about NtrC (nitrogen regulatory protein C) provide a good source of information about how RNAP54 interacts with transcription factors. The well characterized promoter glnA of enteric bacteria is recognized by RNAP54 holoenzyme. The glnA gene encodes a Glutamine Synthetase (Glns) and the transcription from glnA promoter occurs by the activated NtrC in response to nitrogen starvation108. The NtrC from
E. coli is one example of a transcriptional mechano-activator protein that interacts with
Figure I. 13.Mechanism of RNAP54 transcriptional activation mediated by NtrC protein.
The bacterial TCS developed many strategies to maintain the abundance of proteins. RR have the ability to function as activators and/or repressors, and have the capacity to control their own transcriptional level. The self-control of transcription is well characterized among RR that participate in TCS circuit115,116.
As stated above, the NtrC controls the glnA promoter in response to low levels of nitrogen in bacteria. The glnA codifies the Glutamine synthetase (GlnS) which is important during bacteria growth because it is capable to converting glutamate to glutamine in medium containing low concentration of ammonia117,118. The ntrB/ntrC constitutes the TCS circuit for nitrogen assimilation in bacteria119,120. Those genes are organized as operon as shown in figure I.14. The operon is formed by glnA, ntrB and ntrC loci and contains three promoters: glnAp1, glnAp2 and glnLP. The last is responsible for the unique autoregulation of TCS by NtrC. NtrC shows an ability to control the expression of the operon by interaction with RNAP70 and RNAP54. This interaction is not randomly organized and occurs according to nitrogen environmental oscillation. The glnAp1 and
Figure I.14. ntrC/ntrB TCS regulating glnA transcription for nitrogen fixation in bacteria.
I.3.2.2. CpxRA
The CpxRA in E.coli constitute a typical TCS that display a variety of physiological roles (pilus biogenesis124,125, induction of expression of heat shock protein 126,127, iron transport128, virulence129 and biofilm formation130). Screening tests for identification of CpxR (the RR) action indicate that this protein regulates diverse physiological activities in bacteria, such as motility, pathogenesis, envelope protein folding and copper stress response131,132.However, the bacterial envelope stress response is the main function attributed to CpxRA133,134. The cpxRA operon is formed by cpxA and cpxR, consisting of a sensor histidine kinase (CpxA) and a cytoplasmic response regulator (CpxR). The CpxA autophosphorylate in response to envelope stress and transfer the phosphoryl group to CpxR135. Adjacent to cpxRA operon, the cpxP gene is divergently transcribed and is controlled by the activated (phosphorylated) form of CpxR136.This activated CpxR binds to the intergenic region between cpxP and cpxA (consensus sequence 5GTAAN(6-7)GTAA) and, in conjunction with RpoS (a 38), controls its own promoter transcriptional level 137. Moreover, the genetic circuit adopted by
repression is mediated by the CpxA sensor domain which is inhibited by CpxP in the absence of stress conditions138,139. CpxP is a periplasmic protein formed by 147 amino acids residues. The CpxP is involved in a variety of cell stress response, such as spheroplast formation, and might be involved in monitoring the periplasmic protein folding, acting as a chaperone140–142. Recently, the crystal structure of CpxP was solved and the protein presents as a positively charged α-helical dimer. CpxP contain a conserved LTXXQ motif which may be important for the protein function given that mutations at this site can cause structure perturbation and disrupt the Cpx inhibitory pathway143. A general mechanism of Cpx pathway is presented in figure I.15.
Figure I.15. Mechanism of cpx regulation during envelope stress response.
I.3.2.3. ZraSR
positioned upstream of hydL gene144. The genes zraSR and zraP are divergently transcribed (figure I.16). The ZraR is the transcriptional regulator that binds to the intergenic region between zraS and zraP. Their gene expression requires the presence of 54 in vivo and two possible 54 binding sites were identified for zraSR and zraP promoters regions. In the absence of metal, a basal level of transcription was verified for zraS gene suggesting the presence of a constitutive 70 promoter145. The zraSR TCS is not well comprehended but have been associated with Salmonella infection and its intrinsic Zn2+/ Pb2+ tolerance have been used to design cell based biosensors sensible to these metals146,147. The ZraP, also known as YJAI, is a predicted monomer with a molecular mass of 13.5kDa with affinity to zinc, cobalt and cadmium. However, ZraP exhibit more affinity to Zn2+and its transcriptional level is highly activated in the presence of this metal, characterizing ZraP as an essential protein involved in the bacterial zinc tolerance148,149.ZraP is a periplasmic protein that forms higher-order structure (15 ZraP monomers) in the presence of ZnCl2 and acts as a chaperone that suppresses the thermal aggregation of proteins in the presence of zinc. Moreover, ZraP is a member of bacterial Cpx family and acts as a repressor of ZraSR activity150.
Figure I.16. zraP and zraRS genes involved in Zn2+ and Pb2+tolerance in bacteria.
The ZraR follows the same domain architecture of NtrC: a REC, a central and a DNA binding domain. Until now, the full length structure of ZraR wasn’t solved. Nevertheless, the structure of the central and CTD was determinate by crystallography. The central domain of ZraR presented as a hexameric ring typical of AAA+ proteins and the DNA binding domain presented as
a dimer (figure I.17). The hexameric structure was observed in the presence of different nucleotides implying that nucleotides play an important role for ZraR oligomerization. The GAFTGA motif was observed at the tip of the L1 loop, near to the hexameric pore and biochemical evidences showed that mutations at this motif usually abolish the interaction between the transcriptional factors and