SANDRINA B. MOREIRA, NÁDIA SIMÕES & NUNO CRESPO
ABSTRACT:Measuring and quantifying development makes increasing use of composite indicators. This raises the issue of the determination of the proper weighting of the various dimensions considered. Using a public-opinion survey conducted in Portugal, we evaluate the importance of the main dimensions of development and examine if the dimensional weights depend on the respondents’ individual characteristics such as gender, age, or edu-cational level. The evidence suggests that both education and health regularly stand out as the most highly-rated factors.
Key words: Composite Indicators, Development, Dimensional Weights
TÍTULO: Indicadores compósitos do desenvolvimento: A importância dos ponderadores
RESUMO:A medição do desenvolvimento tem recorrido crescentemente à utilização de indicadores compósitos. Nesse âmbito, uma questão fundamental é a definição dos pon-deradores para as diferentes dimensões do desenvolvimento. Com base num inquérito à opinião pública realizado em Portugal, testamos quais as dimensões consideradas mais relevantes no desenvolvimento de um país e avaliamos em que medida os ponderadores dimensionais dependem de características individuais dos inquiridos, como sexo, idade
SANDRINA BERTHAULT MOREIRA (corresponding author) sandrina.moreira@esce.ips.pt
PhD in Economics (ISCTE-IUL – University Institute of Lisbon). Professor at Instituto Politécnico de Setúbal, Department of Economics and Management. Researcher at BRU-IUL (Business Research Unit – ISCTE-IUL – University Institute of Lisbon).
Doutorada em Economia (ISCTE-IUL – Instituto Universitário de Lisboa). Docente na ESCE-IPS – Instituto Politécnico de Setúbal, Departamento de Economia e Gestão. Investigadora na BRU-IUL (Business Research Unit – ISCTE-IUL – Instituto Universitário de Lisboa).
NÁDIA SIMÕES
nadia.simoes@iscte.pt
PhD in Economics (ISEG-UTL). Professor at ISCTE-IUL – University Institute of Lisbon, ISCTE Business School, Economics Department. Researcher at BRU-IUL (Business Research Unit – ISCTE--IUL – University Institute of Lisbon).
Doutorada em Economia (ISEG-UTL). Docente no ISCTE-IUL – Instituto Universitário de Lisboa, ISCTE Business School, Departamento de Economia. Investigadora na BRU-IUL (Business Research Unit – ISCTE-IUL – Instituto Universitário de Lisboa).
NUNO CRESPO
nuno.crespo@iscte.pt
PhD in Economics (ISEG-UTL). Professor at ISCTE-IUL – University Institute of Lisbon, ISCTE Business School, Economics Department. Researcher at BRU-IUL (Business Research Unit – ISCTE--IUL – University Institute of Lisbon).
Doutorado em Economia (ISEG-UTL). Docente no ISCTE-IUL – Instituto Universitário de Lisboa, ISCTE Business School, Departamento de Economia. Investigador na BRU-IUL (Business Research Unit – ISCTE-IUL – Instituto Universitário de Lisboa).
Composite indicators of development
INTRODUCTION
Measuring countries’ levels of development is one of the most complex tasks in eco-nomics. The recognized multidimensionality of the phenomenon has increasingly led to the use of composite indicators in order to overcome the limitations usually iden-tified in such measures as the income per capita (Bandura, 2008; Saisana, 2008). Using indicators such as this to assess development raises two crucial issues. On the one hand, one needs to identify the dimensions of development for each indicator as well as the content of each dimension. On the other hand, it is also necessary to assign weights to each dimension in order to have an aggregated indicator.
This second issue has drawn little attention in the literature, and usually equal weights are attributed to all the dimensions of a given indicator. In the absence of any systematic analysis of their correspondence to the public perception regarding the importance of each dimension of development, these weights are arbitrarily fixed. This is so despite the fact that individuals are the ultimate beneficiaries of countries’ development. The present paper seeks to close this gap in the literature by explicitly discussing the importance of the weights of each dimension of development.
More specifically, our aim is to answer three research questions based on responses to a survey conducted in Portugal. First, do the results of the survey sustain the pre-dominant adoption in the literature of equal weights for several issues affecting a country’s development? Second, does the importance of the different dimensions of development vary according to respondents’ individual characteristics, such as gen-der, age, or educational level? Third, does any relationship emerge between the dif-ferent dimensional weights?
The paper is structured in six sections. The second section discusses the progressive enlargement of the concept of development as well as the importance of its composite measurement approach. The third section proposes a development nomenclature and discusses the issue of the weights by evaluating the importance that Portuguese public opinion attributes to each dimension. The fourth section compares the results
ou nível educacional. A evidência obtida aponta, sistematicamente, a educação e a saúde como as dimensões mais valorizadas.
Palavras-chave: Indicadores Compósitos, Desenvolvimento, Ponderadores Dimensionais
identified in the third section with what has been most frequently adopted in a broad set of available composite indicators. The fifth section evaluates the relevance of some conditioning factors to the weights obtained in the third section. The sixth section investigates the relationships between the different dimensions of development. Finally, the seventh section presents some final remarks.
THE RELEVANCE OF THE COMPOSITE MEASUREMENT OF DEVELOPMENT
Development is undoubtedly one of the most discussed concepts in economics. For many years, and especially since the end of the Second World War, development of countries has been evaluated almost exclusively in terms of their level of economic growth. Economic growth has been seen as a necessary and sufficient condition for development and, therefore, improvement in the well-being of the population has been viewed as relying on it. Regarding the quantitative assessment of a country’s level of development, the more immediate implication of this strict link between the two concepts is the heavy reliance on indicators of economic activity, notably the level of income per capita.
However, since the 1970s a decisive turning point in the practices and approaches to development has led to the emergence of new and broader concepts of develop-ment. These new concepts are couched mainly in an interdisciplinary and multidi-mensional perspective, spawning the current concepts of sustainable, local, partici-pative, human, and social development.
In the same vein, several attempts have been advanced to amend, complement, or replace the income per capita as a summary measure of development, and in turn, the approach to measuring development has progressively evolved from a uni- to a multi-dimensional character. Composite indicators of development have gained great importance as a result, and many have appeared in recent years, allowing for a more textured assessment of the phenomenon of development (Booysen, 2002; Bandura, 2008; Saisana, 2008; Soares and Quintella, 2008).
Composite indicators are mathematical combinations of a set of indicators. Their extensive use has led to a spirited debate over the conceptual and methodological arguments in favor of and against this measurement approach. In a detailed analysis of the relevance of these types of indicators, Booysen (2002) stresses some of their most important limitations: (i) composite indicators always exclude one or more essential elements of the domain at issue; (ii) particular components of the index may be quantified with the aid of different variables (possibly better ones); (iii) composite
indicators may be unable to reveal more than what a single variable alone reveals; (iv) the selection process of the variables may be ad hoc, which is to say, politically or ideologically motivated, or simply determined by the availability and accuracy of data; (v) the data employed in composite indicators are often inaccurate and non--comparable; (vi) often no clear rationale is presented for the selected weighting and aggregation techniques; (vii) composite indicators may lack practical value if they give no specific and focused policy advice.
However, there are also many elements in favor of composite indicators, notably the following (Saisana and Tarantola, 2002): (i) composite indicators synthesize complex or multidimensional issues; (ii) they are easier to interpret than a battery of separate indicators; (iii) they facilitate the task of comparing the performance across countries and their progress over time, and thereby attract public interest; (iv) they reduce the size of a list of indicators without losing basic information. Indeed, the main advantage of composite indicators is their multidimensionality, since they represent aggregate and relatively simple measures of a combination of components of complex phenomena (Booysen, 2002).
Currently, a considerable variety of composite indicators have been proposed to
quantitatively assess the performance of countries in terms of development1. These
development indicators are employed with the aim of measuring the main con-stituents of the phenomenon, thereby reflecting its multidimensional nature. The lit-erature offers many proposals of disaggregation of the phenomenon into its main dimensions2.
THE IMPORTANCE OF DIMENSIONAL WEIGHTS – FINDINGS FROM PORTUGAL
Based on the criteria of intrinsic relevance and recurring inclusion in alternative attempts of development disaggregation, we propose a nomenclature that disaggre-gates development into eight dimensions encompassing crucial features that deter-mine the level of countries’ development: (i) income; (ii) income distribution (inequality and poverty); (iii) education; (iv) health; (v) employment (in quantitative as well as qualitative terms); (vi) infrastructure; (vii) values (economic freedom, socio--political liberty, including the political regime, corruption, and respect for human rights); (viii) environment.
We conducted a small survey in order to measure the importance of each of the above dimensions. The questionnaire contained a brief description of the key ele-ments of each dimension, and individuals were asked to indicate their opinion of the
relative importance of each dimension to the development of a given country. Additionally, certain characteristics of the respondents were collected (gender, age, and level of education). The survey was conducted between April and July 2010 and included a total sample of 2892 observations.
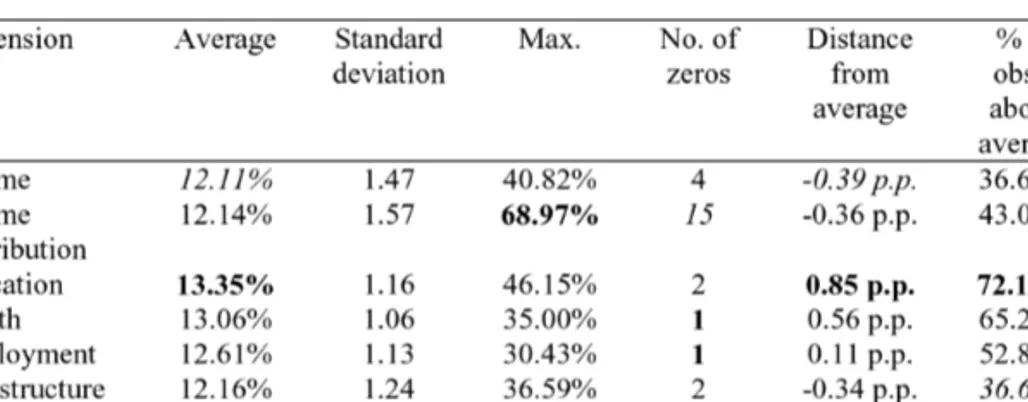
Table I presents the overall findings, highlighting for each dimension the average, the standard deviation, the maximum value, the number of responses with zero weight to that dimension, the distance from the average (which is 12.5%), and the number of observations above the average. We have designated the best situation in
bold and the worst situation in italics3.
TABLE I
Dimensional weights – overall results
As Table I reveals, there is not a very great difference between the weights assigned to the different dimensions, thereby supporting the option frequently adopted in the literature of applying equal dimensional weights to all included dimensions. However, a more in-depth analysis of the survey’s findings points to some additional points of interest. We emphasize three of them.
First of all, two dimensions – education and health – are identified as being more relevant than the others. If we use the number of responses above the average (12.5%) as the analysis criterion, this finding is very clear. Indeed, with regard to education, 72.10% of the respondents assigned a weight above the average. The value for the health dimension is 65.21%, and employment is the other dimension to which more than half of the respondents attributed an importance greater than the average (52.84%). On the other hand, only 36.62% of the respondents evaluated infrastructure as greater than the average.
Second, the results for income distribution (inequality and poverty) should also be noted. This dimension presents the greatest disparity of responses as evidenced by the largest standard deviation, the largest number of responses that assigned a zero weight to that dimension, and finally, by including the response that attributed the greatest weight to any dimension (68.97%).
Third, somewhat surprisingly the income dimension has a low weight, which seems to support the notion that evaluating development focused exclusively on that dimension is clearly reductive and does not correspond to public opinion’s percep-tion of the fundamental components of the process of development.
THE DIMENSIONAL WEIGHTS IN THE MEASUREMENT OF DEVELOPMENT
Let us now compare the findings above to those reported in the literature. The first of the three research questions posed in the Introduction can be further subdivided into two parts:
• Do the most valued dimensions (revealed in our survey) correspond to those most frequently included in composite indicators of development?
• Do the weights found correspond to those applied in the main composite indica-tors of development (as reported in the literature)?
This section seeks to answer these two questions. To achieve this, we follow a four--step procedure. First, we identify surveys and other recent studies that include a list of composite indicators of development. Second, we establish a selection criterion for the indicators included in those studies. In particular, we consider the indicators that simultaneously include at least two of the different proposed dimensions and are
mentioned in at least two of the selected studies4. Third, the selected indicators are
analyzed in order to identify the dimensions included in each indicator. Fourth, we evaluate the weights adopted in each case.
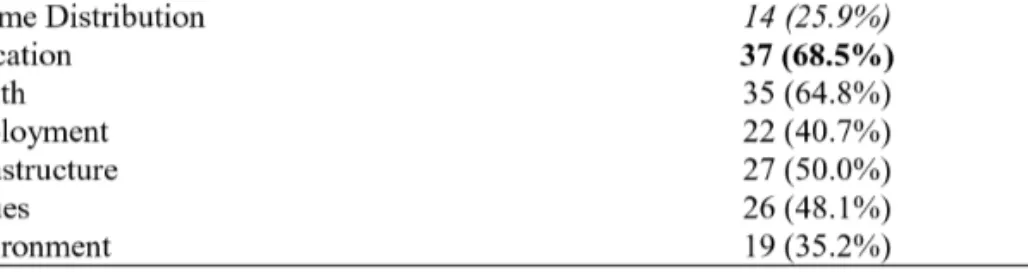
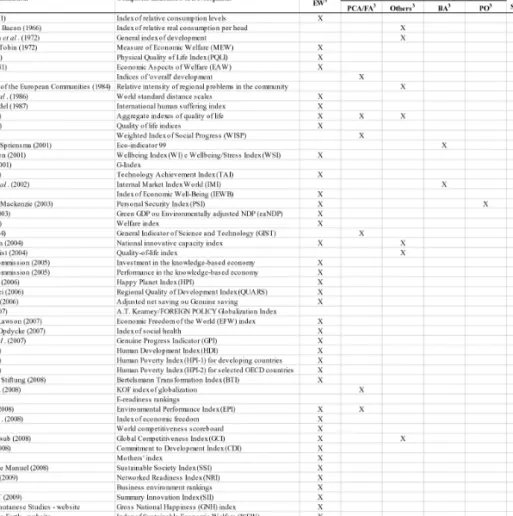
The studies selected for the first step are the following: (i) Booysen (2002); (ii) Morse (2004); (iii) Gadrey and Jany-Catrice (2007); (iv) Goossens et al. (2007); (v) Afsa et al. (2008); (vi) Bandura (2008); (vii) Eurostat (2008); (viii) Saisana (2008); (ix) Soares and Quintella (2008); (x) Singh et al. (2009). Applying the selection cri-terion presented in the second step led to the choice of 54 composite indicators of development. In the third step we identified the dimensions of development included in each of the 54 indices selected, in order to address the first question presented above. Table II summarizes the results of this procedure.
As Table II reveals, the two dimensions most often included in composite indica-tors of development are also those that seem most valuable in the public opinion according to the findings of our survey – education and health. The greatest discrep-ancies between the findings of the survey and the inclusion of dimensions in indices of development are seen in the infrastructure and income dimensions. Both are deemed to be less valuable in the public opinion than the frequency with which they are considered in the 54 indices of development would lead one to believe. The oppo-site is observed with the employment and environment dimensions, which our survey finds to be more valuable in the public opinion.
We turn now to the second part of the question. Upon analyzing the weighting methods employed in the 54 composite indicators of development, four alternative methodologies stand out.
The first option (EW) is to employ equal weighting (i.e., not to use differentiated weights at all). In this option, the composite indicator is determined by the simple average of the corresponding indicators, which might, in turn, be simple or composite in nature.
Where dimensional weights are employed in a differentiated manner, the literature offers a variety of weighting methods, usually segregated into two broad categories – statistical methods (option two) and participatory methods (option three) (OECD and European Commission, 2008). In option two, statistical techniques of multi-variate analysis, such as the principal component analysis or the factor analysis, are of particular interest. Both methods group individual indicators according to their degree of correlation. Option three (participatory methods) are based on expert or public opinion, and methodologies known as budget allocation (BA) or public opinion (PO) are well-known examples.
TABLE II
Number and percentage of composite indicators taking into account each dimension of development
The fourth option is to employ unequal weightings based on an ad-hoc/subjective process that is based on authors’ (experts’) opinion and/or intuitive appeal.
Table III (see p. 87) summarizes the methodology used in each of the 54 composite indicators of development considered in the present section.
As can been seen in Table III, the weighting method that is based on public opin-ion is rarely used – being present in only one of the 54 indices. The simplest method
– EW – is the one most favored and was used in 40 of the 545. Note that the
com-mon procedure reported in the literature is not necessarily the option of no weight-ing, but rather that weights are implicitly equal.
In the most popular indicator for measuring development in a composite nature – the Human Development Index (HDI) – a weighting of 1/3 is attributed to each of its constituents – income, education and health. This stands in contrast to the find-ings of our survey, in which public opinion seems to place greater value on education and health, while de-emphasizing income.
CONDITIONING FACTORS OF THE WEIGHTS
The third section presented the overall findings of the survey conducted on dimensional weighting. The purpose of the present section is to evaluate whether or not these weights differ according to selected characteristics of the respondents: gen-der, age, and educational level. We start by comparing the dimensional weights assigned by men (1403 observations) and women (1480 observations). Table IV pre-sents the results6.
The evidence in Table IV confirms the importance given to education and also health by both women and men. 75.91% of men and 68.38% of women assigned a greater weight to education than the average. In comparative terms, we should high-light in particular the greater valuation that men attributed to both education and values (compared to women) and that women attributed to both employment and income distribution (compared to men), while the remaining dimensions show very similar values. The results also reveal the lower importance that women give to income, and that men give to income distribution as components of a country’s development.
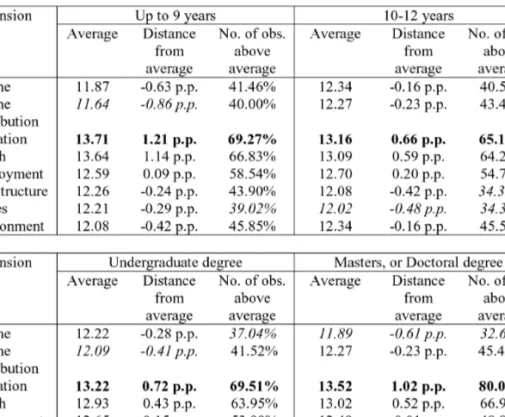
We now examine the division of the sample according to age, considering four age groups: (i) up to and including 25 years of age; (ii) 26 to 39; (iii) 40 to 54; (iv) 55
TABLE III
Methodology of composite indicators of development
As seen in Table V, education is always regarded as the most important component in the process of a country’s development by all age groups, even though the impor-tance attributed increases with the age of the respondent. The relative weights of both values and infrastructure go in the same direction. Inversely, the greater the age, the lower the weight that is attributed to income. If we compute the correlation coeffi-cient between the age of the respondents and the weights they assigned to each
TABLE IV
Dimensional weights by gender
TABLE V
dimension of development, we obtain a negative association for income, income dis-tribution, and employment. The relative importance of these dimensions is thus greater for the younger population. A positive correlation is present for the remain-ing dimensions.
Finally, we disaggregate the sample according to the schooling level. For this we consider four categories: (i) up to and including 9 years of education; (ii) 10 to 12 years; (iii) with an undergraduate degree; (iv) with a post-graduate degree, i.e.,
Masters, or Doctoral Degree. The data are presented in Table VI8.
TABLE VI
Dimensional weights by educational level
Table VI reveals some interesting results. Respondents with intermediate levels of schooling (the categories of “10 to 12 years of schooling” and “with an undergraduate degree”) attributed greater importance to income. The same is found for both employment and environment, even though the difference between these two groups of schooling level and the remaining two is now less significant. As expected,
the highest educational level group gave a very large weight to education, with 80.04% of the respondents in this group assigning a relative weight greater than
the average9. There is also a strong depreciation of the income dimension in this
group.
IS THERE A RELATIONSHIP BETWEEN WEIGHTS?
In the sections above we analyzed how the respondents evaluated each of the dif-ferent dimensions of development. In this section we investigate what type of rela-tionship exists between the several dimensional weights. For instance, considering the findings of our survey, does a higher valuation for infrastructure correspond to a lower valuation for environment, or does a higher valuation of health correspond to a lower valuation of income?
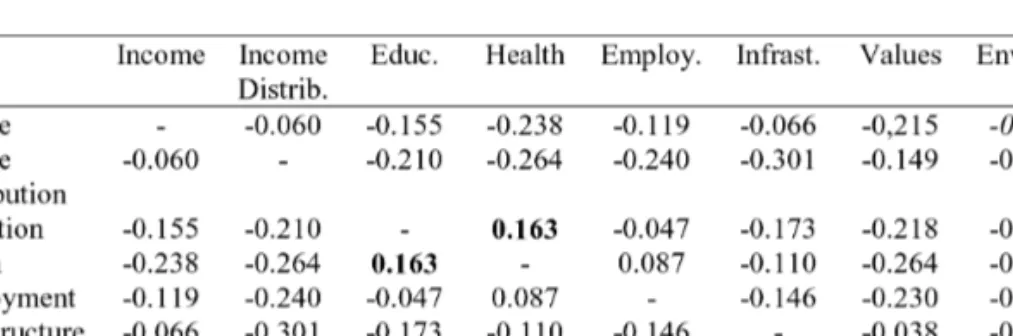
TABLE VII
Correlation coefficients between dimensional weights
Table VII refers to the weights assigned by individuals to each dimension. Therefore, a negative correlation coefficient is expected in the majority of the bilate-ral comparisons. The evidence supports this in 25 out of the 28 possible relation-ships. Two of the three exceptions correspond to the relationship among key social dimensions of development – education, health, and employment – and the most significant association is between education and health (0.163). The other bilateral relationship with a positive association of attributed weights has to do with the rela-tionship between values and environment. Here we find that individuals who give greater importance to the values dimension also seem to have a greater concern for the environment. The trade-off between environment and income is clearly evi-denced by the corresponding bilateral relationship, which has the largest negative correlation coefficient.
FINAL REMARKS
Composite indicators in the assessment of countries’ development have gained increasing importance vis-à-vis the enlargement of the concept and the subsequent need for indicators to capture that multidimensional nature in the quantitative eval-uation of the domain. The crucial issues regarding composite indicators are the dimensions encompassed by each, and their respective weights. The second issue is less clarified in the literature and is thus at the center of this research.
The introduction posed three key research questions, and based upon the findings, our main conclusions can now be stated. The first question was about the corre-spondence between the public-opinion valuations of each dimension of development and the common procedure in the literature of assigning equal weight to each of these dimensions. Two major conclusions can be derived from our findings. On the one hand, respondents have assigned very similar weights to the different dimensions which seems to add legitimacy to the research option that predominates in the liter-ature. On the other hand, some key dimensions of development are repeatedly iden-tified as being more important than others – namely education and health. In con-trast, both infrastructure and income are the dimensions that are least frequently identified as being of greater importance than the other dimensions of development. In short, even though the differences are not quantitatively significant, they are con-sistent in terms of the more important dimensions, thereby reducing the value of composite indicators that do not include them. However, the analysis of the main available indices in the literature confirms that these dimensions are, indeed, those that are most frequently included in the composite measurement of development.
The second question presented in the introduction concerns the dependence of dimensional weights on some characteristics of the individuals – namely gender, age, and educational level. The evidence confirms the influence of these characteristics, although once again the impact is not great.
Finally, regarding the third research question on the possible existence of a rela-tionship between dimensional weights, the data support a belief in such a relation-ship. The greatest positive relationship is between education and health. Respondents who assign more weight to the education dimension do the same for the health dimension. Other positive correlations are found between employment and health and between environment and values. The remaining bilateral relationships have a negative correlation, which comes as no surprise considering that relative weights are at the focus. The most significant inverse relationship is between income and envi-ronment.
There is still room for further research on the issue of weighting composite indica-tors of development. We emphasize some topics that seem most promising in the area. First of all, a larger survey would allow for a more robust look at the findings reported here. Second, a comparison of our findings with those obtained in different countries would be very beneficial, especially in comparisons between developed and developing countries. Third, broadening the elements of individual characterization of the respondents would enable a more in-depth evaluation of the factors determin-ing the dimensional weights of development. Fourth, dimensional surveys question-ing the relative importance of each sub-dimension is an extremely appealquestion-ing avenue for further research. This procedure would have a double merit. First, it would enrich the corpus of information available, and second, it would allow for a more spe-cific analysis, and thus a more insightful classification by respondents. Finally, a long--term study would permit monitoring individuals’ (possibly changing) attributions on the dimensions of development throughout their lives.
ACKNOWLEDGMENTS
We acknowledge the financial support from FCT PEst-OE/EGE/UI0315/2011. The usual disclaimer applies.
NOTES
1. Even though some proposed indicators might not have the direct purpose of measuring development, they are likely to be interpreted as such.
2. See, for instance, Booysen (2002).
3. We adopt this procedure in all of the tables presented in this study.
4. The purpose of the mentioned criterion is to identify the most representative indicators and thereafter discard the least consolidated contributions in the literature.
5. The assignment of equal weights to all the dimensions might be followed by the option of unequal weighting for the possible sub-dimensions of each included dimension.
6. Nine respondents did not identify their gender and thus were excluded from the analysis. 7. 292 respondents did not identify their age.
8. Eleven respondents did not identify their educational level.
9. Following the consultation of experts is the conventional practice of selecting weights in a participatory man-ner. Given that the higher educational level group proxies experts, a closer inspection on their perception about the fundamental components of the process of development would be valuable and very welcome.
REFERENCES
AFSA, C.; BLANCHET, D.; MARCUS, V.; PIONNIER, P-A. & RIOUX, L. (2008), «Survey of Existing Approaches to Measuring Socio-Economic Progress». Study prepared for Commission on the Measurement of Economic Performance and Social Progress, INSEE/OECD.
ATK/FP (2007), «The globalization index 2007». A.T. Kearney/Foreign Policy Magazine. November/December. BANDURA, R. (2008), «A Survey of Composite Indices Measuring Country Performance: 2008 Update». Office of Development Studies, UNDP/ODS Working Paper.
BECKERMAN, W. & BACON, R. (1966), «International comparisons of income levels: a suggested new mea-sure». Economic Journal, vol. 76, pp. 519-536.
BENNETT, M. K. (1951), «International disparities in consumption levels». American Economic Review, vol. 41, pp. 632-649.
BERTELSMANN STIFTUNG (2008), «Bertelsmann Transformation Index 2008: Political Management in International Comparison». Bertelsmann Stiftung Verlag, Gütersloh.
BOOYSEN, F. (2002), «An overview and evaluation of composite indices of development». Social Indicators Research, vol. 59(2), pp. 115-151.
CAMP & SPEIDEL (1987) cited in HESS, P. (1989), «The military burden, economic growth, and the human suffering index: evidence from the LDCs». Cambridge Journal of Economics, vol. 13, pp. 497-515.
COMMISSION OF THE EUROPEAN COMMUNITIES (1984), «The Regions of Europe: Second Periodic Report on the Social and Economic Situation of the Regions of the Community, Together with a Statement of the Regional Policy Committee». OPOCE, Luxembourg.
DIENER, E. (1995), «A value based index for measuring national quality of life». Social Indicators Research, vol. 36, pp. 107-127.
DREHER, A.; GASTON, N. & MARTENS, P. (2008), Measuring Globalization – Gauging its Consequences. Springer, New York.
DUTTA, S. & MIA, I. (2009), «The Global Information Technology Report 2008-2009: Mobility in a Networked World». World Economic Forum and INSEAD, Geneva.
EIU (2008), «E-Readiness Rankings 2008: Maintaining Momentum. A White Paper From the Economist Intelligence Unit».
EIU (2009), «Country Forecast Eastern Europe March 2009». Economist Intelligence Unit, London. ESTES, R. J. (1998), «Trends in world social development, 1970-95: development prospects for a new century». In P. K. Nandi and S. M. Shahidullah (Eds.), Globalization and the Evolving World Society. Brill, Leiden, pp. 11--39.
ESTY, D.; LEVY, M.; KIM, C.; SHERBININ, A. de; SREBOTNJAK, T. & MARA, V. (2008), «2008 Environmental Performance Index». Yale Center for Environmental Law and Policy, New Haven.
EUROPEAN COMMISSION (2005), «Towards a European Research Area – Science, Technology and Innovation – Key Figures 2005». Office for Publications of the European Communities, Luxembourg.
EUROSTAT (2008), «Feasibility Study on the Measure of Wellbeing Presentation of Eurostat Work». Eurostat/Strategic Development Group, Brussels.
GADREY, J. & JANY-CATRICE, F. (2007), Les Nouveaux Indicateurs de Richesse. 2nded., Repères-La Découverte.
GINSBURG, N.; OSBORN, J. & BLANK, G. (1986), «Geographic Perspectives on the Wealth of Nations». University of Chicago, Department of Geography, Research Paper no. 220.
GOEDKOOP, M. & SPRIENSMA, R. (2001), The Eco-indicator 99: A Damage Oriented Method for Life Cycle Assessment – Methodology Report. 3rded., PRé Consultants, Amersfoort.
GOOSSENS, Y.; MAKIPAA, A.; SCHEPELMANN, P.; SAND, I. de; KUHNDT, M., & HERRNDORF, M. (2007), «Alternative Progress Indicators to Gross Domestic Product (GDP) as a Means towards Sustainable Development. Study Provided for the European Parliament’s Committee on the Environment, Public Health and Food Safety». PDESP/European Parliament.
GWARTNEY, J. & LAWSON, R. (2007), «Economic Freedom of the World: 2007 Annual Report». Fraser Institute, Vancouver, B.C.
HAGEN, H.-O. (2004), «Background Facts on Economic Statistics 2004:15 – Comparing Welfare of Nations». Department of Economic Statistics, Statistics Sweden, Stockholm.
HOLMES, K. R.; FEULNER, E. J. & GRADY, M. A. O’ (2008), «2008 Index of Economic Freedom». The Heritage Foundation and Dow Jones & Company, Inc, Washington D.C. and New York.
IMD (2008), «IMD World Competitiveness Yearbook 2008». International Institute for Management Development, Lausanne.
MARKS, N.; ABDALLAH, S.; SIMMS, A. & THOMPSON, S. (2006), «The (Un)Happy Planet Index: An Index of Human Well-Being and Environmental Impact». New Economics Foundation, London.
MCGRANAHAN, D. V.; RICHARD-PROUST, C.; SOVANI, N. V. & SUBRAMANIAN, M. (1972), «Contents and Measurement of Socioeconomic Development. A Staff Study of the United Nations Research Institute
for Social Development (UNRISD)». Praeger, New York.
MIRINGOFF, M.-L. & OPDYCKE, S. (2007), «America’s Social Health: Putting Social Issues Back on the Public Agenda». M.E. Sharpe, Armonk, N.Y.
MORRIS, M. D. (1979), «Measuring the Condition of the World’s Poor: the Physical Quality of Life Index». Pergamon Policy Studies no. 42, Pergamon Press, New York.
MORSE, S. (2004), «Indices and indicators in Development». Earthscan Publications Ltd, London, Stirling VA. NISTEP (2004), «Science and Technology Indicators: 2004 – A Systematic Analysis of Science and Technology Activities in Japan». Report no. 73, National Institute of Science and Technology Policy, Japan.
NORDHAUS, W. & TOBIN, J. (1972), «Is Growth Obsolete?». National Bureau of Economic Research, General Series no. 96, New York.
OECD & EUROPEAN COMMISSION (2008), «Handbook on Constructing Composite Indicators: Methodology and User Guide». OECD (the Statistics Directorate and the Directorate for Science, Technology and Industry) and European Commission (the Econometrics and Applied Statistics Unit of the Joint Research Centre), Paris and Ispra.
PORTER, M. E. & SCHWAB, K. (2008), The Global Competitiveness Report 2008-2009. World Economic Forum, Geneva.
PORTER, M. E. & STERN, S. (2004), «Ranking national innovative capacity: findings from the national inno-vative capacity index». In X. Sala-i-Martin (Ed.), The Global Competitiveness Report 2003-2004, Oxford University Press, New York, pp. 91-116.
PRESCOTT-ALLEN, R. (2001), The Wellbeing of Nations: A Country-by-Country Index of Quality of Life and the Environment. Island Press, Washington.
RAM, R. (1982), «Composite indices of physical quality of life, basic needs fulfilment, and income: a principal component representation». Journal of Development Economics, vol. 11, pp. 227-47.
RANDOLPH, J. (2001), «G-Index: Globalisation Measured. Global Insight».World Markets Research Center. ROODMAN, D. (2008), «The Commitment to Development Index: 2008 Edition». Center for Global Development, Washington.
SAISANA, M. (2008), «List of composite indicators». http://composite-indicators.jrc.ec.europa.eu/.
SAISANA, M. & TARANTOLA, S. (2002), State-of-the-art Report on Current Methodologies and Practices for Composite Indicator Development. Joint Research Centre, European Comission.
SBILANCIAMOCI (2006), The QUARS: Assessing the Quality of Development in Italian Regions. Lunaria, Roma.
SINGH, R. K.; MURTY, H. R.; GUPTA, S. K. & DIKSHIT, A. K. (2009), «An overview of sustainability assess-ment methodologies». Ecological Indicators, vol. 9, pp. 189-212.
SLOTTJE, D. J. (1991), «Measuring the quality of life across countries». Review of Economics and Statistics, vol. 73, pp. 684-93.
SMITH, J. (2003), «Guide to the Construction and Methodology of the Index of Economic Well-Being». Centre for the Study of Living Standards, Ottawa.
SOARES, J. & QUINTELLA, R. H. (2008), «Development: an analysis of concepts, measurement and indica-tors». Brazilian Administration Review, vol. 5(2), pp. 104-24.
SOCIAL INDICATORS DEPARTMENT [s.d.], «Calculation of Composite Index of Individual Living Conditions». Social Indicators Department, Centre for Survey Research and Methodology (ZUMA), Leibniz Institute for the Social Sciences (GESIS), Mannheim.
STC (2008), «State of the World’s Mothers 2008: Closing the Survival Gap for Children Under 5». Save the Children, Westport.
TALBERTH, J.; COBB, C. & SLATTERY, N. (2007), «The Genuine Progress Indicator 2006: A Tool for Sustainable Development». Redefining Progress, Oakland.
TARANTOLA, S.; SAISANA, M. & SALTELLI, A. (2002), «Internal Market Index 2002: Technical Details of the Methodology». European Commission Joint Research Centre, Italy.
THE ECONOMIST (2004), «The Economist Intelligence Unit’s Quality-of-Life Index». Economist Online, December.
TSOUKALAS, S. & MACKENZIE, A. (2003), «The Personal Security Index, 2003 – Five Years Later». Canadian Council on Social Development, Ottawa.
environmen-tal and economic accounting 2003». Studies in Methods, Series F, no. 61, Rev. 1, United Nations, European Commission, International Monetary Fund, Organisation for Economic Co-operation and Development and World Bank.
UNDP (2001), Human Development Report 2001. Oxford University Press, New York. UNDP (2007), Human Development Report 2007. Oxford University Press, New York.
UNU-MERIT (2009), «European Innovation Scoreboard 2008: Comparative Analysis of Innovation Performance». Maastricht Economic and Social Research and Training Centre on Innovation and Technology, Inno Metrics, Pro Inno Europe.
VAN de KERK, G. & MANUEL, A. (2008), «Sustainable Society Index SSI-2008». Sustainable Society Foundation, Netherlands.
ZOLOTAS, X. (1981), Economic Growth and Declining Social Welfare. New York University Press, New York. WORLD BANK (2006), «Where is the Wealth of Nations? Measuring Capital for the 21stCentury». The World Bank, Washington D.C.