RADIATION SCIENCES
07-02B (2019) 01-15
ISSN: 2319-0612 Aceppted: 2019-02-19
BJRS
Removal of cobalt from lubricant oil by the use of
bentonite: equilibrium, kinetic and adsorption
preliminary studies
Valeria Cuccia¹, Sandro Rogério Novaes Seles¹, Ana Claudia Queiroz Ladeira¹
¹Centro de Desenvolvimento da Tecnologia Nuclear – CDTN
[email protected], [email protected], [email protected]
ABSTRACT
Radionuclides may contaminate lubricant oils in nuclear power plants. In Brazil, this kind of waste has been stored in the generator’s facilities, awaiting treatment alternatives. This work intends to investigate a process to treat it for final deposition, using bentonite as sorbent material. This process will result in decontaminated oil, free from radiological control, and radioactive loaded sorbent, with considerable volume reduction of the radioactive waste. The study focuses in cobalt removal from a simulated oil waste (non-active). The production of the simulated waste is described. Benton-ite was used for equilibrium time determination, kinetic and adsorption studies. Cobalt adsorption equilibrium was rap-idly attained after 30 minutes. The data was used for modelling the system’s kinetic, applying the pseudo first and pseu-do second order equation models. Experimental data fitted to pseupseu-do second order model, supporting the assumption that the adsorption is due to chemisorption. Batch sorption tests were conducted and the results fitted to Langmuir and Freundlich sorption models. Both isotherm models chosen for this work did not fit to the experimental data. Thus, these are preliminary results and the studies must be repeated to evaluate data variability and better statistical inference. Other isotherm models must be evaluated to choose the best fitted one and describe the sorption of cobalt on bentonite in oil matrix. Even though, bentonite has considerable potential as sorbent for the removal of cobalt from lubricant oil. Final-ly, the results might be extended to other kinds of radioactive oils and radioactive organic wastes.
1. INTRODUCTION
Nuclear applications in a wide range of areas, such as medicine, research activities, industries and power production generate radioactive waste. The proper management of this waste is necessary to avoid possible negative impacts to human health and the environment.
The biggest radioactive waste generators are the nuclear power plants. Their operational activities generate many types of radioactive waste, among them, contaminated lubricant oil. Lubricating oils are used in many areas of a nuclear power plant. They can be easily contaminated: the oil mixes with water and other contaminants from the nuclear reactor system and becomes contaminated with radioactive wastes, as well as dirt and moisture [1].
Organic materials (including lubricant oils) decompose in storage and disposal and do not lend themselves to conventional cementitious stabilization methods. Decomposition changes the chemi-cal make-up of the waste, potentially degrading the stabilization material and enhancing the mobili-ty of radionuclides and hazardous materials. Even management of low-level organic waste forms (like contaminated oils) is problematic. In this sense, the development of new waste conditioning techniques poses a challenge across many waste forms [2].
This kind of waste must be treated for final disposal. The most common technique used worldwide is incineration [3], as in France [4], UK [5] and Lithuania [6]. Nevertheless, Brazil does not have incinerators for radioactive waste and there is no plan to implement one in the country, due to its high costs and low public acceptance.
Wet oxidation, pyrolysis and vitrification processes have been in use since the 1990s in the nuclear industry primarily, to volume-reduce and destroy organic wastes such as resins, oils and sludges that contain organic constituents or chelating agents [7]. These technologies are being widely tested and deployed at facility decommissionings in the United States and Europe. Other technologies,
such as the sorption and electrochemical destruction of oils and oily wastewaters, hold promise for processing contaminated organic wastes [2].
The selection of an appropriate decontamination technique for waste oil depends on the physical and chemical form of the radioactivity that is present. It is likely that radionuclides are present in one or more of the following three forms: associated with particulate matter as adsorbed ions or me-tallic corrosion products; dissolved in the aqueous phase of the oil/water emulsion as oxides, hy-drated ions, or water soluble organics; or dissolved in the organic phase of the emulsion as organo-metallic complexes or other oil soluble forms [8].
Some researchers conducted researches on physicochemical treatment to remove radionuclides from oil [1] [8] [9] [10] [11]. Although they are not recent studies, in this work the sorption technique was chosen for its low cost and operational simplicity, desirable characteristics especially for a small inventory in each generator, like the Brazilian situation. Also, the use of sorption on bentonite to decontaminate lubricant oils is a common practice for the non-radioactive ones [12] [13] [14].
Conventional physical processes can be effective in removing a large fraction of the total amount of radioactivity from waste oils, especially the filtration of particulate by and centrifugation to remove the aqueous phase associated. However, small amounts of radioactivity often remain and it is usual-ly due to the presence of small amounts of 60Co [10]. Thus, 60Co would be the radionuclide more difficult to remove from the oil, especially if it is in organic soluble form.
These considerations lead to the study of oil decontamination using bentonite as sorbent for cobalt. In order to avoid unjustified exposures to radiation and radwaste generation, the studies have been conducted in a simulated waste: non-active lubricant oil with organometallic cobalt incorporation.
There is extensive literature related to metal sorption on bentonite for aqueous systems, but it was not found any publication concerning adsorption and kinetic studies for cobalt in oil or organic ma-trix, reinforcing the relevance of this work. The aim of the present study is to remove cobalt from lubricant oil using a low cost adsorbent bentonite. In the batch mode studies, the dynamic behavior
of the adsorption was investigated at room temperature. The adsorption kinetics and Langmuir and Freundlich adsorption isotherms were also studied.
2. THEORICAL ASPECTS OF KINETIC AND ADSORPTION MODELS
2.1. Kinetic Models
The study of sorption kinetics is significant as it provides valuable insights into the reaction path-ways and into the mechanism of sorption reactions. In addition, it is important to be able to predict the rate at which pollutant is removed from solutions in order to design appropriate sorption treat-ment plants [15].
In order to investigate the mechanism of sorption, two kinetic models have been widely used in the literature for sorption processes: pseudo-first-order and pseudo-second-order [16]–[20]. In this study, these models were investigated to find the best-fitted model for the experimental data ob-tained.
2.1.1. Pseudo-first-order kinetic model
This model of Lagergren assumes that the rate of change of solute uptake with time is directly pro-portional to difference in saturation concentration and the amount of solid uptake with time. The equation can be rearranged to obtain a linear form showed in equation 1, where qe (mg.g-1) is the
amount of sorption at equilibrium and q at time t, and k1 is the is the pseudo-first-order rate constant
for the adsorption process (min−1) [15]–[17], [21].
equation 1
The plot of log(qe−q) versus t gives a straight line for first-order kinetics, which allows computation
of the adsorption rate constant, k1. When adsorption is preceded by diffusion through a boundary,
not follow this equation, the sorption is not diffusion-controlled and k1 does not represent the
num-ber of available sites and [16].
2.1.2. Pseudo-second-order kinetic model
The sorption kinetics may be described by a pseudo-second-order model. The rearranged equation to the linear form is showed in equation 2, where the rate parameters k2 and qe can be directly
ob-tained from the intercept and slope of the plot of t/q versus t; qe (mg.g-1) is the amount of sorption at
equilibrium and q at time t [15], [22].
equation 2
The pseudo-second-order rate expression has been used to describe chemisorption involving valen-cy forces through the sharing or exchange of electrons between the adsorbent and adsorbate as co-valent forces, and ion exchange. In recent years, the pseudo-second-order rate expression has been widely applied to the adsorption of pollutants from aqueous solutions. The advantage of using this model is that there is no need to know the equilibrium capacity from the experiments, as it can be calculated from the model. In addition, the initial adsorption rate, h, can also be obtained from the model, represented by the term k2.qe² [22].
2.2. Adsorption Models
A main source of information about adsorption and its mechanism is, besides the calorimetric measurements of adsorption heat, the adsorption isotherm [23]. The relation, at constant tempera-ture, between the amount adsorbed and the equilibrium pressure, or concentration, is known as the adsorption isotherm [24].
There are several isotherm equations available for analyzing experimental sorption equilibrium pa-rameters, the most common being the Langmuir and Freundlich models [17], [25], [26]. The con-stants in the Langmuir and Freundlich equations are useful in designing adsorption process equip-ment [27].
2.2.1. Langmuir
The Langmuir isotherm model is based on the assumption that there is a finite number of active sites which are homogeneously distributed over the surface of the adsorbent. These active sites have the same affinity for adsorption of a mono molecular layer and there is no interaction between ad-sorbed molecules [Langmuir apud 25]
A well known linear form of the Langmuir equation can be expressed as equation 3, where qe is the amount of cobalt adsorbed, Ce is the equilibrium concentration of the adsorbate and qm and KL are
Langmuir constants related to the maximum adsorption capacity and energy of adsorption. Accord-ing to equation 3, when the adsorption obeys the Langmuir equation, a plot of Ce /qe versus Ce
should be a straight line with a slope of 1/qm and intercept 1/qm.KL. [17], [25].
L m m e q q K q C . 1 Ce + = equation 3 2.2.2. Freundlich
The Freundlich isotherm model applies to adsorption on heterogeneous surfaces with interaction between the adsorbed molecules, and is not restricted to the formation of a monolayer. This model assumes that as the adsorbate concentration increases, the concentration of adsorbate on the adsor-bent surface also increases and, correspondingly, the sorption energy exponentially decreases on completion of the sorption centers of the adsorbent [25].
The well-known expression for the Freundlich model is given as equation 4, where qe is the amount adsorbed at equilibrium, Kf is the Freundlich constant, 1/n is the heterogeneity factor which is
relat-ed to the capacity and intensity of the adsorption, and Ce is the equilibrium concentration. The val-ues of Kf and 1/n can be obtained from the slope and intercept of the plot of log qe against log Ce
[25]. e f C n K 1 log log q log e = + equation 4
3. MATERIALS AND METHODS
3.1. Obtaining Simulated Waste
Brazilian NPP provided the results for the oil contamination made by gamma spectroscopy. The results show contamination with 60Co and 137Cs. This information and the bibliographic references cited lead to the choice of cobalt as nuclide of interest for the simulated waste.
Two kinds of lubricant oils, Mobil Turbina 46 and Mobil SHC 624, the most used in the Brazilian Nuclear Power Plants (NPP), were mixed in equal proportions. This oil was heated until 200°C with air injection. When this temperature was reached, the standard of organometallic cobalt in mineral oil Specsol was added in a proportion to reach the final expected concentration of about 20 mg.kg-1. The mix was then kept at 200°C with air injection for one hour. This procedure was conducted to simulate the oil oxidation and ageing, similarly to the real contaminated oil.
3.2. Equilibrium and Kinetic Studies
The experiments were conducted in controlled room temperature of (22±3)°C. The vessel was a 200 mL glass beaker with agitation by overhead stirrer. Commercial bentonite Brasgel FF (sodic smec-titic activated clay) was added to the simulated waste. The concentrations of bentonite were 0.5, 1, 3, 6 and 10% by weight. The mixture continued to be stirred for maximum 120 min. At each prede-fined time, samples were withdrawn during stirring. The samples were filtered with a membrane filter of 0.45 µm, to separate the loaded sorbent and the oil, which was analyzed for cobalt concen-tration.
In order to elucidate the mechanism of sorption, two kinetic models widely used were investigated to find the best- fitted model for the experimental data obtained, namely pseudo-first-order kinetic model and pseudo-second-order kinetic model.
The amount of sorption at time t, q (mg.g-1), was calculated using equation 5, where C (mg.kg-1) is the oil phase concentrations of cobalt at any time, Co (mg.kg-1), is the initial concentration of cobalt in oil, M is the oil weight (kg) and m is the mass of bentonite (g).
equation 5
3.3. Sorption Batch Tests
The experiments were conducted in controlled room temperature of (22±3)°C. The vessel was a 200 mL glass beaker with agitation by overhead stirrer. Commercial bentonite Brasgel FF (sodic smec-titic activated clay) was added to the simulated waste in concentrations 0.05, 0.1, 0.2, 0.5, 0.7, 1 and 3 % by weight. The mixture continued to be stirred for 30 min, as defined by the equilibrium con-tact time tests. After this time, they were filtered with a membrane filter of 0.45 µm, to separate the loaded sorbent and the oil, which was analyzed for cobalt concentration. The amount of sorption at time t, q (mg.g-1), was calculated using equation 5.
Freundlich and Langmuir isotherm constants were determined from the plots of ln qe versus ln Ce
and Ce/qe versus Ce, using MS Excel for Windows. 3.4. Chemical Analysis
The concentration of cobalt in oil was measured by Energy Dispersive X-ray Fluorescence Spec-troscopy (EDX-720, Shimadzu). Samples that showed concentrations above 0.1 mg.kg-1, were
ana-lyzed by atomic absorption (with air-acetilene torch, equipment AA240FS, Varian) after calcination of the oil sample and quantitative solubilization of the ashes with analytical grade HNO3.
4. RESULTS AND DISCUSSION
4.1. Equilibrium and Kinetic Studies
The results are shown in Figure 1. For the S/O (sorbent/oil) ratio 3, 6 and 10%, the equilibrium con-tact time was rapidly reached. These tests were carried out twice, and q given are average values. It
is not possible to conclude about the equilibrium time with the complete sorption of cobalt in few minutes, as occurred to these S/O ratios. This situation indicates sorbent excess. For this reason, the S/O ratio was reduced to 0.5 and 1.0%, with results displayed in the same figure.
Figure 1: Equilibrium study for sorbent/oil (S/O) ratio of 0.5, 1.0, 3.0, 6.0 and 10.0%.
For S/O ratio 0.5 and 1.0%, it can be observed that the adsorption capacity increased with time and, at about 30 min, there is a tendency to reach a constant value, where no more cobalt is removed from the oil. Even though there is no complete stabilization of the amount of sorption of cobalt (q), the increments in these values are about 10-1 mg.g-1 and thus considered negligible.
At this point, the amount of cobalt being adsorbed onto the material is in a state of dynamic equilib-rium with the amount of cobalt desorbed from the adsorbent. The time required to attain this state of equilibrium was termed the equilibrium time (te in min) and the amount of cobalt adsorbed at te
re-flected the maximum cobalt adsorption capacity of the adsorbent under these conditions. [16]
For this reason, the equilibrium time of 30 min was assumed. After this period, the initial variations in concentration seems concluded. Thus, 30 min was the equilibrium time to be used in the sorption tests.
The same results for the S/O ratio 0.5 and 1.0% were fitted to two kinetic models widely used, in order to elucidate the mechanism of sorption, namely pseudo-first-order and pseudo-second-order. Plots and linear regression were constructed using MS Excel for Windows.
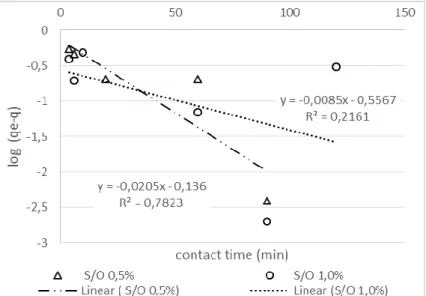
In Figure 2 is shown the curve log(qe−q) versus t, which should be a straight line if the pseudo first
order kinetic model were applicable. The dots represent the experimental data and the line is the equation modelled. The initial qe value was chosen as the biggest value obtained, to calculate
log(qe−q).
For the S/O ratio 1.0%, the determination coefficient, r², was 0,2161, and to the S/O 0,5%, 0,7823. Both r² are not close to 1 as expected to validate the model [28]. For this reason, parameters k1 and
qe were not estimated. The experimental results do not follow pseudo first order model, indicating
that the sorption is not diffusion controlled.
Figure 2: Plot of log(qe−q) versus contact time t, with pseudo-first-order kinetics, for sorbent/oil
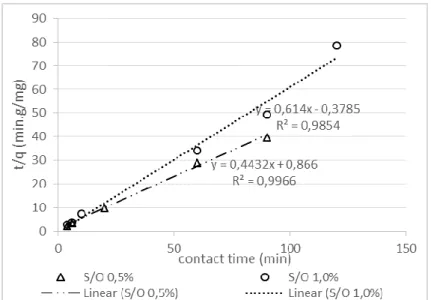
Figure 3 shows the plot of t/q versus t. The applicability of the pseudo-second-order model can be examined by considering the linearity of this plot. The dots represent the experimental data and the line is the equation modelled.
For the S/O ratio 1.0%, the determination coefficient, r², was 0.9854, and to the S/O 0.5%, 0.9966. Both r² are close to 1 as expected to validate the model [28]. Thus, with 95% confidence level, it can be concluded, from the plots that the pseudo-second-order kinetic model is applicable to the de-contamination of oil when this bentonite is used as a sorbent.
Figure 3: Plot of t/q versus contact time t, with pseudo-second-order kinetics, for sorbent/oil (S/O)
ratio of 0.5 and 1.0%.
Table 1 shows the results for the pseudo-second order model: the linear equation and the determina-tion coefficient, r², as well as the rate constant, k2; initial sorption rate, h and amount of cobalt
ad-sorbed at equilibrium, qe (mg/g), calculated using the linear equations parameters.
For the same initial concentration of cobalt in the oil phase, the equilibrium amount of sorption cal-culated by the model, qe, is similar for both rel S/O: about 2 mg.g-1. The calculated qe values also
model. Sorption capacity of about 1.7 mg.g-1 for Co(II) using natural Na-bentonite in aqueous solu-tion is reported in the literature [29].
Table 1: Linear equation for the pseudo-second order model and parameters calculated
us-ing the equation for S/O ratio 0.5 and 1.0%.
S/O ratio Linear equation k2 (g.mg-1.min-1) h (mg.g-1.min-1) qe (mg.g-1) r²
0.5% t/q = 0.866 + 0.4432 t 0.23 0.23 2.3 0.9966
1.0% t/q = -0.3785 + 0.614 t 1.0 1.0 1.6 0.9854
As expected, more sorbent represents higher initial sorption rate and rate constant, due to the avail-ability of more sorption sites.
The adsorption system obeys the pseudo-second-order kinetic model for the entire sorption period and thus supports the assumption behind the model that the adsorption is due to chemisorption. In other words, the adsorption has a character of a chemical process that occurs in a monolayer.
There are other kinetic models that might be evaluated, like Elovich and the intraparticle diffusion model [16], [18], [30]. The results of the determination coefficient r² for the linear equations applying these models were not close to one. For this reason, this study does not report these results.
4.2. Sorption Tests
The Langmuir and Freundlich isotherms are shown in Figure 4 and 5. Freundlich and Langmuir isotherm constants were determined from the plots of ln qe versus ln Ce and Ce/qe versus Ce, using
MS Excel for Windows. Table 2 shows the linear equation obtained, the linear determination coefficients, r², for Freundlich and Langmuir isotherms and the constants calculated for each isotherm model.
Table 2: Summary of the Freundlich and Langmuir isotherm constants, linear equation and
respec-tive determination coefficients
Model isotherm Langmuir Freundlich
linear equation C/qe = -2.4257/qm + 13.305 log qe = -1.9859 + 3.7254 log Ce
r² 0.5079 0.8224
Constants qm = -0.41 mg.g-1 Kf = 0.010 kg.g-1
KL = -0.18 kg.mg-1 n = 0.27
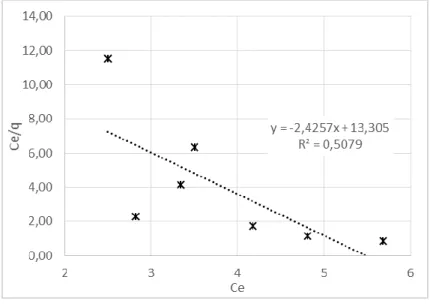
The applicability of the Langmuir isotherm to the data obtained by oil with bentonite can be examined from the plot in Figure 4. The Langmuir isotherm is considered to apply if the plot of Ce/q vs. Ce is linear. The determination coefficient calculated, r² = 0.5079, shows that Langmuir
model is not applicable to the conditions studied. The Langmuir isotherm constants are listed in Table 2. The value calculated for the sorption maximum amount, qm, is very low when compared to
experimental data, reinforcing that the model is not well fitted.
Figure 4: Plot of Ce/q versus Ce and linear regression to Langmuir equation.
The applicability of the Freundlich isotherm to the oil can be examined by considering the plots of log q vs. log Ce, given in Figure 5. Generally, the linearity of the logarithmic plot is an indication
that the Freundlich isotherm is being obeyed by the system in question. Thus, it can be concluded from the plots that the Freundlich isotherm is not applicable to the decontamination of oil when this bentonite is used as a sorbent, in the studied conditions.
Figure 5: Plot of log qe versus Ce and linear regression to Freundlich equation.
The n and Kf values in Table 2 were obtained from the intercept and slope in the Freundlich
adsorption isotherm. Kf is a constant that represents a measure of the surface area of the adsorbent,
whereas n is an indication of its characteristic manner of adsorption [27]. Due to the low determination coefficient and the non-applicability of Freundlich model, no conclusion can be inferred from the calculated constants.
Both isotherm models chosen for this work did not fit to the experimental data. Thus, the studies must be repeated to evaluate data variability and better statistical inference. Other isotherm models will be evaluated to choose the best fitted one and describe the sorption of cobalt on bentonite in oil matrix.
5. CONCLUSION
It is possible to conclude that the adsorption kinetics correlated reasonably well with the pseudo-second-order kinetic model for the entire sorption period and thus supports the assumption behind the model that the sorption is due to chemisorption.
The adsorption equilibrium did not correlate with Langmuir nor Freundlich isotherm. Even though it was not possible to correlate the experimental data to any isotherm model tested, bentonite has considerable potential as a sorbent for the removal of cobalt from lubricant oil.
These were the preliminary results. Further studies must be carried out for a better comprehension of the sorption mechanisms and isotherms, also applying other models and the isotherm equations non-linearized, as it has been common in literature. Complete characterization of the sorbent must be undergone and the team has been testing other sorbents.
6. ACKNOWLEDGMENT
Acknowledgement to CNEN for the financial support. The authors thank to CDTN/CNEN – Centro de Desenvolvimento da Tecnologia Nuclear, institution where the tests and analysis were per-formed, as well as the colleagues from Eletronuclear, especially John Wagner Amarante. Thanks to Luiz Carlos da Silva and Liliani Pacheco Tavares for the chemical analysis and collaboration.