I begin with an overview of the species inventory concept, talking about its importance and applications. This thesis is mainly about the techniques that allow the inventory of the species that exist in our environment.
Characterizing Species Diversity
The concept of species inventory is quite old and different people in their time tried to group individuals to distinguish them and to classify them using different methods of biological classification and taxonomy. In the next section I will explain how classification was done in the past and how it has evolved over time.
Biological Classification And Taxonomy Through History
However, this species definition is based on the modern biological species concept introduced by Mayr (1942). With the acceptance of Darwin's theory of evolution, scientists began to present classification in the form of a tree of life, and the concept of reclassification of life emerged.
Common Methods For Classifying Organisms
Classification Based On Physical Traits
Classification Based On Evolution
DNA Barcoding
- The Barcoding Principle
- Role Of The Consortium For The Barcode Of Life
- The Choice For A Suitable Barcode Loci
- DNA Barcoding Types
- Applications Of DNA Barcoding
- Multiple Species Identification And Limitations Of Standard Bar-
The idea was quickly extended to include flowering plants (Kress et al., 2005) and fungi (Min and Hickey, 2009), and now the DNA barcoding initiative can be considered a tool that fits the entire tree of life. Based on these characteristics, several loci have been proposed, but the best known is the COIgene (Hebertet al., 2003b).
DNA Metabarcoding
DNA Metabarcoding With New Sequencing Techniques
The classical barcode system is based on the Sanger sequencing approach (Sangeret al.,1977) and can target individual specimens. These new sequencing technologies can help directly analyze biodiversity in bulk environmental samples through their massively parallelized ability to read thousands of sequences from mixtures (Hajibabaeiet al., 2009).
Barcode Designing For Metabarcoding Applications
To design the barcodes most relevant to a particular study, we can make use of the large public databases of sequences that exist today (Ficetola et al.,2010). To search for the relevant sequences for a specific study, for example from NCBI's GenBank, BLAST program (Altschul et al., 1997) can be used.
Finding Conserved Regions
- Some Computer Science Considerations
- Locating Conserved Region With Multiple Sequence Alignment
- Finding Conserved Region Without Multiple Alignment
- Some Important Properties Related To Oligonucleotide Primers
- Barcode Designing Tools
- Our Contribution
The total length of all strings at all edges of the tree is O(n2) but each edge can be stored as the position and length of a substring of τ, giving a total space usage of O(n) computer words. Multiple repetitions of such a cycle lead to overproduction of the selected region (Saikiet al., 1985).
More Deep Into DNA Metabarcoding
Combinatorial Problems And Approximate Methods
Local search algorithms start from an initial solution and try to find a better solution in a suitably defined neighborhood of the current solution. To avoid the problem of trapping in local minima, some extensions of the local search algorithms have been proposed.
Metaheuristics
One possibility to improve the performance of the local search algorithm could be to increase the size of the neighborhood used in the local search algorithm. This means that at a fixed temperature, the greater the difference △= f(s)− f(s′), the less likely we are to accept the displacement iztos′.
DNA Sequence Analysis
Errors Due To DNA Degradation
According to Gilbert et al. (2007) the inflated rate of transitions attributed to DNA damage processes may be due to incorporation. According to Briggs et al. (2007) depurination results in an overrepresentation of purines at sites adjacent to breaks in ancient DNA.
PCR Errors
For example, the Ribosomal Database Project (RDP-II) developed by Coleet al. (2003) provides a program called Chimera Check and Komatsoulis and Waterman (1997) developed an application called chimera alignment to detect sequences chimeric. The latest applications developed to detect chimeric reads include; ChimeraSlayer (Haaset al.,2011) and Persus (Quinceet al.,2011).
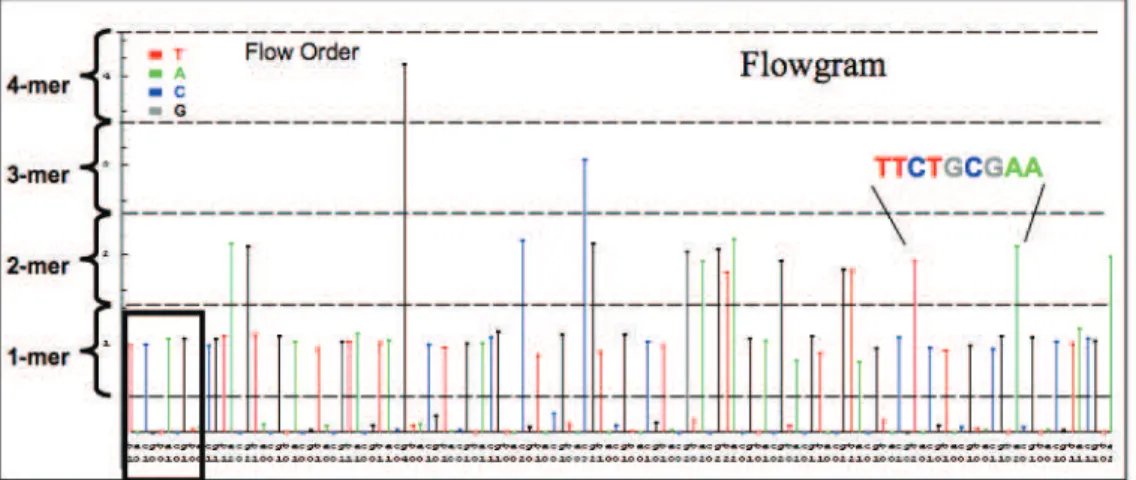
Sequencing Errors
The typical read length is 100 bp, but read length is inversely related to base calling accuracy (Dohmet al., 2008). Perhaps the best known among these algorithms is PyroNoise (Quince et al., 2009) which distinguishes noisy reads from true sequences from a 454 run.
Conclusion
Résumé
To define a scoring function for measuring the quality of barcode areas, we can introduce our knowledge about good barcode markings into our algorithm. Depending on the application, we may be interested in optimizing one or all quality measures, such as gain range, ability to distinguish taxa, and barcode region length.
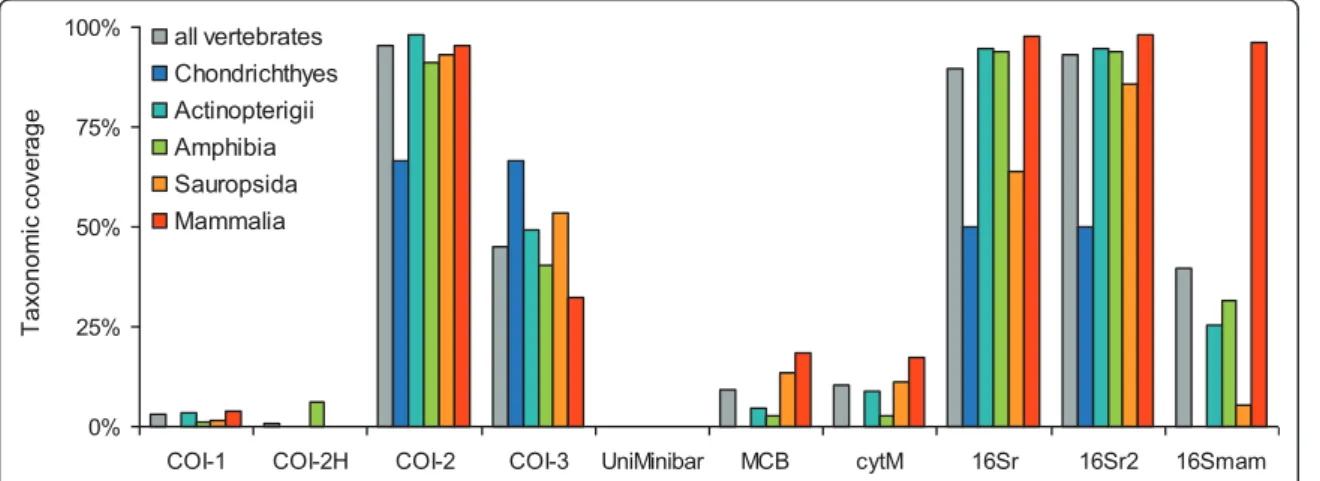
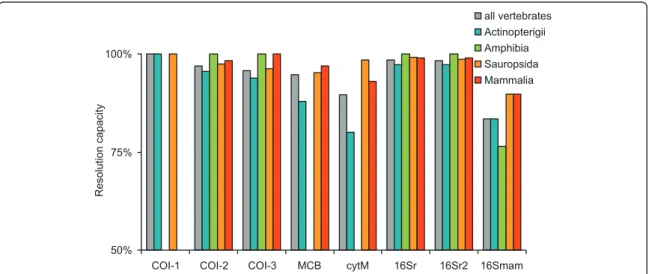
An In silico Approach For The Evaluation Of DNA Barcodes
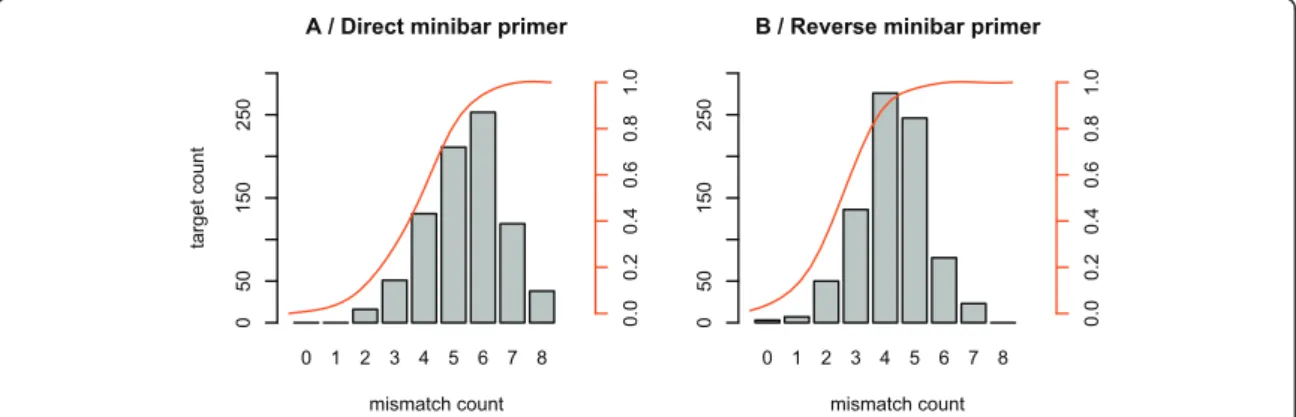
Then we performed in silicoPCR on the entire Gen-Bank to evaluate the resolution of the amplified fragments representing the proportion of unambiguously identified taxa. For the analyzes presented in this article, we allowed two mismatches between each primer and the template, except on the last 3 bases of the 3' end of the primer.

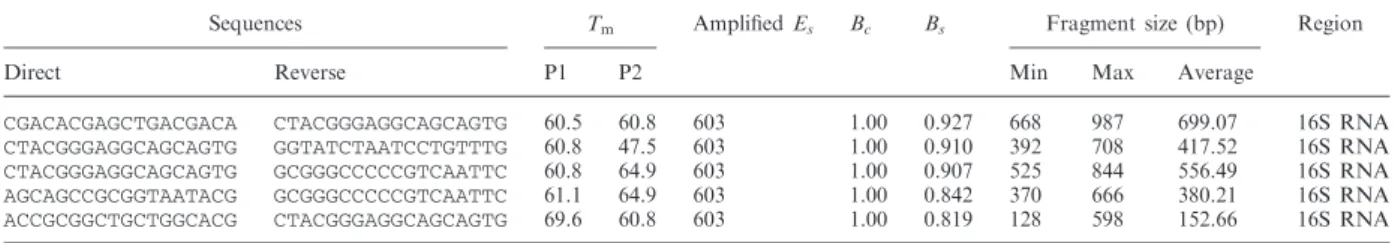
Complete Formalization Of B c And B s
- Complete Formalization Of B c
- Complete Formalization Of B s
- Extending The Definition Of B s
- Falsely Increased Value of B s
And conversely the set of all individuals (may belong to multiple taxa) identified by a barcode of regionris, given as:. Two taxa are considered to share a barcode sequence if at least one barcode sequence of the first taxon is strictly identical to a sequence included in the barcode sequence of the second taxon.
Conclusion
Résumé
This metabarcoding approach (ie the simultaneous identification of many taxa from the same sample) has a wide range of applications in forensics, ecology and paleoecology. Analysis of diet of small herbivores:. the effectiveness of DNA barcoding combined with high-throughput pyrosequencing to decipher the composition of complex plant mixtures. Front Zool.,6, 16.
One Step Ahead In Metabarcoding: The Sets Approach
- Problem Statement And Complexity
- Score Function
- Design Of Low Coverage Primers
- Reducing The Search Space
- Neighboring Criteria For Metaheuristics
- Results
And then use these low-coverage and highly specific primer pairs as the solution space for meta-heurisitc to find the optimal solution set. This large number of primer pairs increases the search space for metaheuristics, thus increasing the running time of the metaheuristic algorithm.
Can We Avoid PCR ?
The Technique Of Primer Extension Capture
The primer extension capture technique is based on the use of 5'-biotinylated oligonucleotide primers and DNA polymerase to capture specific target sequences from an adapter-linked DNA library. Next, 5'-biotinylated oligonucleotide primers are added to this sequence library and allowed to anneal to their target sequences.
PEC Probes Design
In the context of this study, we refer to these primers as probes to avoid confusion with PCR primers. Since the probe can be amplified in both directions, the actual probe sequence can be determined by the shortest sense or antisense amplification length.
Conclusion
ThusecoPrimerscan designs the barcode markers and their associated PCR primers and ecoProbescan designs PEC probes. This functionality can be very useful in the context of metabarcoding applications, where long barcode markers cannot be used due to unavoidable limitations of damaged DNA.
Résumé
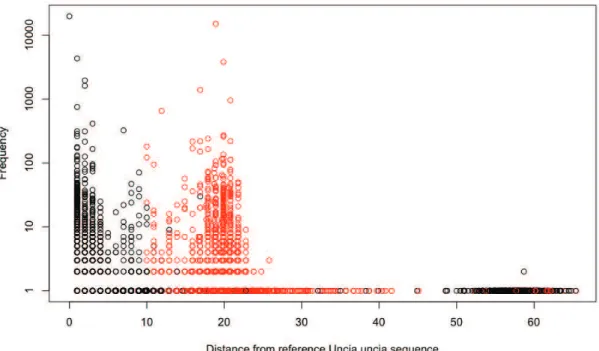
To analyze sequences for learning error behavior, I worked on a series of simple sequences obtained from the diet analysis of snow leopard (Uncia uncia). Feces were collected by field workers from The Snow Leopard Trust in Mongolia in the summer of 2009.
Some Observations About Errors
In all the 10 samples, there were two reference sequences, which were the true sequences of Uncia uncia(UU) and Capra sibrica(CS). Di,j =max(length(Si),length(Sj))−LCSi,j (4.2.1) In figure 4.2 we show a plot based on the distance of all sequences present in a sample from the true Uncia uncia sequence .
Questions And Hypotheses
To be sure that we were only analyzing erroneous sequences, we selected from each of 10 samples all the sequences that had a single nucleotide difference with one or both of the reference sequences. and to characterize errors. In each of the 10 samples, some single base errors are found only once and some occur multiple times.
Some Important Error Properties
Probability Of Errors Is Not Uniform
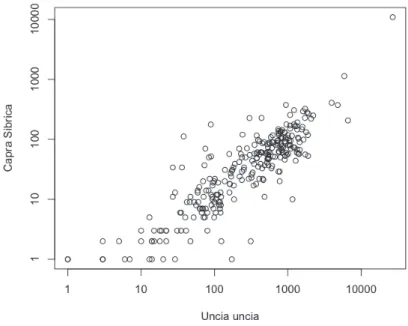
For each of the 45 pairs of PCR samples, after Bonferoni correction for multiple testing, the p-value of the Kendall-Tau test is estimated to be 0 for both species, showing a high similarity between error patterns. Reads corresponding to transitions and transversions occurred at similar frequencies, but more than half of the transversion reads were →gsubstitutions.
Errors Occur Preferentially During PCR Amplification
We can then calculate the Nuu possible number of sequences belonging to UU (all UU sequences, including true and false variants in the total N sequences), using the following equation 4.4.1. And similarly, we can calculate the total number of Ncs sequences belonging to Capra sibrica using the similar equation 4.4.2.
The Error Pattern Is Similar Between Uncia uncia And Capra siberica 117
Standard classification methods, unaware of this behavior, would create a few extra classes for these groups, leading to an overestimation of the number of taxa. Takosobiclean was used to eliminate artifactual sequences generated at different steps of the experimental procedure, and a metabarcoding approach was applied to a noise-free dataset to see if barcode amplification in a mixture of DNA from temperate soils could provide a realistic view on current plant biodiversity.
Conclusion
The distribution of the identified MOTU between the different sites was compared with the distribution of the corresponding species in the botanical areas to evaluate the accuracy and validity of the metabarcoding approach. Although our preliminary analysis leads us to the conclusion that most of the errors do not occur during sequencing and appear to occur during PCR amplification, the odd T→Gtransversions are still somewhat difficult to explain.
Résumé
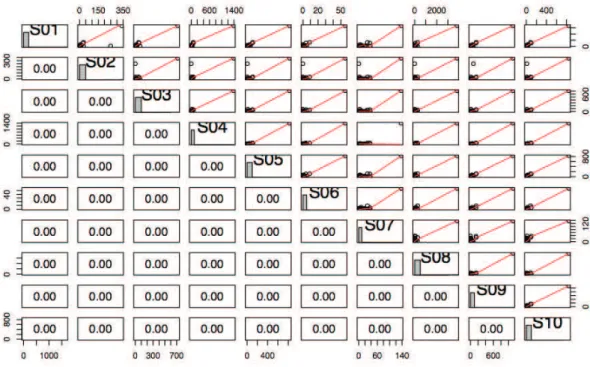
It is very important to see whether all PCR samples from the same sampling site behave similarly or not. However, if one PCR is not correlated with the others, it is important to remove that PCR and then desample the remaining PCR samples to get a realistic view of diversity.
Design Of Barcode Markers
Due to different purposes of metabarcoding, the barcode markers most suitable for such studies are not very general, and therefore it is possible that a single barcode marker cannot identify all the individuals. The most obvious reason for a low increase in Bc seemed to be due to the fact that all primer pairs belong to the same region and thus do not maximize the association of this index.
Analysis Of Sequence Data
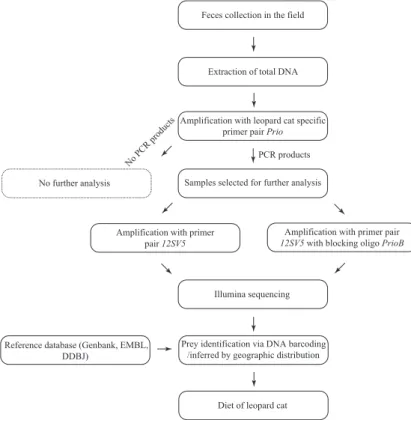
Both national parks are located in Khyber Pakhtunkhwa province and represent two extremes of the leopard cat range in Pakistan (Fig. 2). 1Flowchart diagram showing the different steps involved in the dietary analysis of the leopard cat. The current extent of occurrence of the leopard cat in Pakistan is not resolved (Sheikh & Molur 2004).
Watanabe S (2009) Factors affecting the distribution of the leopard cat Prionailurus bengalensis in East Asian islands.