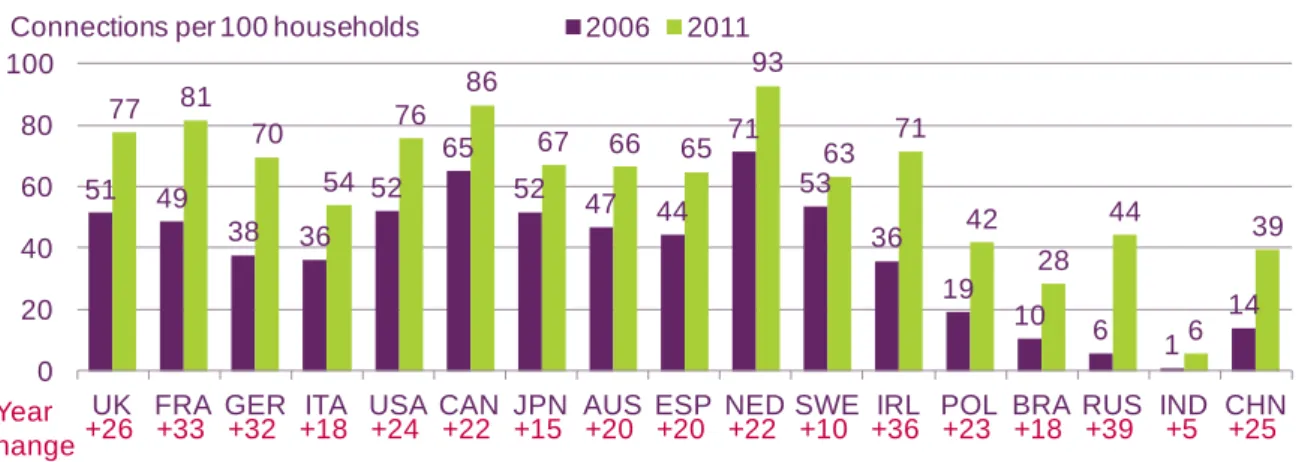
In the UK there were 77 fixed broadband connections per 100 households at the end of the year. More consumers in the UK send greeting cards, invitations and postcards than anywhere else.
Key summary metrics
1 The UK in context
The UK communications industry in context 15
How consumers followed the London 2012 Olympic and
News consumption: the international context 61
International regulatory context and models 76
The UK communications industry in context
- Introduction
- Putting the UK communications industry in context
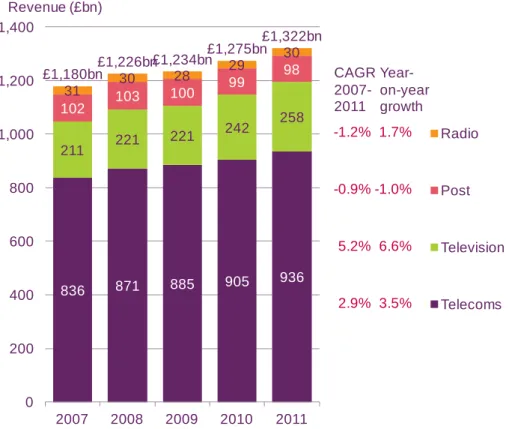
- Communications sector revenues
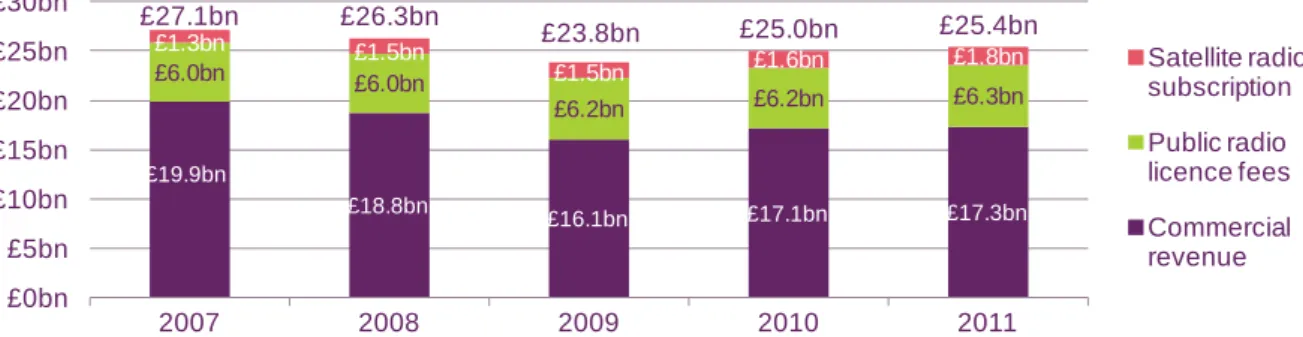
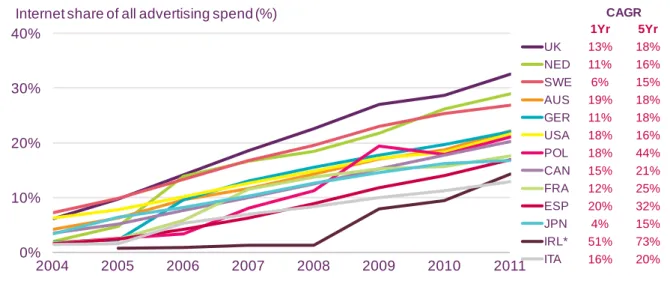
In 2011, the fastest-growing element of total radio revenue was radio subscriptions, which grew 12.5% in 2011. Online advertising spending grew the fastest among the media shown in Figure 1.5, at a compound annual rate of 16.0% in the four years to 2011 to £48 billion.
The UK consumer in context
- Introduction
- Take-up and use of services and media activities
Broadband connections per 100 households among the countries surveyed are highest in France at 81, with the UK in second place at 77. Spain has the highest proportion of digital television (DTV) homes per 100 TV households, with UK in second place.
Changing nature of communications
- Key points
- Introduction
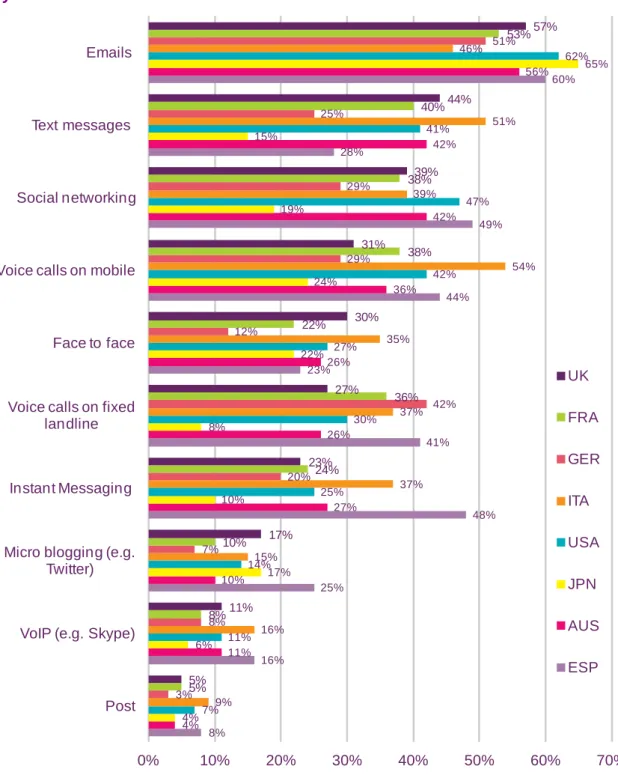
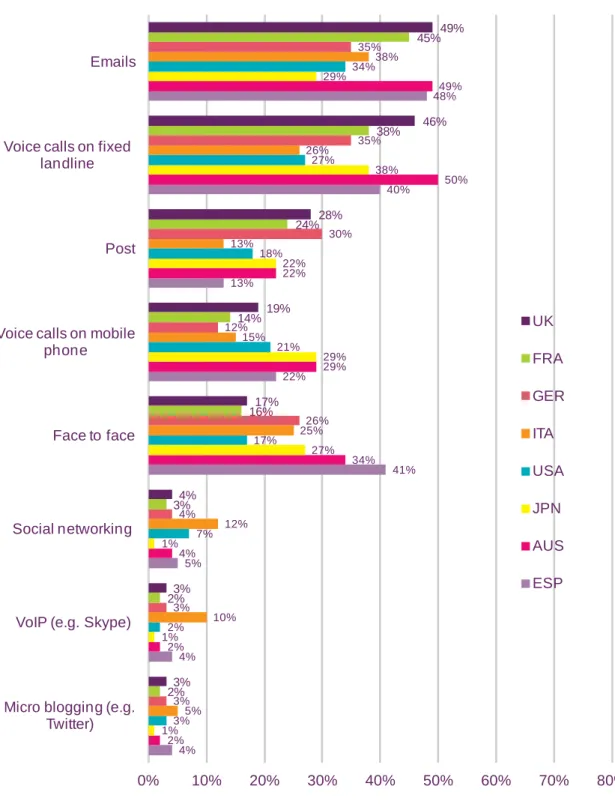
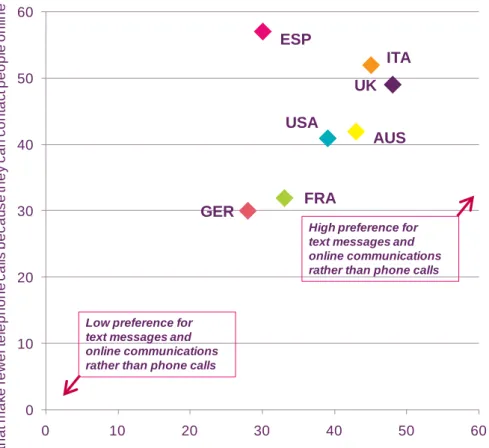
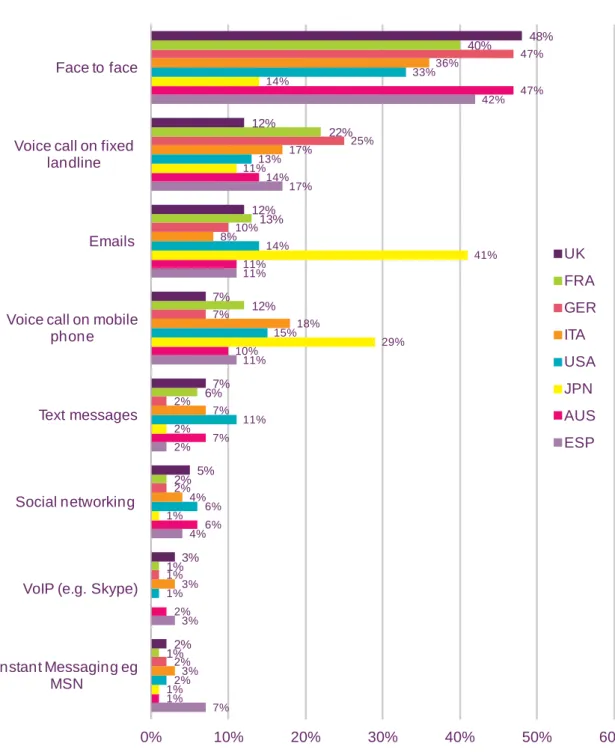
- Preferred methods of communication with friends and family
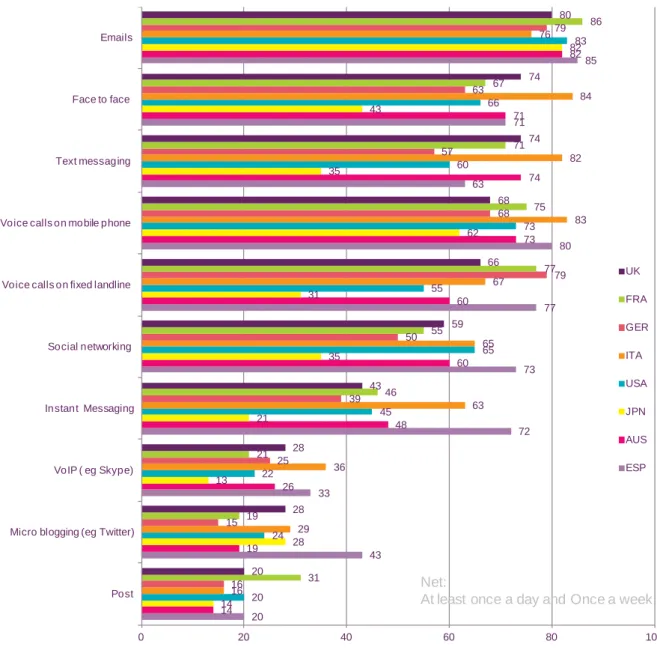
- Frequency of using communication methods with friends and family In most countries email is the most-used method for daily communication with friends
- Communicating by sending greetings
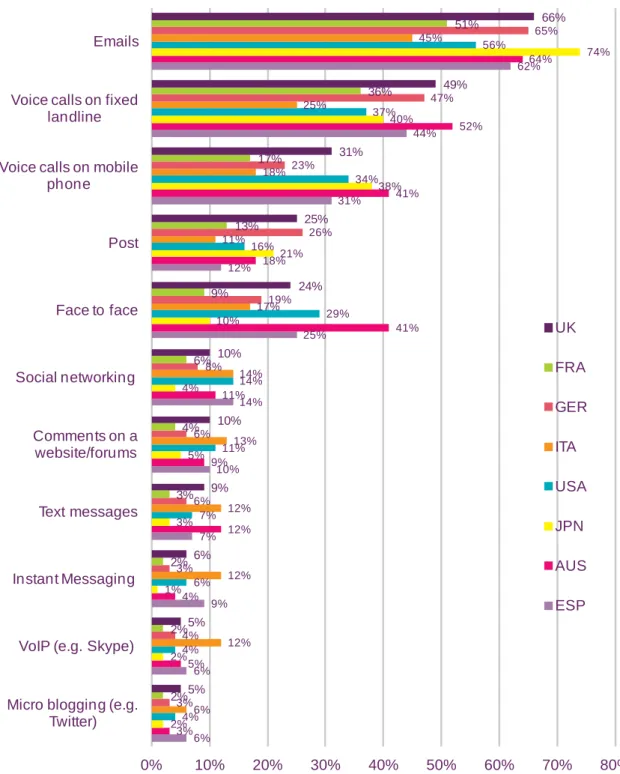
- Communicating with businesses and government Email is widely used for communications with businesses
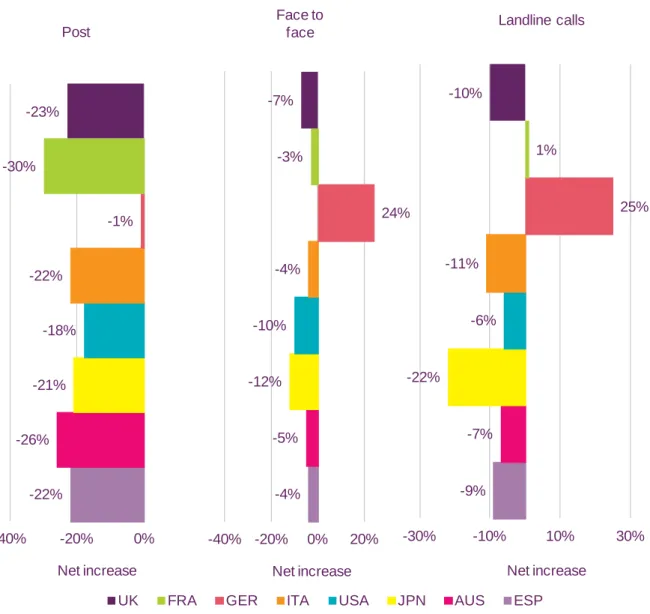
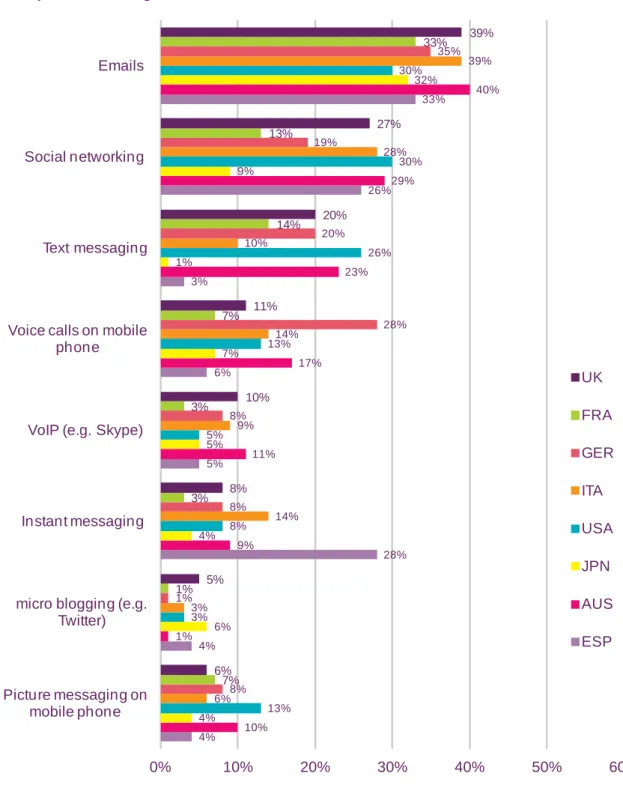
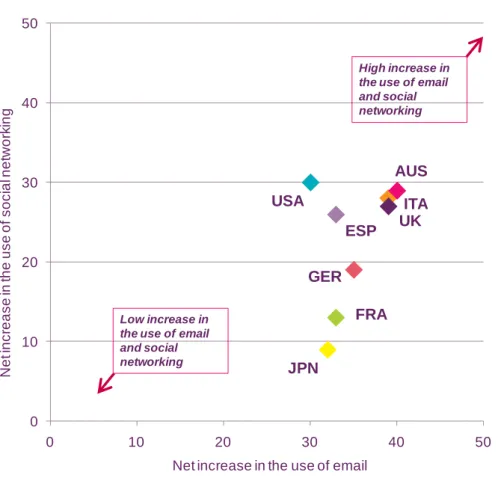
- Summary of consumers’ changing communications use
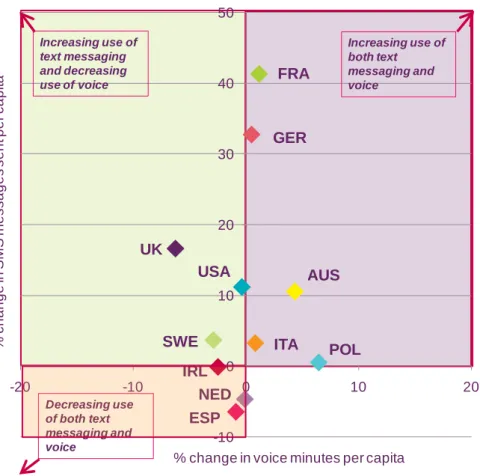
- Four dimensions of change
Four in five UK consumers. communicate with friends and family at least once a week by email; only consumers in Italy. Use of the postal service for business communications is strongest in the UK (25%) and Germany (26%).
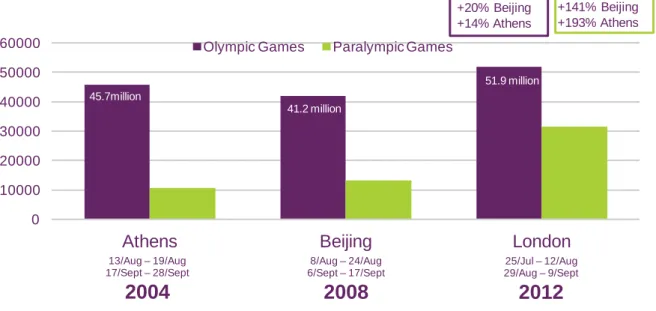
How consumers followed the London 2012 Olympic and Paralympic Games
- Key points
- Introduction
- Following the London 2012 Olympics and Paralympics
More people in Britain watched the Games on scheduled television at least once a week than in any other comparator country. In France, 69% of respondents watched the Games at least weekly via retrospective or recorded television (Graph 1.30).
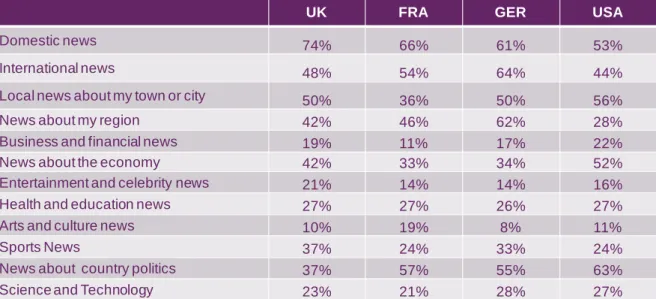
News consumption: the international context
- Introduction
- Digital news consumption – a comparative study
- Platforms used as a main source of news
In Britain, France, Germany and Australia, television is the main source of international news. In Britain, France, the US and Japan, television is the main source of local news. In Great Britain, a third (34%) use the internet as their main source of sports news (in Italy this is 40%).
A third of respondents in the UK use the internet as their main source of gossip.
A perspective on China
- Introduction
- China as a country and a communications market Demographic and economic factors
- Our research methodology in China
- Our research results in China
Due to the large and diverse population, conducting survey research29 in China is extremely challenging and our research results have some limitations. Internet users in China mainly live in cities and have higher incomes31 and are likely to be early adopters of technology. Unlike data collected from other countries, respondents in our sample in China are not “typical” of the broader population.
A similar observation can be made about the alleged main source of news in China (Figure 1.47).
International regulatory context and models
- Introduction
- Key developments in the European regulatory and legislative framework The EU electronic communications framework
- Helping communications markets work for consumers International mobile roaming
- Promoting effective and sustainable competition Next-generation access networks
- Providing appropriate assurances to audiences on standards
- Promoting the efficient use of public assets
- Contributing to, and implementing, public policy defined by Parliament Online copyright infringement
To advise and assist the Commission in the development of the internal market for postal services and on the consistent application in all Member States of the regulatory framework for postal services. 42 Official Journal of the European Union, Commission Recommendation of 20 September 2010 on regulated access to next generation access networks (2010/572/EU). 50 Ofcom defines media literacy as: "the ability to access, understand and create communication in a variety of contexts".
The United Kingdom, aligned with the European Common Positions (ECP) on all points discussed, signed the final documents of the conference.
2 Comparative international pricing
Comparative international pricing
- Introduction
- Methodology
- Analysis by service Fixed voice summary
- Basket analysis
In the UK, almost half (44%) of the tariffs included in the UK average best price analysis of our connections in July 2012 were SIM-only contracts, up from 30% in July 2011 (it should be noted that where a tariff is SIM-only our model includes the cost of buying a handset separately). The weighted average single-service costs for the fixed broadband element of all three baskets fell in the US in 2012. The lowest standalone 'best deal' prices for the fixed broadband element of the three baskets which included the service were all found in the UK in 2012 (figure 2.8).
The cost of the lowest-priced independent TV services also rose in Italy and Spain in the year to July 2012.

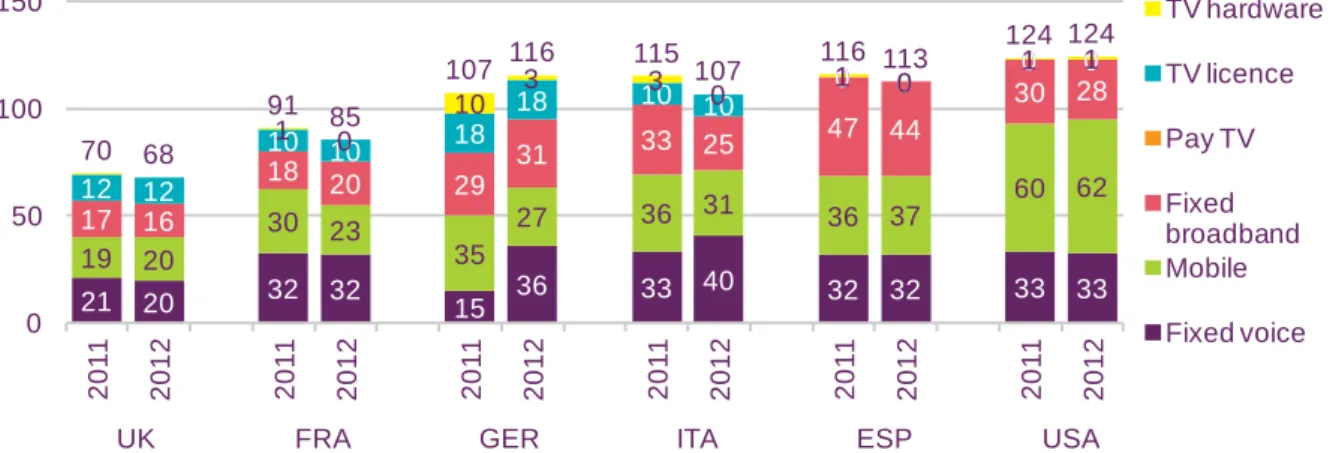
There were significant differences in TV license costs between the six countries, with the TV license being the largest. Note: weighted average of the most favorable tariff of each of the three largest operators by market share in each country; July 2011 and July 2012; PPP adjusted. The Best Offer price analysis shows the lowest possible monthly cost of fulfilling basket usage requirements using the tariffs of the largest providers in each country, including bundled services.
The cost of the TV component of the basket remains the same in the best offer analysis, as it includes free TV, where the only costs are the license fee, hardware and installation.

A broadband household with basic needs
Germany saw the largest increase in the weighted average cost of the fixed voice element of the basket, at almost 150%. The lowest weighted average single service costs for the mobile elements of the package (two handsets with low voice and text usage) were in the UK and France (£20 and £23 per month respectively), while the largest decline in the weighted The average cost of the basket's mobile needs was in Germany, where it fell by £8 per month (23%) to £27 per month as a result of all three providers participating in the weighted average ( Vodafone, T-Mobile and O2). The largest increase in the weighted average cost of the fixed broadband element of the package, in the period to July 2012, occurred in France (where costs rose by 15% to £20 per month).
In Great Britain, the monthly cost of the combined landline and broadband service (including line rental) was £23 in 2012.
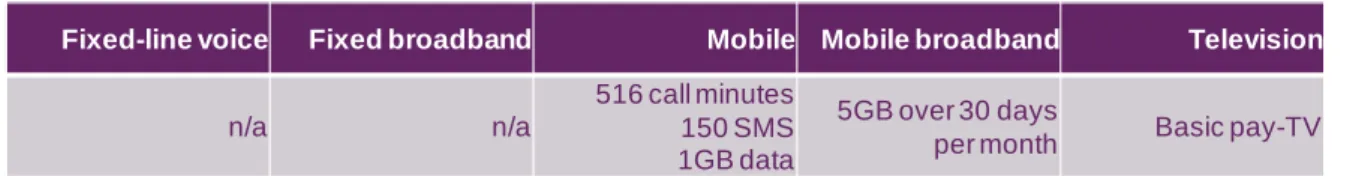
A mobile ‘power user’
The 'weighted average' basket analysis in this report includes the 'best offer' costs for individual services from the mobile broadband element of the baskets, as the relatively narrow range of tariffs available from operators in many countries makes it difficult to find a to produce a meaningful price. The cheapest weighted average cost of meeting Basket 3 requirements in July 2012 was £100 per month in Britain, unchanged from 2011; a £1 per month increase in the mobile phone element of the basket was offset by a decrease in the cost of the mobile broadband element. The UK offered significantly lower mobile phone prices than any of the other five countries included in the analysis due to the high usage this basket requires, with the weighted average (£55 per month) 23% lower than the following least expensive country (France, at £68 per month).
Note: Lowest available rate for any service type from one of the largest operators by market share in each country, July 2011 and July 2012; PPP adjusted.
A family household with multiple needs
The lowest total 'weighted average' cost for all four connections included in the basket was found in the UK at £79 per month, while the highest total weighted average cost to fulfill mobile requests from the basket was in the US, where was more than two and a half times that of the UK, at £204. In contrast, only five of the 35 tariffs included in the weighted average for the two high-use connections included in the basket (connections 5 and 7) were prepaid, and the remaining 30 were post-contracts (10 of which were SIM services) . -only). While the basic requirements of the pay TV element of basket 4 are the same as those of basket 3, it is notable that many package plans provide services that go beyond the minimum.
Note: Lowest tariff available for each service type from any of the largest operators by market share in each country, July 2011 and July 2012; PPP adjusted; If a service is included in a package, any additional consumption charges are recorded separately against the relevant service.

An affluent two-person household with high use of mobile, internet and HD premium TV
- Conclusion
France was the only country where the cost of the fixed vote element of the basket fell in the year to July 2012 (it rose by 4% in the UK, the biggest proportional rise among our six comparison countries). As was the case with the fixed broadband elements of Baskets 1 and 2, the weighted average cost of the broadband connection required by Basket 5 was the lowest in the UK. All five of the lowest 'weighted average' single service prices and four of the lowest 'best offer' (including multi-play) basket prices were found in the UK.
Low UK basket prices were largely due to 'weighted average' and 'best offer'.

3 Television and audio- visual
Market developments in the TV and audio-visual markets 129
Market developments in the TV and audio-visual markets
- Industry metrics and summary
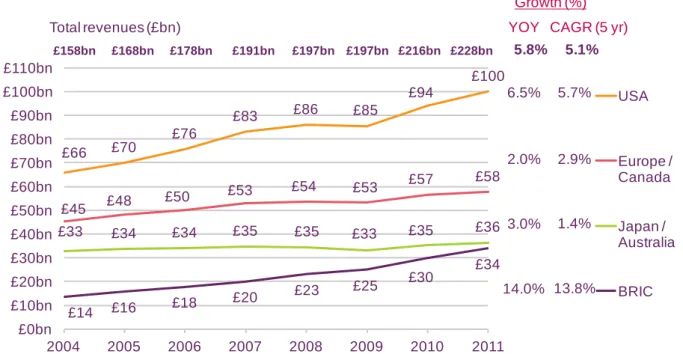
- Global TV revenues increased in 2011, driven by strong growth in subscription income
- Continued growth in value-added services on DTV
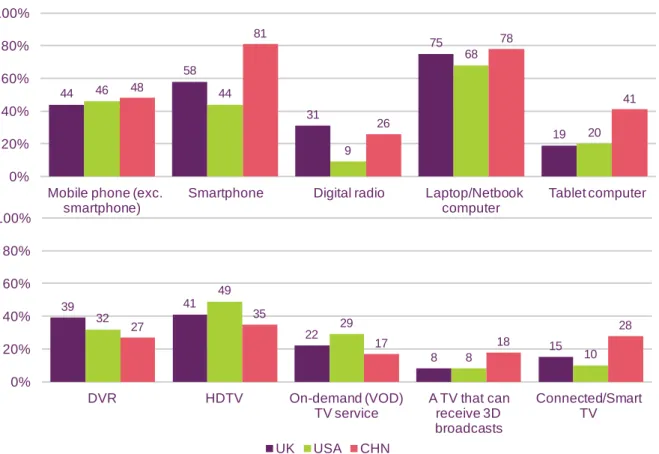
- UK consumers most likely to use online TV services
People in the UK and France have the highest ownership of connected TVs among the countries included in our research. Digital video recorders are widely available in the UK, with 39% of people in our research claiming to own a DVR device. In India, Russia and China, growth in the proportion of DTV homes accelerated slightly in 2011.
With the exception of China, people in the UK and France have the highest ownership of connected TVs among the countries included in our research.

The TV and audio-visual industries
- Summary
- Television revenues among comparator countries
- TV revenue per head among comparator countries Revenue per head in the UK increased by almost 4% in 2011 to £180
- TV licence fees most common in Europe
- Revenues up marginally for most free-to-air broadcasters
- Pay-TV revenues up despite difficult trading conditions
Among the major European television markets of Germany, the United Kingdom and France, pay TV was the fastest growing source of revenue over the five-year period between 2006 and 2011 and represents the largest source of TV revenue for these countries. Revenues for pay TV broadcasters increased in 2011 for all but one operator in our analysis. In most countries in our analysis, including the UK, pay TV operators have grown ARPU over the five-year period since 2006.
ARPU is Average Revenue Per User, which represents the average revenue generated per pay TV subscriber.
The TV and audio-visual consumers
- Summary
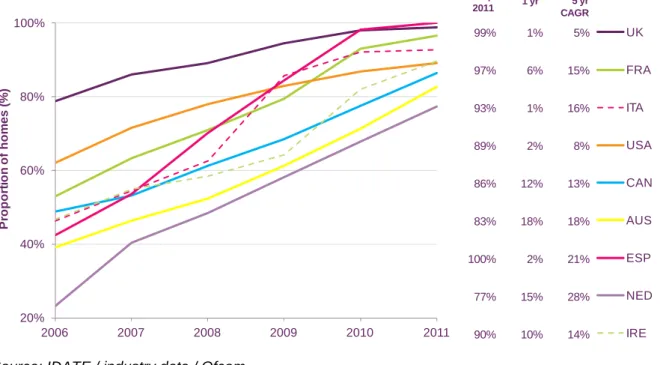
- Digital television take-up on main sets
- Pay-TV take-up
- Consumption of broadcast television services
Digital satellite was the leading platform in the Republic of Ireland with a market share of 53%, the most proportional take of the platform worldwide. The UK also has The use of high definition television services continues to grow globally. Digital video recorders (allowing viewers to pause and rewind live television and save content), were available in 39% of UK homes in 2011 - the highest take-up of all.
Over the five-year period, the most substantial increase in pay TV usage occurred in Brazil (where the five-year average annual growth rate was 22%).
4 Radio and audio
Radio and audio
- Industry metrics and summary
- Broadcast radio revenues among comparator countries up 1.6% in 2011 Radio revenue has grown for the second consecutive year
- Take-up of digital radio sets is highest in the UK
Among the countries we surveyed, the use of digital radio is highest in the United Kingdom. The largest absolute increase in revenue was in the US, where satellite radio subscription revenue grew, as Figure 4.5 shows. The biggest absolute increase in advertising revenue, among those countries with license fees, was in the UK.
Digital radio penetration in the UK (31%) is higher than in any of the other countries we surveyed, as Figure 4.7 shows.
The radio industry
- Introduction
- Global radio revenue
- Revenues among comparator countries
This growth has been driven by the increase in the number of FM licenses granted by the Indian government, a. The radio markets in the US, Germany and Sweden generated high per capita revenues in 2011. UK FRA GER ITA USA MUND JPN AUS ESP NED SWE IRL POL BRA RUS IND CHN Radio Advertising Public Radio License Fees Satellite Radio Subscription.
UK FRA DU ITA US CAN JPN AUS ESP NED SWE IRL POL BRA RUS IND CHN Advertising License fees Satellite radio subscriptions.

The audio consumer
- Introduction
- Regular listening to radio and other audio content
- Consumers prefer to use the internet to download audio content rather than listen to the radio online
- The role of radio as a main source of news
In the countries we surveyed, consumers were more likely to use their home internet connection to download audio content than to listen to radio online. Using the internet to download or listen to audio content was most popular in China, where half (51%) of respondents claimed to have used their home internet connection for this purpose. People in Australia claimed to be the least likely to listen to radio online, at just 13%.
Almost three in ten (28%) people in the UK have used their phone to listen to MP3s.

5 Internet and web-based content
Key market developments in internet and web-based content 185
Key market developments in internet and web-based content
- Industry metrics and summary
- Internet advertising
In 2011, spending on mobile internet advertising was the largest in Japan, with revenues of just over £1 billion. Spend per head on mobile internet advertising remains highest in Japan at £7.99, despite spending per head more than doubling in the UK (£3.12 per head) and the US (£3.18 per head) . The UK has the fourth largest spend on mobile internet advertising (£196m), behind China at £285m.
Per capita spend on mobile internet advertising remains highest in Japan at £7.99, despite a more than doubling of per capita spend in both Britain (£3.12 per head) and the USA (£3.18 per head).
Internet and devices
- Introduction
- Internet take-up, by platform
- Internet-enabled devices
- Online audiences
Most of our other comparison countries see similar levels of adoption (13-15%) of tablet computers for internet access. Using an eBook reader to access the internet is most popular in the US (7% of internet users). In Britain, internet users have more access to the internet on their laptops than in any other country.
A higher proportion of internet users in the UK use their laptop to access the internet (51%) than in any of our comparison countries, while the US had the lowest proportion of internet users doing so (36%).