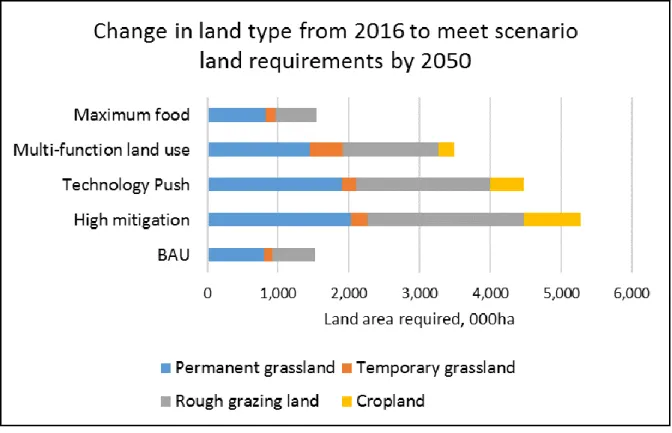
Afforestation and peatland mitigation measures were associated with the greatest reductions in land use emissions compared to business-as-usual. The high mitigation survey and the multifunctional land use scenarios had an approximate balance in the areas of land needed and land saved.
Overview of the context of the project
Overview of the objectives of the project
This project has modeled emissions from mitigation measures based on methodologies developed by the project team for use in the Agriculture and LULUCF sectors of greenhouse gas inventories. Agricultural Inventories and LULUCF estimate GHG emissions using methodologies based on internationally agreed guidelines (IPCC 2006).
Description of the different mitigation measures and levels of ambition
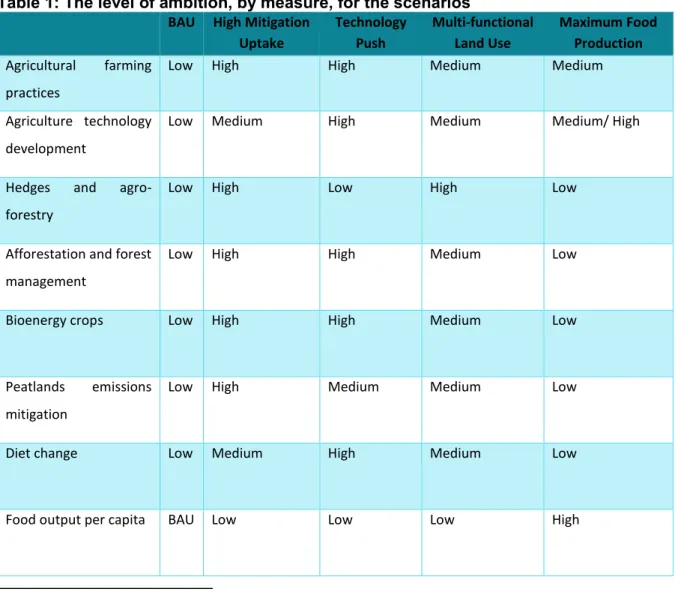
- Agricultural practices and technology
- Forestry
- Bioenergy Crops
- Peatland
- Hedgerows and agroforestry
- Human dietary change
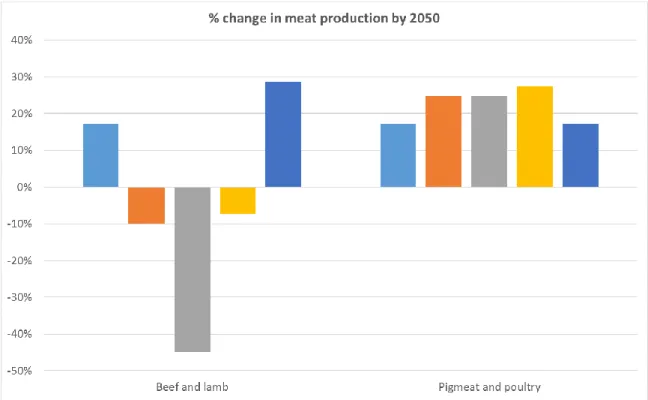
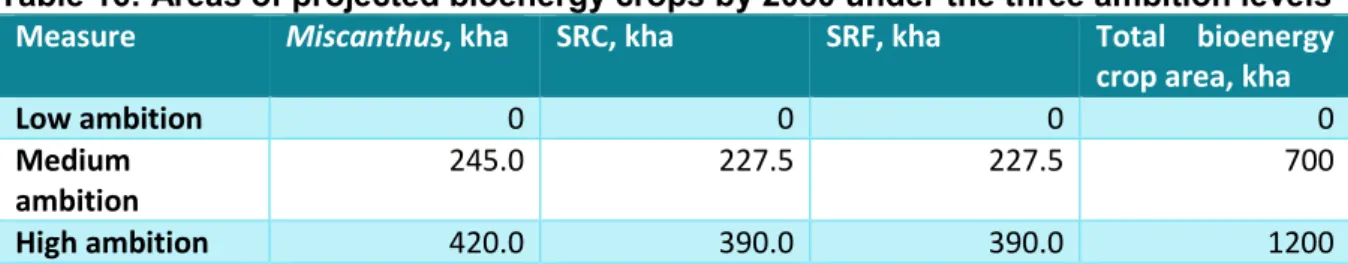
In the high ambition, there is a 50% reduction in domestic consumption and export of red meat and dairy by 2050. The medium ambition assumes an increase in the area of biomass fuel crops (SRC willow and Miscanthus) in 2050 at 7,000 kha, which is half of the Institute of Energy Technology target of 1,400 kha (ADAS 2016).
Scenario description
For all scenarios (except 'Maximum food production') the UK consumption per per capita calories at 2016 levels based on the UK population growth forecast5 as well as UK production as a proportion of UK consumption for each crop or livestock product6. To derive the required production levels for future years, it was assumed that exports remained at 2016 absolute levels (unless there was overproduction e.g. under the 'Max food production' scenario) and imports increased pro-rata with population growth.
Agriculture
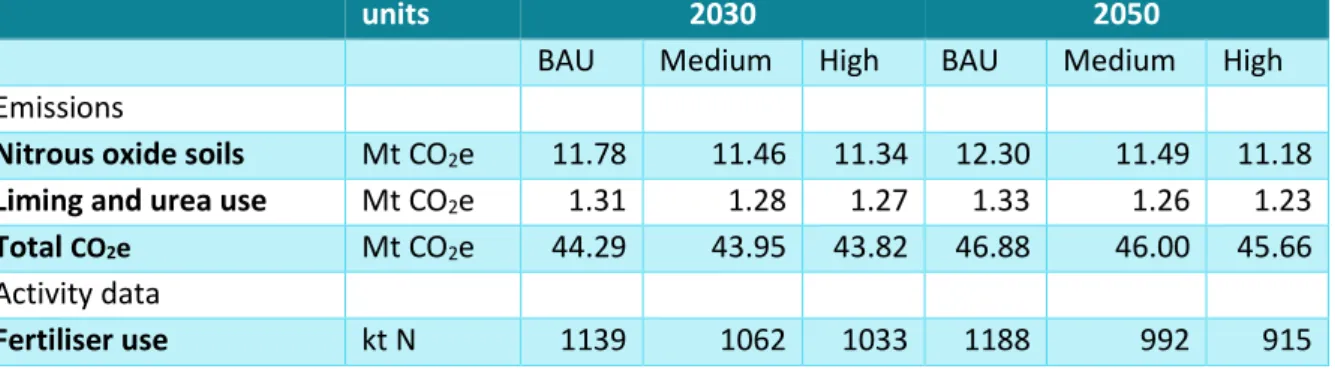
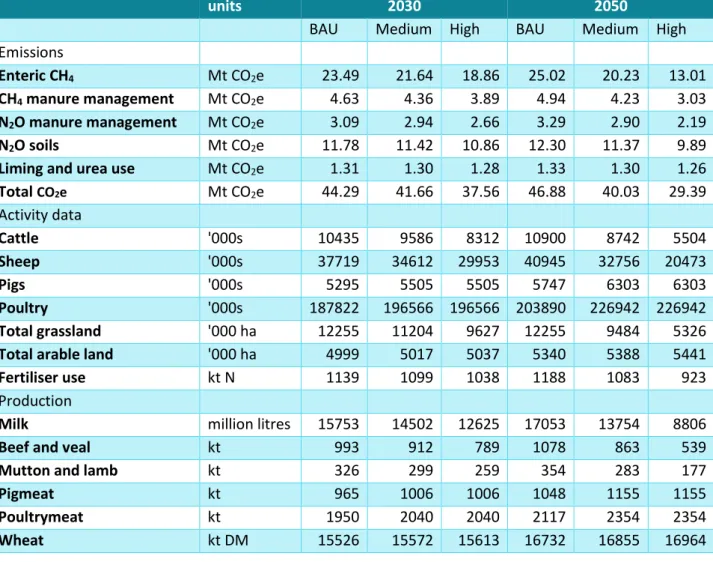
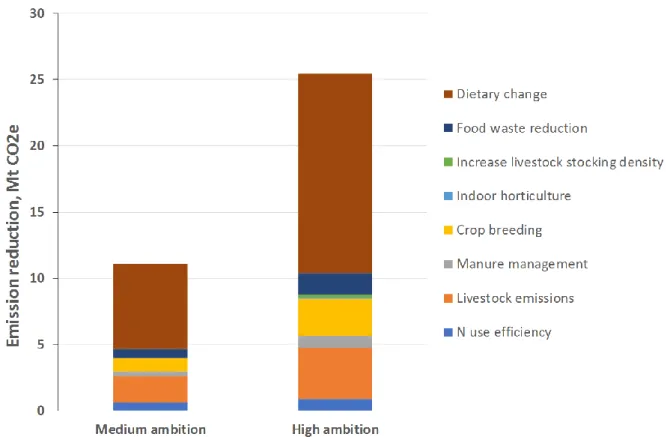
Although a very intensive sector, horticulture represents a very small proportion of the total area of cultivated agricultural land, N fertilizer use and GHG emissions from UK agriculture, so the impacts of this measure were small with a reduction of fertilizer N use of 1.0% and a reduction in total GHG emissions from UK agriculture of 0.2% for the High scenario by 2050 compared to BAU (Table 7). Measures to change human diet resulted in the largest reduction in GHG emissions from UK agriculture, by 37% under the High scenario by 2050 compared to BAU (Table 10).
Forestry
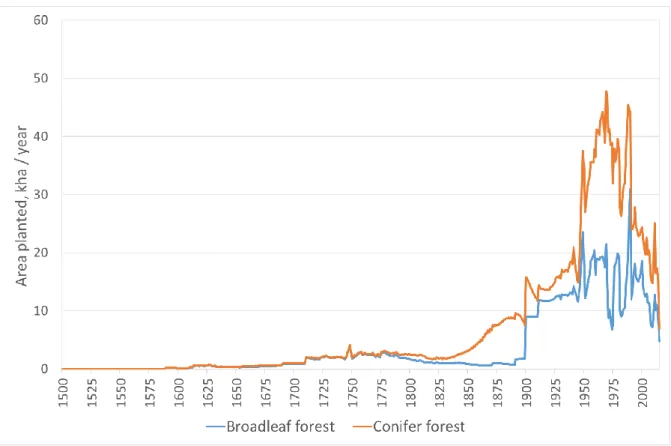
Although CFlow has been used in the past to calculate changes in forestry carbon stocks for the LULUCF GHG Inventory, the CARBINE model has been used for this purpose since the 1990-2012 submission7 (Forestry Research) (Matthews et al., 2014). In the GHG stock projections to 2050 (Thomson et al. 2017), the annual variation is smoothed by using a wider range of species and management regimes with different thinning and harvesting patterns. Forest managed for fuel makes a greater contribution to the net sink in the Medium ambition than in the High ambition.
In the Medium ambition size, 35% of the harvested deciduous forest and 85% of the harvested coniferous trees are used for wood products and the rest for fuel. In the High ambition measure, 75% of the harvested hardwood and 85% of the harvested conifers are used for wood products and the rest as fuel.
Bioenergy crops
For this project, it is assumed that there is no change in soil carbon stocks under Miscanthus. The average standing biomass carbon used in the modeling is 9.97 t C/ha (uncertainty 2.48 t C/ha) for both above- and below-ground biomass (Moxley et al., 2014). In the Medium ambition measure, this was assumed to increase to 15 t/ha in 2050 due to good agronomy and plant breeding, and to 20 t/ha in the high ambition target due to innovative agronomy and improved breeding including genetic modification, as decided by the stakeholder workshop.
KKO may be a broadleaf species, but the biomass carbon stock used in the modeling was based on willow KKO in the UK with an average standing biomass (above and below ground) of 4.36 tC/ha (uncertainty 2.9 t C/ha) (Moxley). et al., 2014). In the medium-ambitious scenario, this was assumed to increase to 15 t/ha by 2050 due to good agronomy and plant breeding, and to 20 t/ha in the high-ambitious measure due to innovative agronomy and improved husbandry, including genetic modification, as was decided at a stakeholder workshop.
Peatland restoration and rewetting
Rejuvenation of peatlands occurs on 50% of intensively managed lowland peatland (improved cropland and pasture) and peatland restoration occurs on 75% of unimproved degraded grassland and 50% of peatland forests (deforestation) with less than Yield Class 8 by 2050. Land emissions from peatland forests are modeled within CFlow and included in Forestry emissions. The area of low-yield woodland (below yield class 8) for Great Britain was calculated by overlaying the Forestry Commission's subdivision database with the peat extent maps produced in the Wetlands Supplement project (giving the extent of low-yielding publicly owned peatlands), and scaling this to include privately owned forests assuming it is in the same proportion as publicly owned forests.
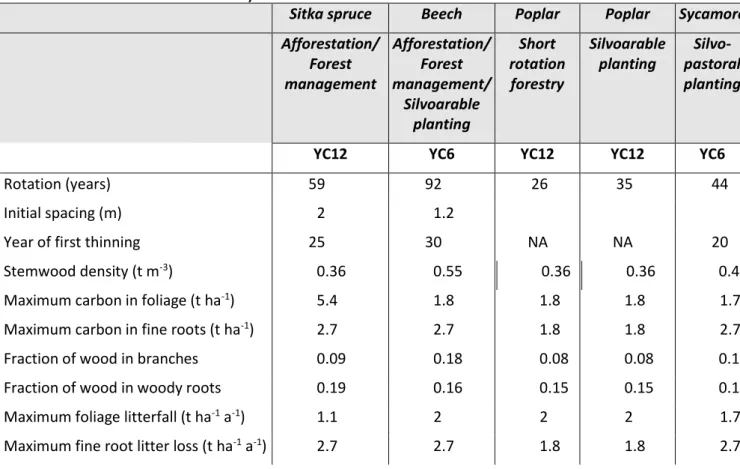
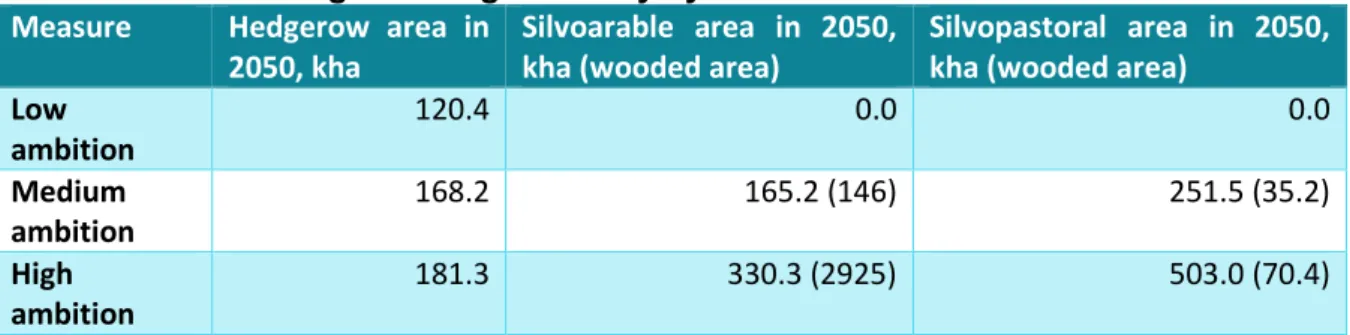
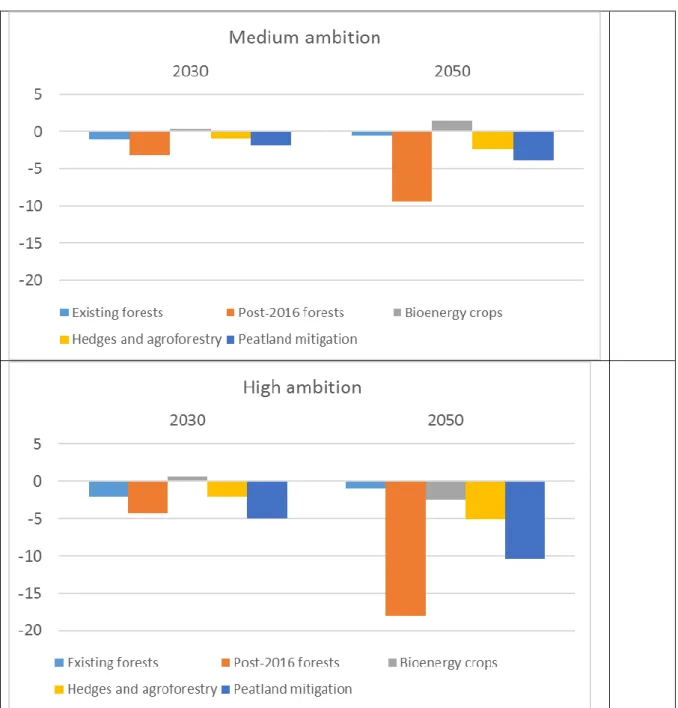
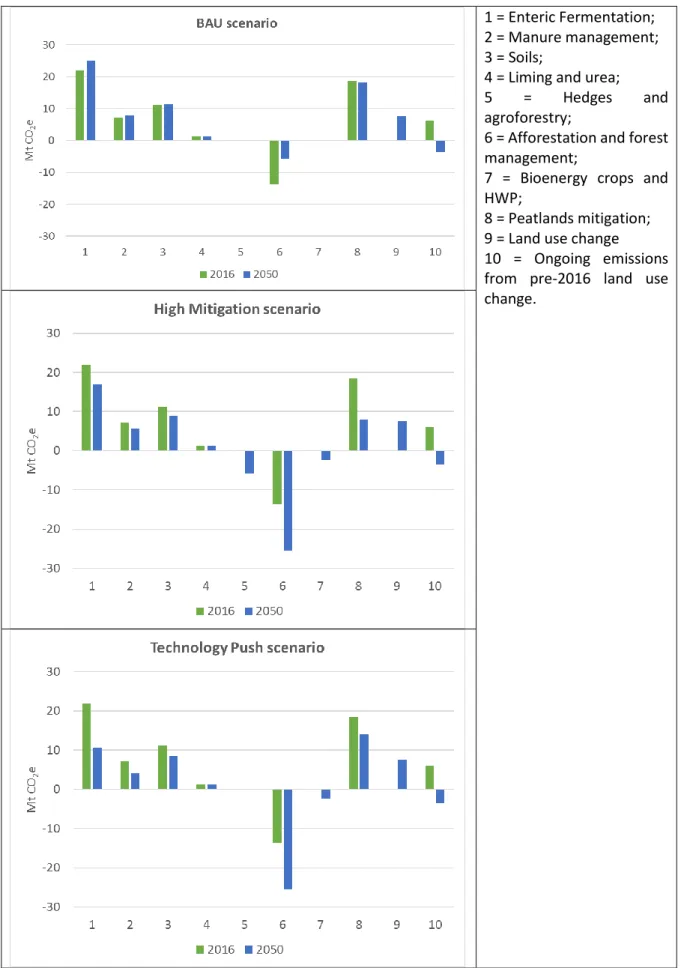
Northern Ireland is not covered by the subcompartment database, so planted area after 1980 was used as in the Wetlands Supplement Stretch projection scenario. Area of forest It is assumed that 10% of permanent grassland in each country (taking into account other land use changes) will be converted to forest pastoral systems by 2050 (Table 23). A plane/birch/ash (SAB) yield class 6 (Table 11), representative of medium to fast growing broadleaf species, is used, with a planting density of 400 trees/ha, as this appears to be widely used in the current UK experiments /subsidies (e.g. the FC grant for small woodlands on sheep pastures in Scotland). Changes in carbon stock are modeled by CFlow, with planting density adjusted based on the initial planting rate of 2918 trees/ha (adjusted so that the planted area in CFlow is 14% of 10%). The carbon stock changes in the wood component in the silvoarable and silvopastoral systems are modeled with C-Flow (table 24). The difference between the silvoarable and the silvopastoral wash is due to: arable land is planted with more productive tree species in England, which produce higher biomass carbon stocks (and more additions to litter and soil stocks); and conversion to grassland reduces soil carbon stocks in the first years after planting, whereas conversion to arable land produces larger and faster soil. The amount of fuel produced from hedgerow management and forestry systems is shown in Table 25. 1 Silvopastoral starts producing fuel from 2061, but there is a gap in production between 2095 and 2100 due to the rotation length. The emissions associated with the land use reduction measures under the medium and high ambitions and the baseline emissions with low ambitions are compared in Figure 6. The bioenergy crop measures actually slightly increase greenhouse gas emissions compared to the low ambition level of zero emissions, because the carbon emissions losses associated with soil disturbance in the conversion to bioenergy crops offset the gains from biomass growth. This does not take into account the production of bioenergy fuel, which can be used to replace fossil fuels at a significantly lower level of GHG emission. A comparison of average emissions per unit area (Table 27) shows that newly planted forests (after 2016) make the greatest contribution to reducing emissions per unit area. A widespread increase in active management (as well as an increase in forest cover) would also require an increase in the skilled workforce. A synthesis of the impact of land use change on biomass energy crops (Holland et al., 2015) suggested positive effects on water quality, soil quality, pollination, disease and pest control and risk regulation for crops planted on cropland and grassland, but negative effects. consequences for the availability of water on arable land. 2017) found similar positive effects for Miscanthus in Great Britain. Bioenergy crops for biomass fuel currently cover only a very small proportion of arable land in Britain (<1%). Despite subsidy schemes and other incentives, there has been virtually no increase in the area of Miscanthus or SRC grown in England since 2009 (Defra 2017). However, these measures can be implemented rapidly, and the impact on both fuel production and greenhouse gas mitigation would be evident in the short term (< 5 years). The CCC wanted to investigate a range of "what if" land use change/agricultural scenarios by combining mitigation options at different levels of ambition. The overall aim is to support decision-making across the entire land use sector. The amounts of land saved and required are roughly balanced in both the high mitigation uptake and multifunctional land use scenarios, although the high mitigation uptake scenario has a small deficit in the amount of patchy grazing land required and the multifunctional land use scenario has a small lack of cultivated land. Some types of land use are also under more pressure in some countries: e.g. is patchy grassland in high demand in Scotland for afforestation and peatland mitigation, and there is also a shortage of permanent grassland in England in the high mitigation uptake scenarios. In the case of small shortfalls, the amount of land saved relative to what is needed can be balanced by moving mitigation options between categories of agricultural land use (e.g. from permanent to temporary grassland) or reducing the mitigation area in some countries and increasing it in others. There is an increase in land use change emissions between the BAU/Maximum Food scenarios and the higher ambition scenarios: this is due to land emissions when there is conversion from grassland to cultivated land for bioenergy, as the emissions from conversion to developed land are the same. in both scenarios. Overall (excluding ongoing emissions from historical land use change), greenhouse gas emissions from the BAU and Maximum Food Production scenarios increase by 40-41% between 2016 and 2050, while emissions from the other scenarios all show a large reduction: 21% for the multifunctional scenario land use, 61% for technology push and 69% for high mitigation uptake. The relative contribution of agricultural mitigation measures and land-based mitigation measures (excluding urban expansion and ongoing emissions from pre-2016 LUC, which total 4.0 Mt CO2e in 2050) can be seen in Table 31. Fuel and HWP production The measures were grouped into five scenarios to investigate possible future land use in the UK. Restoring rivers in the UK: meeting the twin needs of the European Union's Water Framework Directive and flood defence. Capturing the effect of cropland and grassland management on biomass carbon stocks in the UK LULUCF inventory. A spatial modeling tool for predicting soil greenhouse gas changes from land conversion to bioenergy in the UK. High-resolution spatial modeling of greenhouse gas emissions from land-use change for energy crops in the UK. Workshop attendees Agricultural land use in 2016 England: Summary Scotland: Summary Wales: Summary Northern Ireland: Summary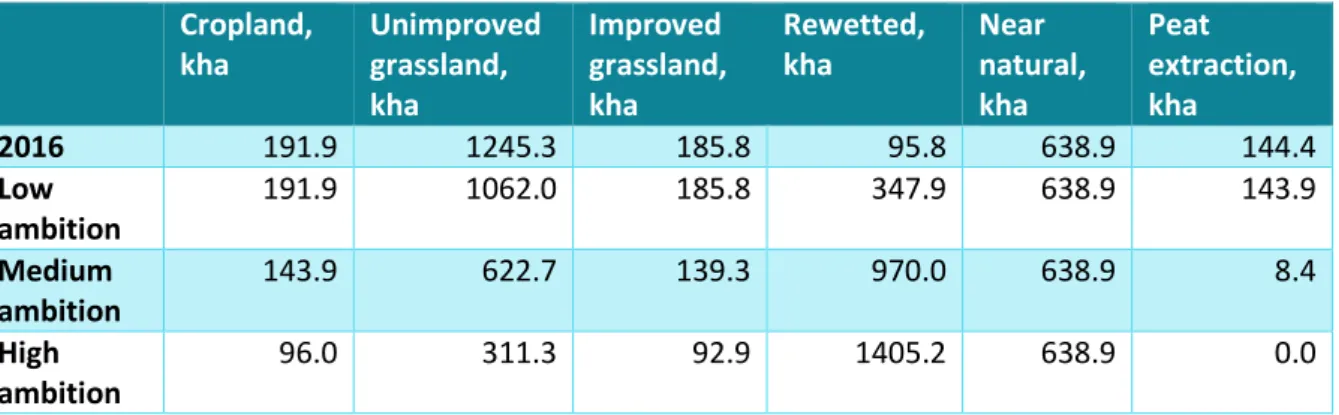
Hedgerows and agroforestry
Other land use change
Comparison of mitigation measures
Co-benefits and barriers to implementation
Land requirements and land sparing
Combined scenario greenhouse gas emissions
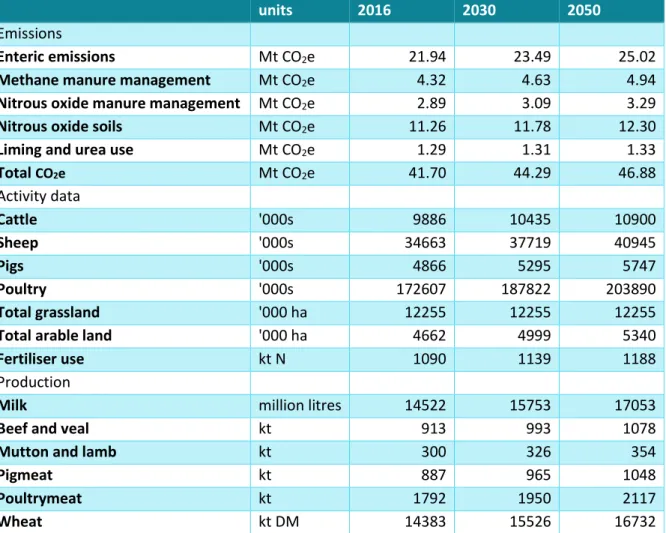
Agricultural production