As many smallholder farmers in developing countries live on the edge of food insecurity, a reduction in food losses can have an immediate and significant impact on their livelihoods. The causes of food losses and waste in middle/high income countries are mainly related to consumer behavior as well as the lack of coordination between different actors in the supply chain. As many smallholders live on the edge of food insecurity, a reduction in food loss can have an immediate and significant impact on their livelihoods.
How much food is lost and wasted in the world today and how can we prevent food loss. The Swedish Institute for Food and Biotechnology (SIK) has reconstructed mass flows of food intended for human consumption, from production to consumption, using available data, to quantify food loss and waste. Food loss refers to the decrease in edible food mass throughout the part of the supply chain that specifically leads to edible food for human consumption.
Food losses occur at the production, post-harvest and processing stages in the food supply chain (Parfitt et al., 2010). Food losses that occur at the end of the food chain (retail and final consumption) are rather called "food waste", which is related to the behavior of retailers and consumers. By definition, food loss or waste is the amount of food lost or wasted in the part of the food chain that leads to "edible products intended for human consumption".
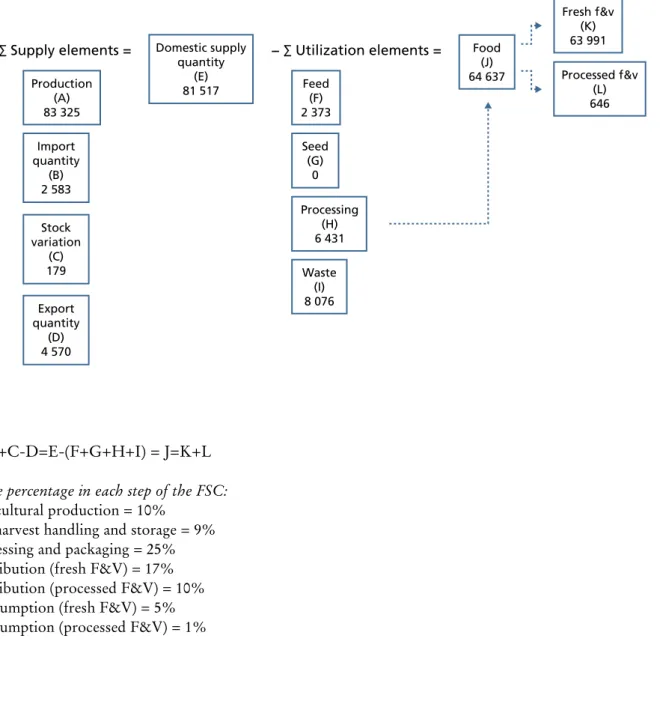
For each commodity group, a mass flow model was used to account for food loss and waste at each stage of the commodity's FSC.
Extent of food losses and waste
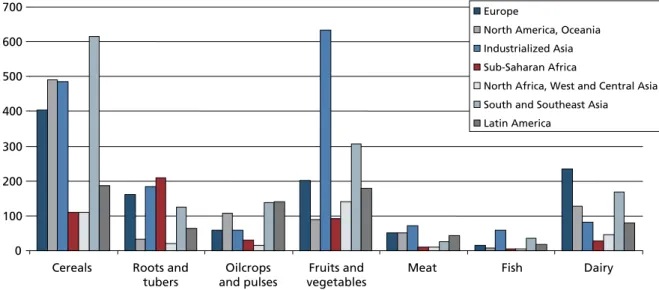
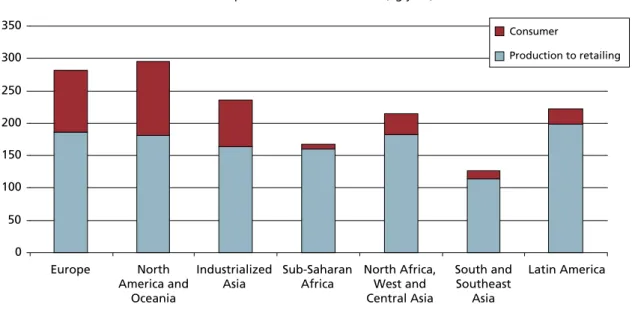
FOOD VOluMES PRODuCED
ExtEnt OF FOOD lOSSES AnD wAStE
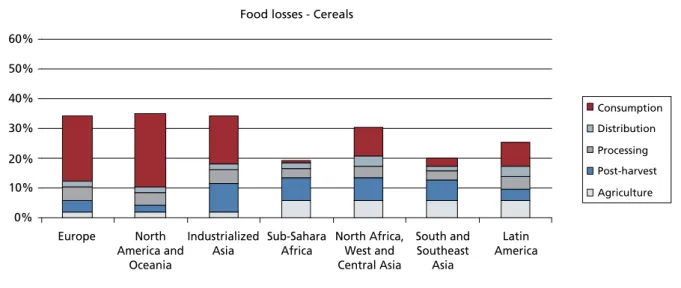
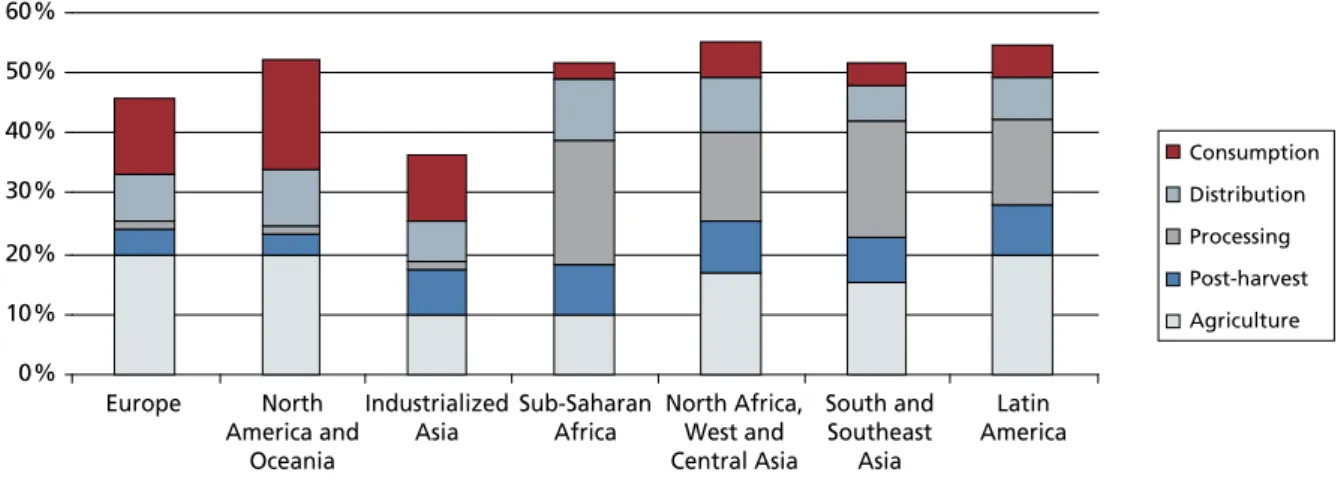
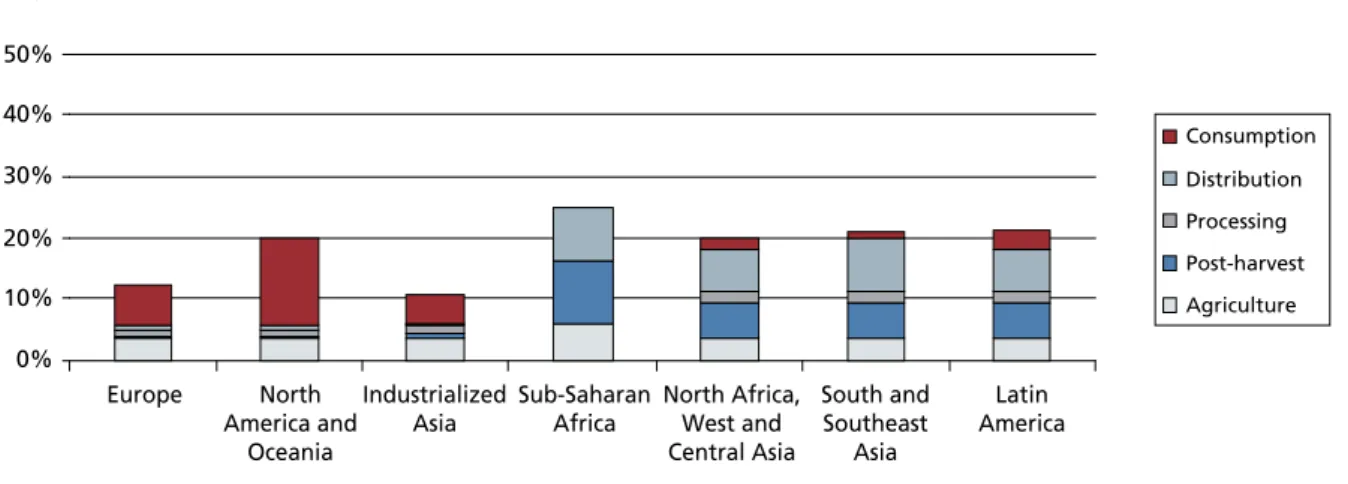
Food losses in industrialized countries are as high as in developing countries, but in developing countries more than 40% of food losses occur at post-harvest and processing levels, while in industrialized countries more than 40% of food losses occur at retail. and consumer levels. The graphs of the seven commodity groups below show the percentage of food losses and waste of the edible parts of food products produced for human consumption. For these regions, agricultural production and post-harvest handling and storage are stages in the FSC with relatively high food losses, in contrast to the distribution and consumption levels.
In the group of roots and tubers (Figure 4), potato (sweet potato in China) is the dominant crop supply in middle- and high-income countries. Incorporates food loss and waste at consumption and pre-consumption stages in different regions. Part of the original production is lost or wasted, at different FSC stages, for cereals in different regions.
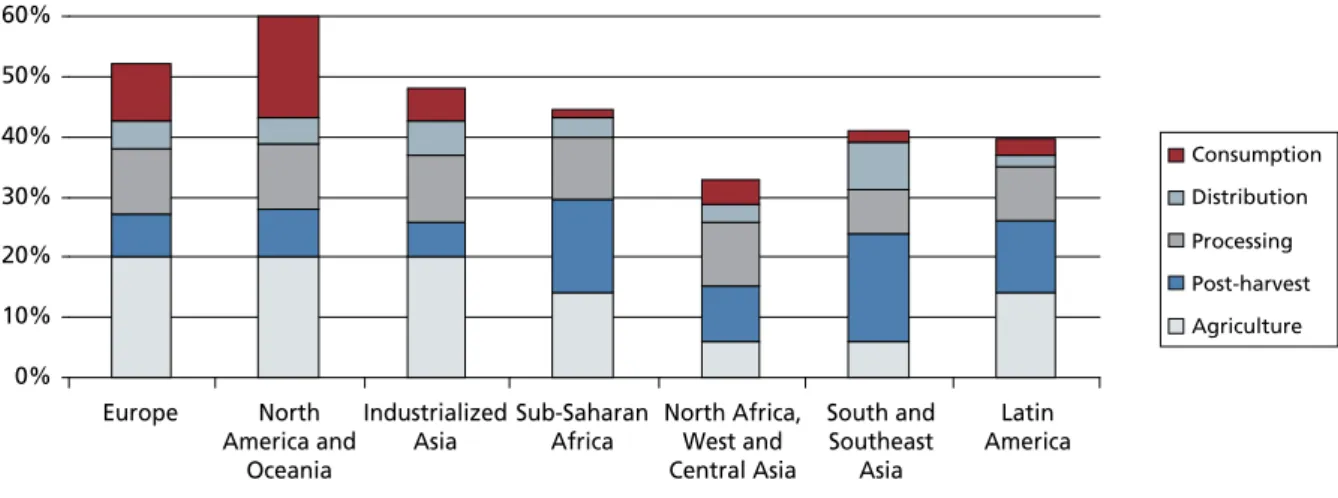
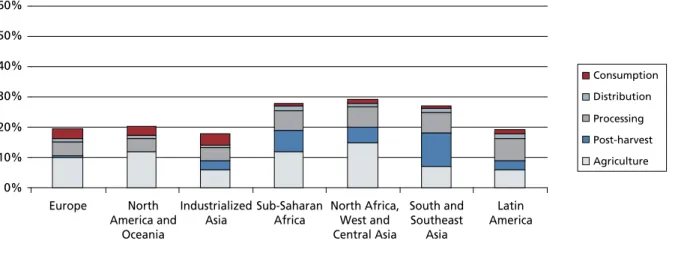
Part of the original production lost or wasted at different stages of FSC for root and tuber crops in different regions. Waste at the end of the FSC is also significant in all three regions at 15-30%. Portion of original production lost or wasted at different stages of FSC for oilseeds and pulses in different regions.
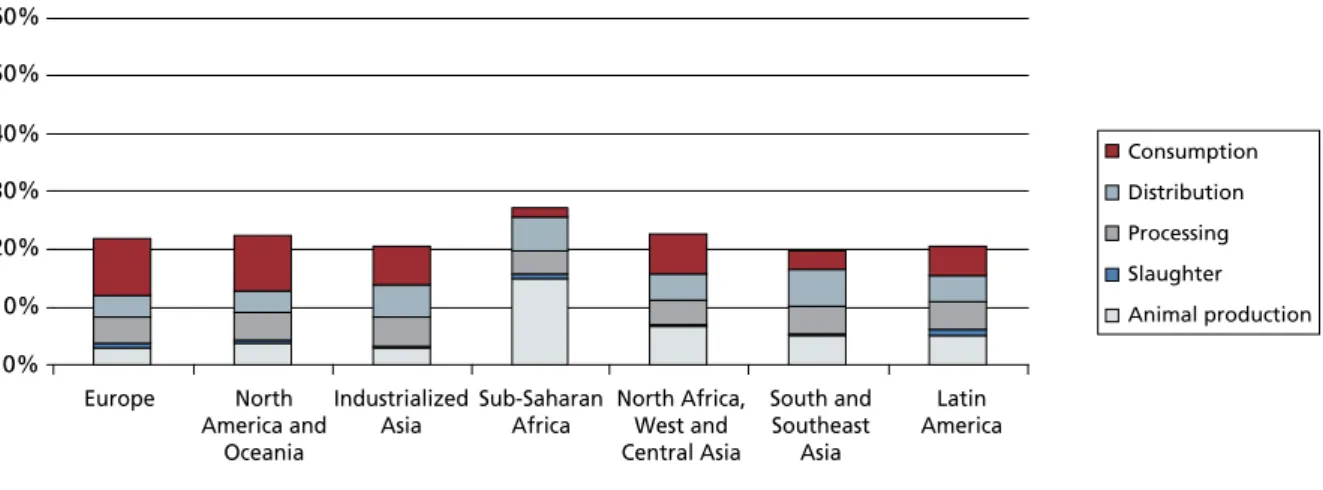
Part of the initial production was lost or lost at different FSC levels for fruits and vegetables in different regions. In the case of meat and meat products (Figure 7): losses and waste in industrialized regions are worst at the end of the FSC, which is explained by the high consumption of meat per capita combined with high proportions of waste by retailers and consumers, especially in Europe. and the USA. Part of the initial production is lost or wasted for meat products at different FSC levels in different regions.
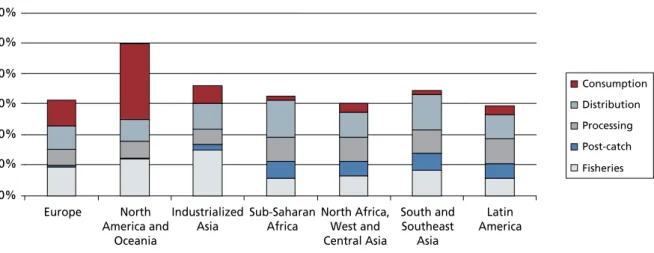
Part of the initial catch (caught fish and seafood) was discarded, lost and wasted in different regions and at different FSC levels. Discards, the proportion of the total catch that is returned to the sea (mostly dead, dying or severely damaged), represent a significant part of the world's marine catch and are generally seen as a wasteful misuse of marine resources. A fraction of the initial production of milk and milk products was lost or lost for each region at different FSC levels.
Causes and prevention of food losses and waste
This could be done by questioning them and offering them a wider range of quality products in retail stores. Poor storage facilities and lack of infrastructure cause post-harvest food losses in developing countries. Failure to comply with minimum food safety standards can result in food losses and, in extreme cases, affect the country's food security situation.
Prevention: develop knowledge and capacity of food chain operators to apply safe food handling practices. Proper storage facilities are also important to reduce the amount of food lost during post-harvest handling and storage. Disposal is cheaper than use or reuse's attitude in industrialized countries leads to food waste.
Snapshot example: disposal is cheaper than use or reuse of French fries production in the Netherlands. Somsen interviewed a Dutch French fries manufacturer to better understand the causes of food waste in the French fries production line (Somsen, 2004). The large quantities displayed and the wide range of products/brands on offer cause food waste in industrialized countries.
Retail stores must order a variety of food types and brands from the same manufacturer to obtain advantageous prices. The marketing cooperatives should be able to reduce food losses by increasing the efficiency of these activities. A contributing factor is that consumers in developing countries generally buy smaller quantities of food at that time, often just enough for meals on the day of purchase.
Perhaps one of the most important reasons for food waste at the consumption level in rich countries is that people can simply afford to waste food. Education about these issues in schools and political initiatives are possible starting points to change people's attitude towards the current massive food waste. WRAP focuses on reducing packaging waste and consumer food waste through R&D work, best practice guidance and promotion.
Conclusions
Further reading
- Grouping of world regions
- Commodity groups
- Additional references for quantifying food losses/waste
- weight percentages of food losses and waste (in percentage
- Example of calculations of food losses and waste
Post-harvest losses in artisanal fisheries, available at: http://www.fao.org/focus/e/fisheries/proc.htm FAO. Publications on statistical methods and standards: Crop statistics – concepts, definitions and classifications, available at: http://www.fao.org/economic/ess/methodology/methodology-systems/. Definitions and classifications, available at: http://www.fao.org/economic/ess/methodology/methodology- systems/crops-statistics-concepts-definitions-and-classifications/en/.
Postharvest losses of fruits and vegetables in Asia, available at: http://www.agnet.org/library/ac/1993d/. How to Grow Heritage Turkeys on Pasture: Chapter 3, available at: http://www.albc-usa.org/documents/turkeymanual/ALBCturkey-3.pdf Guajardo, J. Estimates of post-harvest weight loss for grain supply calculations in East and Southern Africa, available at: http://www.phlosses.net/downloads/Postharvest-losses-report.pdf.
The Humane Society of the United States, available at: http://www.humanesociety.org/assets/pdfs/farm/HSUS-Report-on-Turkey-Welfare.pdf Huq, R. Cornell University, available at: http: //cwmi.css.cornell.edu/On%20Site%20Composting%20of%20Meat%20 By%20Products.pdf. The State of Meat Production in Developing Countries: 2002, available at: http://www.humanesociety.org/assets/pdfs/hsp/soa_ii_chap12.pdf Tröger, K., Hensel, O.
Trends in Europe and North America - Economic Commission for Europe Statistical Yearbook 2005. Natural Resources Institute, University of Greenwich, Kent, available at: http://www.researchintouse.com/nrk/RIUinfo/outputs/R7497_a.pdf . Main Report, Defra Research Project IS0205, Bedford, Cranfield University and Defra, available at: www.silsoe.cranfield.ac.uk and www.defra.gov.uk Wirsenius, S., Azar, C., Berndes, G.
Estimated/assumed waste rates for each commodity group at each step of the FSC for Europe incl. Estimated/assumed waste rates for each product group at each step of the FSC for industrialized Asia. Estimated/assumed waste rates for each commodity group in each step of the FSC for sub-Saharan Africa.
Estimated/predicted waste percentages for each commodity group at each FSC step for South and Southeast Asia. Estimated/assumed waste percentages for each commodity group at each FSC step for Latin America.