MONITORANDO INFORMAÇÕES NAS MÍDIAS
TIAGO RODRIGUES DE MAGALHÃES
MONITORANDO INFORMAÇÕES NAS MÍDIAS
SOCIAIS ONLINE
Dissertação apresentada ao Programa de Pós-Graduação em Ciência da Computação do Instituto de Ciências Exatas da Univer-sidade Federal de Minas Gerais como re-quisito parcial para a obtenção do grau de Mestre em Ciência da Computação.
Orientador: Virgílio Augusto Fernandes de Almeida
Co-Orientador: Ponnurangam Kumaraguru
Belo Horizonte
TIAGO RODRIGUES DE MAGALHÃES
MONITORING INFORMATION IN THE ONLINE
SOCIAL MEDIA SPHERE
Dissertation presented to the Graduate Program in Ciência da Computação of the Universidade Federal de Minas Gerais in partial fulfillment of the requirements for the degree of Master in Ciência da Com-putação.
Advisor: Virgílio Augusto Fernandes de Almeida
Co-Advisor: Ponnurangam Kumaraguru
Belo Horizonte
c
2012, Tiago Rodrigues de Magalhães. Todos os direitos reservados.
Magalhães, Tiago Rodrigues de
M188m Monitoring Information in the Online Social Media Sphere / Tiago Rodrigues de Magalhães. — Belo Horizonte, 2012
xxvi, 70 f. : il. ; 29cm
Dissertação (mestrado) — Universidade Federal de Minas Gerais
Orientador: Virgílio Augusto Fernandes de Almeida
Co-Orientador: Ponnurangam Kumaraguru
1. information diffusion. 2. online social media. 3. tracking. I. Título.
Dedico este trabalho a todos os leitores. Espero que seja útil e contribua para o avanço da ciência e para o desenvolvimento de novas tecnologias e serviços, facilitando a vida de algumas pessoas.
Acknowledgments
Gostaria de agradecer a todos que me ajudaram durante estes 2 anos no mestrado. A todos os funcionários das instituições que visitei (Max Planck Institute for Software Systems - Saarbrücken - Alemanha, Indraprastha Institute of Information Technology - Delhi - India, e Indian Institute of Science - Bangalore, India). Aos responsáveis diretos por idealizarem estas visitas (orientadores, funcionários, secretaria do DCC-UFMG, pesquisadores com quem trabalhei), pois sem eles nada teria acontecido. Foram momentos e experiências inesquecíveis em lugares que jamais imaginei estar algum dia. A todos os amigos do CAMPS, pelos bons momentos passados e pelo aprendizado adquirido desde a iniciação científica, no segundo semestre de 2007. A todos com quem trabalhei diretamente durante o mestrado (orientadores, co-autores), pelo apoio, aprendizado e contribuição durante todo o trabalho desenvolvido. A toda minha família pelo apoio, mesmo que alguns não fizessem idéia do que estava estudando ou porque passei mais 2 anos na universidade depois de ter me formado. Não poderia me esquecer daqueles que me deram suporte financeiro: pais, CAPES, MPI-SWS.
Preferi não citar nomes para não esquecer de ninguém e cometer injustiça, mas tenho certeza de que quem leu esta seção e se identificou teve um papel importante na minha jornada.
“O caminho batido não leva a novas pastagens” (Indira Ghandi)
Resumo
As mídias sociais online (blogs, redes sociais) são ferramentas de comunicação cada vez mais presentes e importantes no mundo moderno. Tradicionalmente, as pessoas encontram informações na Web navegando ou buscando. Com o recente sucesso das mídias sociais online, as pessoas passaram a receber novas informações através de conversas com seus amigos. Uma quantidade enorme e diversa de informação é gerada diariamente por milhões de pessoas em todo o mundo. Por exemplo, através do Twitter os usuários compartilham e repassam diversas informações; pelo Facebook os usuários ficam sabendo sobre o que os amigos fizeram no último fim de semana; e pelo Foursquare descobrem onde estiveram recentemente. O grande volume de dados, a diversidade de informação, a dinâmica dos sistemas, e a necessidade de informações em tempo real levam a grandes desafios para se processar e analisar os dados gerados pelos usuários. Entretanto, um melhor entendimento sobre o processo de difusão de informação nas mídias sociais online é necessário, não apenas para os usuários, mas também para empresas e pesquisadores. Exploração de propagandas, melhor organização de conteúdo e criação de novas ferramentas são exemplos de benefícios possíveis através de um melhor estudo do problema. Neste trabalho propomos o MIOSphere, um sistema para monitoramento, em tempo real, da propagação de informação por importantes mídias sociais online. Além disso, foi feita uma ampla caracterização da propagação de URLs no Twitter, analisando não somente a propagação interna, mas também como URLs geradas em outras mídias sociais (vídeos do YouTube, por exemplo) se propagam no Twitter.
Palavras-chave: mídias sociais online, difusão de informacão, boca-a-boca, monitora-mento.
Abstract
Online Social Media services (blogs, social networks) are important communication tools in the modern world. Traditionally, people find information in the Web by brows-ing or searchbrows-ing. With the recent success of Online Social Media, people started to receive information from conversations with their friends. A huge and diverse amount of information is generated everyday by millions of people all over the world. As an example, on Twitter users share and forward various information; on Facebook, users get to know about what their friends did on the last weekend; and on Fourquare users discover where their friends visited recently. The huge volume of data, the diversity of information, the dynamic of the systems, and the need for real-time information leads to big challenges while processing and analyzing the user generated data from Online Social Media services. However, a better understanding about the information diffusion process in Online Social Media services is necessary, not only for users, but also for companies and researchers. Advertising, better content organization, and cre-ation of new tools are examples of possible benefits from a better understanding of the problem. In this work we propose MIOSphere, a system to monitor, in real-time, the diffusion of information through popular Online Social Media services. Furthermore, a wide characterization of the diffusion of URLs on Twitter was done, analyzing not only the internal diffusion, but also how URLs generated in external services (YouTube videos, for example) diffuses on Twitter.
Keywords: online social media, information diffusion, word-of-mouth, monitoring.
List of Figures
1.1 High level view of MIOSphere’s architecture . . . 3
2.1 Basics: dynamics of Online Social Media Sphere . . . 6
2.2 Basics: modeling information cascades terminology . . . 8
4.1 Word-of-mouth: URLs on Twitter over time . . . 15
4.2 Word-of-mouth: popular domains . . . 18
4.3 Word-of-mouth: audience size . . . 19
4.4 Word-of-mouth: the size of word-of-mouth . . . 22
4.5 Word-of-mouth: the number of initiators per URL . . . 23
4.6 Word-of-mouth: role of initiators . . . 24
4.7 Word-of-mouth: the shape of word-of-mouth . . . 25
4.8 Word-of-mouth: cascade size distributions . . . 26
4.9 Word-of-mouth: size per content type . . . 27
4.10 Word-of-mouth: physical distance of friendship and propagation links . . . 28
4.11 Word-of-mouth: locality across content types . . . 29
4.12 Word-of-mouth: distance between initiators and spreaders . . . 30
5.1 Cross-Pollination: data collection framework . . . 32
5.2 Cross-Pollination: meme creation over time . . . 34
5.3 Cross-Pollination: user participation . . . 35
5.4 Cross-Pollination: diffusion delay . . . 36
5.5 Cross-Pollination: cascade size . . . 36
6.1 MIOSphere: architecture and workflow . . . 42
6.2 MIOSphere: tweets collected versus total number of tweets . . . 51
6.3 MIOSphere: snapshot of interface - home page . . . 55
6.4 MIOSphere: snapshot of interface - memes page . . . 55
6.5 MIOSphere: snapshot of interface - meme detail page . . . 56
6.6 MIOSphere: snapshot of interface - about page . . . 57 6.7 MIOSphere: top 5 URLs collected . . . 58
List of Tables
4.1 Word-of-mouth: statistics of the datasets . . . 15
4.2 Word-of-mouth: top 10 URL shortening services . . . 16
4.3 Word-of-mouth: top 5 domains . . . 17
4.4 Word-of-mouth: categories of URLs . . . 20
4.5 Word-of-mouth: top 10 URLs . . . 21
5.1 Cross-Pollination: statistics of the datasets . . . 33
5.2 Cross-Pollination: information cascade statistics . . . 37
6.1 MIOSphere: traces for the simulations . . . 46
6.2 MIOSphere: dead threshold results for MPQ scheduler . . . 50
6.3 MIOSphere: dead threshold results for baseline scheduler . . . 50
6.4 MIOSphere: waiting time queue results . . . 51
6.5 MIOSphere: importance sliding window size results . . . 52
6.6 MIOSphere: number of priority queues and thresholds results . . . 53
Contents
Acknowledgments xi
Resumo xv
Abstract xvii
List of Figures xix
List of Tables xxi
1 Introduction 1
1.1 Context . . . 2 1.2 Purpose . . . 2 1.3 Solution . . . 3 1.4 Organization . . . 4
2 Basics of Online Social Media and Definitions 5
2.1 Online Social Media Sphere . . . 5 2.1.1 Cross-Pollination of Information . . . 6 2.2 Modeling Information Cascades . . . 7 2.2.1 Hierarchical Tree Model . . . 7
3 Literature Review 9
3.1 Information Diffusion in OSM Services . . . 9 3.2 Information Diffusion Across OSM Services . . . 10 3.3 Tools and Applications for OSM Services . . . 11 3.4 Information Retrieval . . . 12
4 On Word-of-Mouth Based Discovery of the Web 13
4.1 Methodology . . . 13
4.1.1 The Twitter Dataset . . . 13 4.1.2 URLs in Tweets . . . 14 4.2 Which Content is Popular? . . . 15 4.2.1 URL Shortening Services . . . 16 4.2.2 Popularly Linked Web Domains . . . 17 4.2.3 Popular Individual URLs . . . 18 4.2.4 Content Types . . . 19 4.3 The Shape of Word-of-mouth . . . 21 4.3.1 How Large is the Largest Word-of-mouth? . . . 21 4.3.2 The Role of Initiators . . . 22 4.3.3 The Shape of Word-of-mouth . . . 24 4.4 Content Distribution . . . 26 4.4.1 Content Producers and Consumers . . . 27
5 Cross-Pollination of Information in Online Social Media: a Case
Study on Popular Social Networks 31
5.1 Methodology . . . 31 5.1.1 Data Collection . . . 31 5.1.2 Datasets . . . 32 5.2 Cross-Pollination Characteristics . . . 33 5.2.1 Sharing Activity . . . 33 5.2.2 User Participation . . . 34 5.2.3 Diffusion Delay . . . 34 5.2.4 Information Cascades . . . 35 5.3 Relationship Between OSM Services in a Cross-Pollinated Network . . 37
6 Developing a System to Monitor Information in Online Social Media 39
6.1 Lessons Learned . . . 39 6.2 Architecture . . . 41 6.2.1 Scheduler . . . 43 6.2.2 Algorithm . . . 44 6.3 Simulations . . . 46 6.3.1 Traces . . . 46 6.3.2 Assumptions . . . 47 6.3.3 Evaluation Metrics . . . 47 6.3.4 Parameters . . . 48 6.3.5 Analysis . . . 49
6.3.6 Discussion . . . 53 6.4 Prototype . . . 54 6.4.1 Collected Data . . . 57
7 Conclusions and Future Work 61
7.1 Main Contributions . . . 61 7.2 Future Work . . . 62 7.3 Limitations . . . 62
Bibliography 63
Chapter 1
Introduction
Recently, Online Social Media (OSM) services (i.e., blogs, social networks) have emerged as a popular way of discovering information on the World Wide Web. In contrast to traditional methods of content discovery such as browsing or searching, con-tent sharing in OSM services occurs via conversations between users, which is known as word-of-mouth. For instance, users share links with personal recommendations like “Check out this great photo of the concert last night!”
While such word-of-mouth based content discovery existed long before in the form of emails and web forums, OSM services have made this phenomenon extremely popular and globally reaching. In fact, today social networking sites are known to be a major driver of traffic to many Web sites [Campbell, 2009]. For certain Web sites, Facebook and Twitter drive, respectively, 44% and 29% of the traffic [Schonfeld, 2010]. These OSM sites are sharing tens of millions of Web links every day, and the amount of information exchanged by word-of-mouth in OSM services is expected to grow over time [Rao, 2010].
With users having accounts in different OSM services, there is a tendency to exchange information across OSM services [Broxton et al., 2010]. Users usually post URLs on Twitter and Facebook to announce to their friends about a new blog post or a new uploaded video (on YouTube). Studying the dynamics and characteristics of this information diffusion process across OSM services is important for various reasons, like help marketers to explore the rich environment for advertisement purposes, as well as help social media providers to improve their systems and develop tools to facilitate the information exchange across networks.
2 Chapter 1. Introduction
1.1
Context
Recently, researchers contributed significantly in understanding several aspects of OSM services, including diffusion of information. Blogs [Leskovec et al., 2007b], YouTube [Cha et al., 2007], Facebook [Nazir et al., 2008], and Digg [Szabo and Huber-man, 2010] are some of the OSM services which have been extensively studied. Most of these studies are focused in only one OSM service or in one specific aspect of interest, like understanding temporal and topological patterns, or the interplay between the so-cial network structure and the information flow. Some researchers developed tools to visualize and analyze the diffusion of information in OSM services, but these tools are usually based on only one OSM service or in some specific memes1
related to specific themes (for example, politics and rumors) [Leskovec et al., 2009; Truthy, 2012].
Popular OSM services (e.g., Facebook and Twitter) are characterized by a highly dynamic environment, with a huge volume of traffic generated everyday by the sharing of several types of content (i.e., photos, videos, news), as well as by the increasing interest of users in real-time information. Each unit of information (a meme, like URLs or keywords) has a different life cycle in these environments. For instance, while the majority of the Web links (URLs) are unpopular, a few of them became extremely popular, shared by millions of users. Moreover, some URLs attract interest at a single period in time and die quickly, while others are periodic and attract interest of users for a long period. A recent blog post showed that, on average, the time that a URL receive half of its clicks on Twitter is only 2.8 hours, and on Facebook is only 3.2 hours [Bit.ly, 2011].
1.2
Purpose
Service providers usually do not give users a good manner to track how the information they have shared is diffused among other users and services. Developing a system to track the diffusion of information in and across OSM services is certainly useful, not only for users, but also for companies and researchers. In this work, we propose
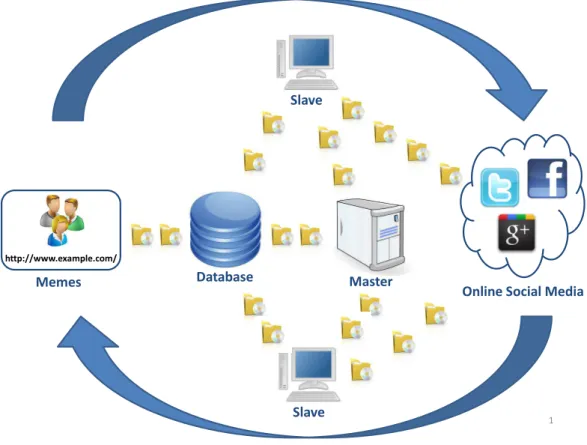
MIOSphere, a system to Monitor Information in the Online Social Media Sphere (i.e., blogosphere, social networks, content sharing systems). MIOSphere uses a distributed approach with a master controlling several slave machines to monitor the memes (i.e., URLs and users), as showed in Figure 1.1. The master is responsible for controlling and organizing the whole process. When slaves request information to track, the master
1
1.3. Solution 3
selects which memes should be collected at that time, in order to optimize the usage of resources.
1 http://www.example.com/
Memes
Online Social Media Master
Database
Slave
Slave
Figure 1.1. High level view of MIOSphere’s architecture
As a proof of concept, a prototype which monitors the diffusion of URLs in and across popular OSM services (Twitter, Facebook, and Google+) was implemented.
1.3
Solution
4 Chapter 1. Introduction
diffuses on Twitter and how is the relationship between the OSM services involved. Both works and the relevant findings for the development of MIOSphere are detailed in Chapters 4 and 5.
After this characterization step, MIOSphere was developed. Based on some find-ings discussed in Chapters 4 and 5, the architecture of the system was proposed. Any Web crawler has several limitations (bandwidth, overload of traffic in the downloaded Web servers, etc), so choosing the most important URLs to visit at a given time is extremely important for achieving a good performance, especially if the goal is a real-time system in a highly dynamic environment [Cho et al., 1998]. As a tool to help in the development of MIOSphere’s architecture, a trace-driven simulator was imple-mented and used, which was useful to understand the behavior of the parameters and how the performance of the system was affected. After running the simulations, a real prototype was implemented2
to validate the proposed architecture. This development step is detailed in Chapter 6.
1.4
Organization
This dissertation is organized as follows. Chapter 2 explains some basic concepts and the terminology used. Chapter 3 presents the literature review. In Chapters 4 and 5, a wide characterization about the diffusion of URLs in OSM services is showed. Then, in Chapter 6, MIOSphere’s architecture is explained in details. Finally, this dissertation is concluded in Chapter 7.
2
Chapter 2
Basics of Online Social Media and
Definitions
In this chapter, a discussion about some basic aspects of Online Social Media and an explanation of the terminology used in this dissertation is given.
2.1
Online Social Media Sphere
Several definitions for Online Social Media (OSM) can be found on the Web [Guide, 2012; Econsultancy, 2012]: (1) “Media is an instrument on communication, like a news-paper or a radio, so social media would be a social instrument of communication.” (2) “Social media essentially is a category of online media where people are talking, par-ticipating, sharing, networking, and bookmarking online.” (3) “A category of sites that is based on user participation and user-generated content. They include social networking sites like LinkedIn, Facebook, or My Space, social bookmarking sites like Del.icio.us, social news sites like Digg or Simpy, and other sites that are centered on user interaction.” (4) “ Digital word of mouth.” (5) “A term used to describe a variety of Web-based platforms, applications and technologies that enable people to socially interact with one another online.”
We refer to the entire environment around Online Social Media asOnline Social Media Sphere. Users, providers, technologies, applications, and services, for example, are all components of the Online Social Media Sphere. Among the services, there are social networking sites like Facebook and Google+; blogs and micro-blogging ser-vices like Blogger, Tumblr and Twitter; video, photo and music sharing serser-vices like YouTube, Flickr, and Last.fm; and geo-location services like Foursquare. Each of these Web applications are referred as OSM services.
6 Chapter 2. Basics of Online Social Media and Definitions
2.1.1
Cross-Pollination of Information
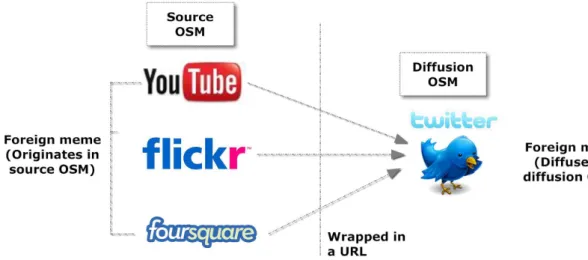
Information is exchanged among users inside an OSM service and between different OSM services. A basic unit of information is defined as ameme. A video on YouTube and a tweet on Twitter are the examples of memes. Memes can be divided into two categories: foreign and local. All posted URLs embedding meme belonging to another OSM service are defined as a foreign meme. URLs embedding YouTube videos or Flickr photos, when shared on Twitter, are examples of foreign memes. All other types of memes generated and diffused within one OSM service are local memes. Hashtags (term starting with # to represent the topic of the tweet, e.g., #BestDad) and mentions (internal link to another user in the form of @username) are examples of local memes on Twitter. Figure 2.1 illustrates the dynamics of exchange of memes from one OSM service to another one. OSM service where a foreign meme originates is termed as source OSM, and the OSM service in which the foreign meme diffuses is termed as diffusion OSM. Users create a meme in a source OSM, embed the meme in a URL and diffuse it on the diffusion OSM.
Figure 2.1. Dynamics of exchange of information in the Online Social Media Sphere
2.2. Modeling Information Cascades 7
termed as Cross-Pollinated network.
2.2
Modeling Information Cascades
Below, a description of the model of URL propagation is provided.
2.2.1
Hierarchical Tree Model
Information propagation paths are built based on Krackhardt’s hierarchical tree model [Hanneman and Riddle, 2005]. A hierarchical tree is a directed graph where all nodes are connected and all but one node, namely the root, have in-degree of one. This means that all nodes in the graph (except for the root) have a single parent. Hence, an edge from node Ato nodeB is added to the tree only whenB is not already a part of the tree. An edge from node A to node B means that a piece of information was passed from A to B. While each hierarchical tree has a single root, there may be multiple users who independently share the same URL. In this case, the propagation pattern of a single URL will contain multiple trees and form a forest.
While we assume there is only a single parent for any intermediate nodes, in real life there may be more than one source that passed the same piece of information to a given user. On Twitter, for example, more than 80% of the users who received an information from multiple sources cite their last source [Rodrigues et al., 2011]. This pattern might be attributed to the timeline interface of Twitter, which works as a stream, showing the last 200 tweets to the user, chronologically ordered. Facebook and Google+ also provide users a timeline interface. Hence, it is assumed that each user received a URL from the most recent source. This model is different from that proposed by Sun et al. [2009], where all friends who joined the same group on Facebook within the last 24 hours were considered as valid sources.
8 Chapter 2. Basics of Online Social Media and Definitions
publishes a URL after receiving it from a user B, but user A does not explicitly cite user B. In this case, we have to infer that the information passed from user B to user A. Both approaches were used in this dissertation.
Following the definitions proposed in Wang et al. [2011], all users in the root of a hierarchical tree are called initiators. These users are the ones who independently shared URLs. All other nodes who participated in URL propagation are called spread-ers. Initiators and spreaders make up the hierarchical tree. Users who simply received a URL but did not forward it to others are called receivers. Later when we refer to the hierarchical tree structure, we do not include these users. For convenience, we collectively call all three types of users who potentially read the URL as its audience. Figure 2.2 depicts this relationship.
Chapter 3
Literature Review
Information diffusion in OSM is a very active research area, with a rich set of work. There are several theoretical research work which attempt to model some aspects of the diffusion, and a lot of characterizations focused on a diversity of aspects and services. There are also proposals of tools and algorithms exploring information diffusion in OSM.
3.1
Information Diffusion in OSM Services
A rich set of theoretical work explains the interplay between the social network struc-ture and information flow. Granovetter [1978] proposed a linear threshold model, where someone will adopt an innovation only if a large enough proportion of his neighbors have previously adopted the same innovation. Dodds and Watts [2005] studied this model in the field of disease spreading in an epidemiological setting. Watts [2002] proposed a mathematical model of global cascades based on sparse Erdős-Rényi random networks and found that global-scale cascade could occur even with few early adopters. Watts examined the conditions for when such cascade happens under homogenous thresholds of user susceptibility. Karsai et al. [2010] followed the time evolution of information propagation in small-word networks and showed that the slowing down of spreading is found to be caused mainly by weight-topology correlations and the bursty activity patterns of individuals. Steeg et al. [2011] analyzed information cascades on Digg and concluded that the highly clustered structure of the Digg network limits the final size of cascades observed, as most people who are aware of a story have been exposed to it via multiple friends. Cha et al. [2012] studied information cascades on Flickr and found that popular photos do not spread as quickly as one might expect, but show a steady linear growth of popularity over several years. They concluded that burstiness
10 Chapter 3. Literature Review
of user login times and content aging can explain how the small-world network’s ability to spread information quickly and widely is affected.
Another set of work contributed significantly in understanding several aspects of OSM services, including diffusion of information. Sun et al. [2009] found long chains by studying cascades on Facebook pages, and also showed that these diffusion chains on Facebook are typically started by a substantial number of users. Gomez Rodriguez et al. [2010] investigated the problem of tracing paths of diffusion and influence and proposed an algorithm to decide a near-optimal set of directed edges that will maximize influence propagation. Ghosh and Lerman [2010] compared a number of influence met-rics over Digg data and suggested that a centrality-based measure is the best predictor of influence. Scellato et al. [2011] studied how geographic information extracted from social cascades can be exploited to improve caching of multimedia files in a Content Delivery Network (CDN). Their evaluation showed that cache hits can be improved with respect to cache policies without geographic and social information. Wang et al. [2011] found that social and organizational context significantly impacts to whom and how fast people forward information. Bakshy et al. [2009] studied content propagation in the context of the social network existent in Second Life, a multi-player virtual game. By examining cascade trees they find that the social network plays a significant role in the adoption of content.
Blogging and micro-blogging networks are shown to have temporal and topolog-ical patterns which largely exhibit power-law behavior [Leskovec et al., 2007b; Galuba et al., 2010; Kwak et al., 2010]. Krishnamurthy et al. [2008] presented a detailed char-acterization of Twitter, and De Choudhury et al. [2010] analyzed how user similarities (homophily) along various attributes can affect the information diffusion process on Twitter. Liben-Nowell and Kleinberg [2008] reconstructed the propagation of massively circulated Internet chain letters and showed that their diffusion proceeds in a narrow but very deep-like pattern.
3.2
Information Diffusion Across OSM Services
3.3. Tools and Applications for OSM Services 11
explicit use of URLs between blogs to track the flow of information. Cha et al. [2009] analyzed the blogging network structure and information diffusion patterns within the network. Broxton et al. [2010] analyzed the diffusion of viral video popularity in OSM, but focused only on how the popularity of a video varies with its introduction in OSM. They concluded that viral videos gain popularity faster on OSM than through any other referring source or itself (e.g., search engines, etc), and that viral video popularity on Twitter is at a higher rate than in any other OSM website, but without analyzing the underlying network structure affecting the higher rate.
Recently, Archambault and Grudin [2012] conducted annual surveys of social networking at Microsoft between 2008 and 2011 to understand how these sites were used and whether they were considered to be useful for organizational communication and information-gathering. Growth in use and acceptance was not uniform, with differences based on some aspects like gender and age. Tang et al. [2012] developed a framework for classifying the type of social relationships by learning across heterogeneous networks.
Most of these studies of information diffusion on OSM are focused in one specific aspect of the diffusion and in only one OSM service. In contrast to these works, our study unveils different aspects of word-of-mouth information, such as not only of the shape of cascades, but also the impact of publishers and subscribers of content. This dissertation also explores some aspects related with the exchange of information between different OSM services, which was mostly explored before on the blogosphere.
3.3
Tools and Applications for OSM Services
12 Chapter 3. Literature Review
3.4
Information Retrieval
Chapter 4
On Word-of-Mouth Based
Discovery of the Web
In this chapter we present an analysis about how URLs diffuse internally among Twit-ter users by word-of-mouth. The set of analysis discussed here were also published in Rodrigues et al. [2011].
4.1
Methodology
Twitter is a prime example of an OSM service where users discover Web content through word-of-mouth. In this part of the characterization, we used the Twitter dataset gath-ered in Cha et al. [2010] and studied the properties of word-of-mouth based Web discovery.
Twitter is an ideal medium for these studies for several reasons. First, the core functionality provided by Twitter, tweeting, is centered around the idea of spread-ing information. Second, Twitter provides additional mechanisms like retweet (act of forwarding other people’s tweet), which enable users to propagate information across multiple hops in the network. Third, thanks to URL shortening services, sharing URLs has become a common practice in Twitter.
4.1.1
The Twitter Dataset
Data collection utilized the official Application Programming Interface (API) of Twit-ter and took over a month using 58 servers in Germany [Cha et al., 2010]. These servers were white listed by Twitter so that they can send API requests rapidly. The data comprises the following three types of information: profiles of 54,981,152 users,
14 Chapter 4. On Word-of-Mouth Based Discovery of the Web
1,963,263,821 directed follower links among these users, and all 1,755,925,520 public tweets that were ever posted by the collected users. The oldest tweet in this dataset is from March 2006, when the Twitter service was publicly launched. The dataset does not include any tweet information about a user who had set his account private (8% of all users). Moreover, this dataset is near-complete because user IDs were sequen-tially queried from all possible ranges (0–80 million) at the time of data collection in September 2009. Therefore, it provides a unique opportunity to examine the largest word-of-mouth based URL propagation event in Twitter.
A Twitter user might follow another user to receive his tweets, forming a social network of interest. The node in-degree and out-degree distributions measured on this network are heavy-tailed, and the network topology is similar to those of other OSM services like Facebook. They can be fit well with a Power-Law distribution with exponents 2.19 for in-degree and 2.57 for out-degree (R2
=0.05–0.09%). While a very small fraction of users have an extremely large number of neighbors, the majority of users have only a few neighbors; 99% of users have no more than 20 in- or out-degree neighbors. The most popular users include public figures like Barack Obama, celebrities like Oprah Winfrey, as well as media sources like BBC. A social link in Twitter is directional. Unlike other OSM services, the Twitter network exhibits extremely low reciprocity; only 23% of all links are bidirectional, which means that high in-degree nodes are not necessarily high out-degree nodes.
4.1.2
URLs in Tweets
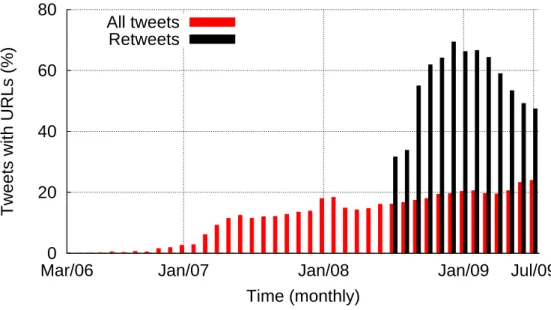
A URL is treated as a clean piece of information that spreads in Twitter. The number of tweets containing URLs has increased rapidly over the years, as shown in Figure 4.1. Since 2009, on average 22.5% of tweets contain URLs, and as of September of 2009 more than 30% of tweets contain URLs. This is equivalent to sharing 1.3 million distinct URLs per day in 2009. The URL usage is even higher in retweeets: 47%. Interestingly, the number of retweets grew abruptly after July of 2008. This is because retweeting became a convention between users around this time [Boyd et al., 2010].
4.2. Which Content is Popular? 15
0 20 40 60 80
Mar/06 Jan/07 Jan/08 Jan/09 Jul/09
Tweets with URLs (%)
Time (monthly) All tweets
Retweets
Figure 4.1. Usage of URLs on tweets over time
periods (so that these URLs refer to identical content) was picked, and then resolved all the short URLs to the long URLs for data analysis in this paper.
Table 4.1 displays the summary of datasets we analyzed. Each week period contains several million distinct URLs. Because the samples are from a one week period, certain URLs were already in the process of word-of-mouth propagation. Hence, the entire tweet dataset was scanned to find all tweets that contain the URLs in Table 4.1 and additionally considered them in our analysis. We made sure that none of the added URLs were recycled. For a better readability, only results for Dataset 2 in Table 4.1 is presented. All the conclusions hold for Dataset 1 as well.
Period Distinct URLs Tweets Retweets Users Dataset 1 Jan 1, 2009 – Jan 7, 2009 1,239,445 6,028,030 295,665 995,311
Dataset 2 Apr 1, 2009 – Apr 7,2009 4,628,095 17,381,969 1,178,244 2,040,932
Table 4.1. Statistics of the two Twitter datasets analyzed
4.2
Which Content is Popular?
16 Chapter 4. On Word-of-Mouth Based Discovery of the Web
4.2.1
URL Shortening Services
URL shortening services make it easy for Internet users to share Web addresses by providing a short equivalent [Antoniades et al., 2011]. For example, a Web linkhttp: //topics.nytimes.com/top/news/business/companies/twitter/can be shortened tohttp://nyti.ms/1VKbrC by a commercial service Bit.ly [Bit.ly, 2012a], which will redirect any request access to the original NYTimes website. URL shortening services allow otherwise long Web addresses to be referred to in various OSM services like Twitter that often impose character limit in tweets and comments. There are hundreds of commercial URL shortening services. Hence, the same Web address can have several short alternatives in services like tinyURL [tinyURL, 2012] and Ow.ly [Ow.ly, 2012].
In order to identify whether a given Web address is a short or long URL, a heuristic approach was taken. A Python script was written to resolve a URL in a tweet by sending a Web access request to that URL and comparing the domain of the original URL with that of the resolved URL. If the two domain names were different, the URL in the tweet is considered to be a short URL, otherwise, it is considered it a long URL.
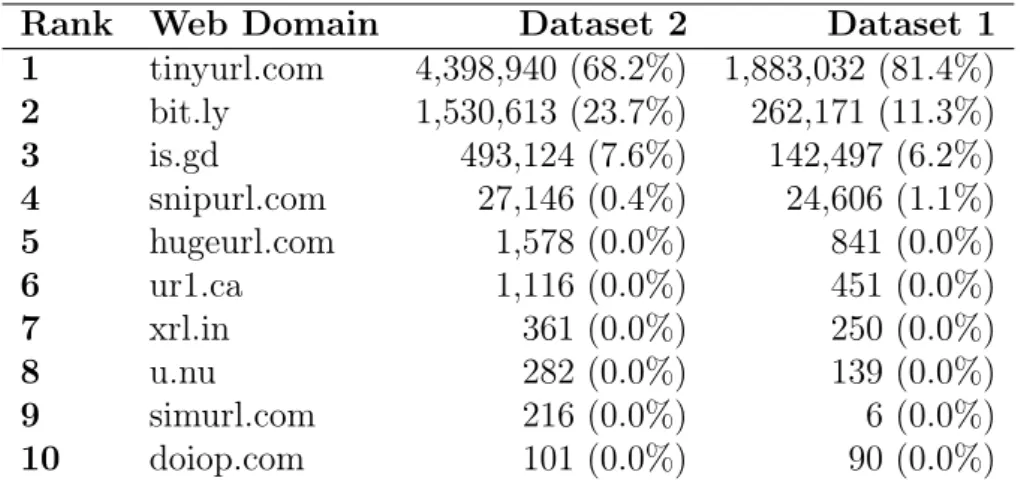
A total of 30 URL shortening services were in use from 2006 to summer 2009 in Twitter. Table 4.2 displays the top 10 services and their share of tweets. Usage of the top two services (tinyurl.com and bit.ly) make up more than 90% of the total usage. Between January to April of 2009, we find that bit.ly doubled its presence. The 3rd ranked service (is.gd) also continued to gain presence in Twitter.
Rank Web Domain Dataset 2 Dataset 1 1 tinyurl.com 4,398,940 (68.2%) 1,883,032 (81.4%)
2 bit.ly 1,530,613 (23.7%) 262,171 (11.3%)
3 is.gd 493,124 (7.6%) 142,497 (6.2%)
4 snipurl.com 27,146 (0.4%) 24,606 (1.1%)
5 hugeurl.com 1,578 (0.0%) 841 (0.0%)
6 ur1.ca 1,116 (0.0%) 451 (0.0%)
7 xrl.in 361 (0.0%) 250 (0.0%)
8 u.nu 282 (0.0%) 139 (0.0%)
9 simurl.com 216 (0.0%) 6 (0.0%)
10 doiop.com 101 (0.0%) 90 (0.0%)
4.2. Which Content is Popular? 17
4.2.2
Popularly Linked Web Domains
Next, we checked whether URLs popularly shared on Twitter come from major Web domains in the Internet (such as nytimes.com or google.com). The motivation of this analysis is to verify a widely held belief that word-of-mouth can help popularize niche or esoteric information from domains that are not otherwise very popular. The translated long URLs were used for this analysis and the rest of this work, and the URLs were grouped based on their domain names.
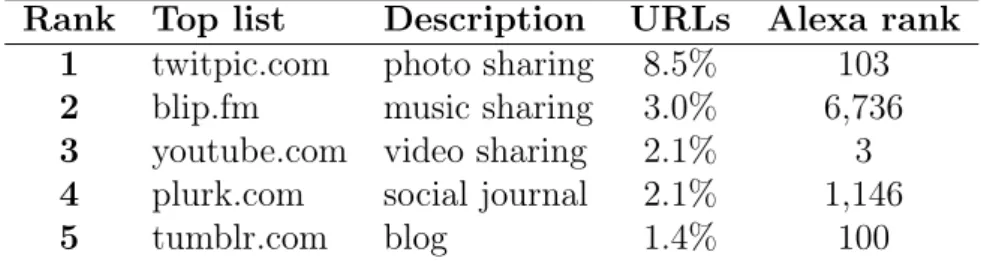
In total, there were 4,638,095 long URLs that came from 429,551 distinct Web domains. The top 20% of the Web domains accounted for 95% of these URLs. We ranked the domains based on the number of distinct URLs that belong to the domain as well as the total size of the audience reached by URLs belonging to the domain. Experiments using both ranking methods had similar results. We compared the list of top domains in the resulting rankings with the list of top ranked domains in the general Web published by Alexa [Alexa.com, 2012]. Table 4.3 displays the top 5 domains based on the number of URLs, their description, the fraction of all URLs that belong to the domain, and their rank from alexa.com.
Rank Top list Description URLs Alexa rank 1 twitpic.com photo sharing 8.5% 103
2 blip.fm music sharing 3.0% 6,736
3 youtube.com video sharing 2.1% 3
4 plurk.com social journal 2.1% 1,146
5 tumblr.com blog 1.4% 100
Table 4.3. Top 5 domains in Twitter (April, 2009)
The most popular domain, twitpic.com, accounted for 8.5% of all URLs in the tweet data. The coverage of the other top domains quickly drops with decreasing rank. The Alexa ranking shows that the top 5 domains are quite different from the top list in the Web. Only youtube.com is within the top 10 sites from alexa.com. The top 5 list in Alexa includes major search engines (Google) and portals (Yahoo, Live). We also found that Twitter users often share user-generated content, as seen in the table. Twitter users share photos (twitpic.com), videos (youtube.com), blog articles (techcrunch.com), as well as participate and promote social events (abolishslavery.com and earthday.net).
18 Chapter 4. On Word-of-Mouth Based Discovery of the Web
Twitter (including initiators, spreaders, and receivers). The overlap is minimal; fewer than 30% of the topK domains in Twitter overlap with that of the general Web, for all ranges of K=100,· · ·,1000. This finding suggests that as word-of-mouth becomes a dominant source of discovering information, a different set of domains might become popular in the Web in the near future.
0 10 20 30 40 50
100 200 300 400 500 600 700 800 900 1000
Overlap with Alexa.com (%)
K (the top-k domains in Twitter) # URLs audience
Figure 4.2. Popular domains in Twitter and Alexa rank
A recent work characterizing the usage of short URLs on Twitter also presented an analysis comparing the popularity of domains on Twitter and on the general Web [An-toniades et al., 2011]. Although the authors of that work considered only the domains pointed by short URLs, which differs from our analysis, they also found that the most popular domains shared on Twitter differs significantly from the general Web case.
4.2.3
Popular Individual URLs
Next we focus on popularity of individual URLs within domains. Of particular interest to us is the hypothesis that word-of-mouth gives all URLs and content a chance to be-come popular, independent of popularity of the domain it be-comes from. The hypothesis is rooted in the observation that anyone could identify an interesting URL and start a viral propagation of the URL, independent of the reputation or popularity of the domain where it is published.
4.2. Which Content is Popular? 19
maximum size of the audience for individual URLs within each domain. Given the large number of domains (over 400,000 of them) we ranked the domains based on number of URLs, grouped them into bins of 5,000 consecutively ranked domains and plotted one data point for each bin. It is striking to observe that URLs from some unpopular domains beyond the rank of 300,000 reached an audience that is comparable to the size of the audience reached by URLs from the most popular domains. On average, URLs in the top 5,000 domains reached 49,053 users, while URLs from the bottom 5,000 domains reached 1,107 users. Although URLs from top domains reached a 44 times larger audience than those from bottom domains, there do exist individual URLs from bottom domains that reach as large as audience as the most popular URL from the top domains.
100 101 102 103 104 105 106 107 108
0 100000 200000 300000 400000
Audience size
Rank of domains (binned every 5,000 domains) min - max
average
Figure 4.3. Audience size across the domain ranks
Thus, word-of-mouth does offer a chance for all content to become popular, inde-pendent of the domain it is published in. Previous work on book and DVD recommen-dations showed that viral marketing is effective for niche products compared to mass marketing [Leskovec et al., 2007a]. Our analysis suggests a similar trend.
4.2.4
Content Types
20 Chapter 4. On Word-of-Mouth Based Discovery of the Web
In order to identify the content type, several interest categories based on Open Directory Project (DMOZ) were selected, which is a human-edited directory of the Web [Project, 2012]. DMOZ’s content classification relies on the fact that a domain name has a hierarchical structure. So, a domain name of a Web address could poten-tially be used to identify the specific content category, given the list of predefined clas-sifications for many Web domains as in the DMOZ service. For example, nytimes.com is classified in the news category; last.fm is classified as the music category.
Among various categories DMOZ supports, 5 categories of interest were picked: photo sharing, videos, music, news, and applications, and downloaded the list of Web domains in each of these categories. In total, the DMOZ listing contained 343 domains across all five categories. For the application category, the list of applications that are widely used within Twitter were selected, such astweetdeck.com and wefollow.com.1
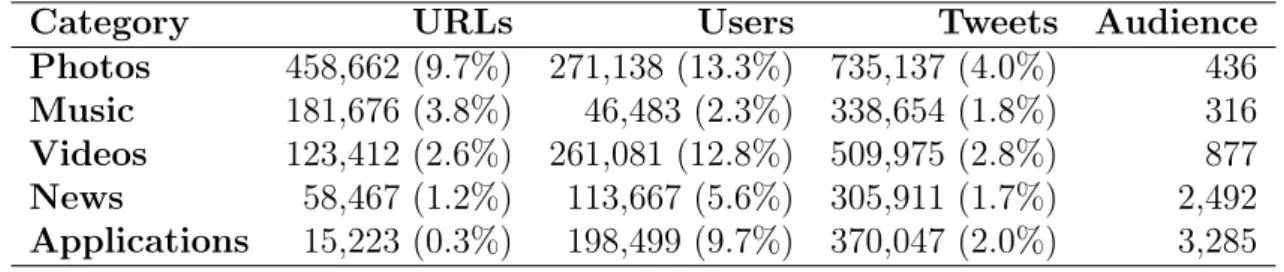
Table 4.4 displays the share of each topical category in Dataset 2. Matching the domains of the URLs in Dataset 2 with the domains listed in these five categories in DMOZ, we were able to successfully categorize 17.6% of websites, although a much larger fraction of users (43.7%) were covered. The most popular category is photo sharing, which has 458,662 URLs, posted by 271,138 users on 735,137 tweets. The average audience reached by each photo’s URL is 436 users. The second most popular category is music, followed by videos, news and applications.
Category URLs Users Tweets Audience
Photos 458,662 (9.7%) 271,138 (13.3%) 735,137 (4.0%) 436
Music 181,676 (3.8%) 46,483 (2.3%) 338,654 (1.8%) 316
Videos 123,412 (2.6%) 261,081 (12.8%) 509,975 (2.8%) 877
News 58,467 (1.2%) 113,667 (5.6%) 305,911 (1.7%) 2,492
Applications 15,223 (0.3%) 198,499 (9.7%) 370,047 (2.0%) 3,285
Table 4.4. Summary Information of Categories of URLs
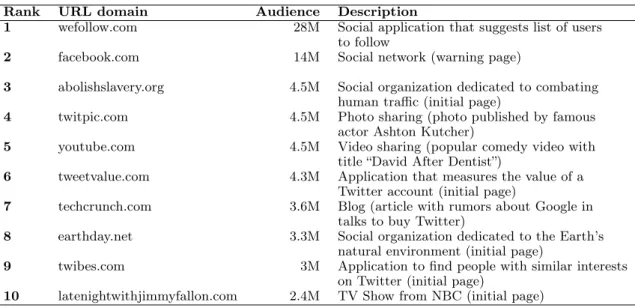
While photo sharing seems a dominant activity in Twitter as opposed to news or application sharing, the set of most popular individual URLs are from a diverse set of topical categories as shown in Table 4.5. The most popular URL was the social application,wefollow.com, which reached an audience of 28 million (i.e., nearly half of the entire Twitter network).
Although this analysis about the different content types shared on Twitter is an interesting aspect of our study, we note that our methodology has some limita-tions. First, we were able to categorize only 17.6% of the URLs, which might not
1
4.3. The Shape of Word-of-mouth 21
Rank URL domain Audience Description
1 wefollow.com 28M Social application that suggests list of users to follow
2 facebook.com 14M Social network (warning page)
3 abolishslavery.org 4.5M Social organization dedicated to combating human traffic (initial page)
4 twitpic.com 4.5M Photo sharing (photo published by famous actor Ashton Kutcher)
5 youtube.com 4.5M Video sharing (popular comedy video with title “David After Dentist”)
6 tweetvalue.com 4.3M Application that measures the value of a Twitter account (initial page)
7 techcrunch.com 3.6M Blog (article with rumors about Google in talks to buy Twitter)
8 earthday.net 3.3M Social organization dedicated to the Earth’s natural environment (initial page)
9 twibes.com 3M Application to find people with similar interests on Twitter (initial page)
10 latenightwithjimmyfallon.com 2.4M TV Show from NBC (initial page)
Table 4.5. Top 10 URLs domains in terms of the audience size reached by the most popular URL
be representative. Second, DMOZ is often criticized for its lacks of representativeness and transparency [Goodman, 2012], but it is not easy to categorize content to begin with, and we manually checked the list of Web domains in each category we used from DMOZ. Moreover, our main interest in the URL categorization is at understanding the similarities and differences between the propagation of different content types on Twitter. We are not trying to say that Twitter users share more photos than videos or news, for example.
4.3
The Shape of Word-of-mouth
This section presents an analysis of the size and shape of word-of-mouth based URL propagation patterns in Twitter.
4.3.1
How Large is the Largest Word-of-mouth?
22 Chapter 4. On Word-of-Mouth Based Discovery of the Web
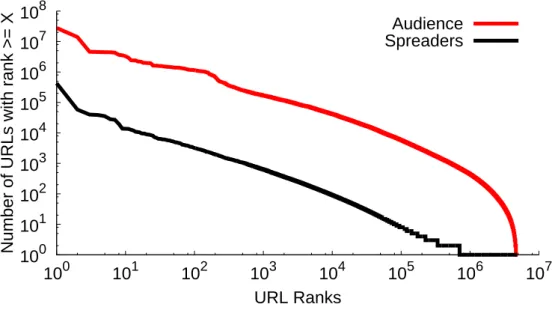
1 million users and 15% of the URLs reached an audience of over 1000 users.
100 101 102 103 104 105 106 107 108
100 101 102 103 104 105 106 107
Number of URLs with rank >= X
URL Ranks
Audience Spreaders
Figure 4.4. The size of word-of-mouth
The difference between the number of spreaders and the size of the audience is nearly two orders of magnitude, for popular URLs as well as niche URLs that have only a few spreaders. This demonstrates the potential of word-of-mouth in reaching a large audience. As opposed to a typical Web page that is viewed by individual visitors, content shared in word-of-mouth fashion iscollaboratively shared by other visitors who liked it and can reach a much larger audience.
Both distributions for spreaders and audience exhibit power-law behavior (a straight line waist in a log-log plot). The best fit power-law exponents of these distribu-tionsy=cx−α wereα= 1.71for spreaders, and α= 1.98for audience, indicating that
the skew in popularity among the most popular and the least popular URL became slightly more severe due to audience.
4.3.2
The Role of Initiators
4.3. The Shape of Word-of-mouth 23
In Twitter, nearly 90% of all URLs are introduced only by initiators without involving any spreaders. URLs that were propagated further by spreaders went multiple hops in the Twitter social graph and gained a 3.5 times larger audience than those spread by initiators. This implies that while initiators’ role is dominant and that most URLs propagate only 1-hop in the network, multi-hop propagation by spreaders can extend the readership of URLs by a significant amount.
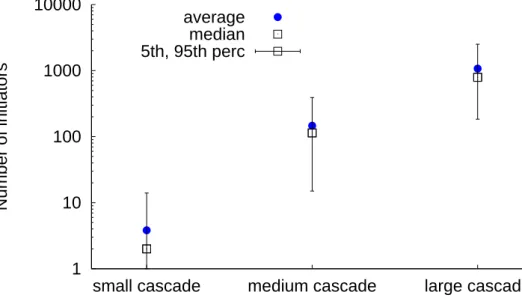
Next, the relationship between the number of initiators and cascade size is in-vestigated. In order to focus on URLs with multiple initiators, only URLs with at least two participants (i.e., initiators or spreaders) were selected for this analysis. URL cascades were grouped into three types: small (1,10), medium [100,1000), and large [1000,∞). Figure 4.5 shows the number of initiators per URL for the three types of cascades. The plot shows the 5th percentile, median, average, and 95th percentile val-ues. The number of initiators is orders of magnitude larger over the cascade size. The median number of initiators is 2, 114, and 792 for small, medium, and large cascades, respectively. Furthermore, very few URLs (0.2%) had more than 100 initiators who independently shared the same URL. While certain large cascades only involved a sin-gle initiator, the plot indicates that the number of initiators does affect the size of the cascade for most URLs — larger cascades likely involve more users who independently share the URL.
1 10 100 1000 10000
small cascade medium cascade large cascade
Number of initiators
average median 5th, 95th perc
Figure 4.5. The number of initiators per URL
24 Chapter 4. On Word-of-Mouth Based Discovery of the Web
in obtaining audience, or whether a few major initiators played a significant role. Figure 4.6 investigates the fraction of the largest sub-tree for each URL over cascade size. The plot shows much variability, shown by the wider range of the 5th and 95th percentiles. Nonetheless, the median and the average data points show a clear trend.
0 0.1 0.2 0.3 0.4 0.5 0.6 0.7 0.8 0.9 1
small cascade medium cascade large cascade
Fraction of the largest tree
average median 5th, 95th perc
Figure 4.6. Roles of initiators by the largest subtree
For small cascades, the fraction of total audience reached in the largest sub-tree (i.e., by a single major initiator) is nearly 50%. For larger cascades, however, the fraction of the largest sub-tree is marginal (10-20%). This implies that a single initiator’s role is likely to be limited in these cases and that popular content usually propagates through several different propagation trees. In fact, there exists a strong positive correlation between the number of initiators and the total size of the audience (Pearson’s correlationρ=0.7171 [Wikipedia, 2012]).
On Digg, a social news aggregator that allows users to submit links to and vote on news stories, a story of general interest usually spreads from many independent seed sites, while a story that is interesting to a narrow community usually spreads within that community only [Lerman and Galstyan, 2008]. This observation might also be true in the case of URLs propagated in Twitter, but we left the investigation for future work.
4.3.3
The Shape of Word-of-mouth
4.3. The Shape of Word-of-mouth 25
referred as the height of the tree. The width of the tree is defined as the maximum number of nodes that are located at any given height level. For instance, a two-node cascade graph has height of 2. Because a single URL propagation may have multiple tree structures, we consider only the largest propagation tree for each URL and examine its width and height.
Figure 4.7 shows the distributions of height and width for all URLs. Nearly 0.1% of the trees had width larger than 20, while only 0.005% of the URLs had height larger than 20. This suggests that cascade trees in Twitter are wider than they are deep. In fact, the maximum observed width of any propagation tree was 38,418, while the maximum observed height was 147 — a difference of two orders of magnitude.
100 101 102 103 104 105 106 107
100 101 102 103 104 105
Number of URLs with > x metric
Metric
Height Width
Figure 4.7. Height and width distributions
Figure 4.8 shows the relationship between the width and height level, as the 10th, 50th (median), and 90th percentile width over every height level. Trees were grouped based on their size (according to the number of spreaders). Small trees with fewer than 100 spreaders tend to have a very narrow shape of width 1 or 2 throughout the height level. Larger trees with more than 100 spreaders were widest at low heights and the width decreased slowly towards the leaf nodes. Interestingly, the median width remained near 10 even at heights above 80. Visualization revealed that these large trees occasionally included bursts at all height levels, i.e., the branch out factor is suddenly large at particular spreaders. The visualization also revealed not one but multiple such bursts for every popular URL.
26 Chapter 4. On Word-of-Mouth Based Discovery of the Web
100 101 102 103 104
20 40 60 80 100 120 140 160
Median width
Height Level
large medium small
Figure 4.8. Cascade size distributions
of URLs: photos, music, videos, news and applications. Several interesting differences were observed across content types. Videos propagations likely involve a larger cascade tree; more than 30% of videos URLs involved at least two participating users who shared the URL. News and applications propagation also involved multiple users (28% and 23%, respectively), while photos and music were mostly shared by a single initiator (90% and 97%, respectively). This observation indicates that the type of content affects the potential of the eventual cascade size. The probability of involving 10 or more users in spreading is around 10% for news, applications and videos, while it is only 1% for photos and music.
4.4
Content Distribution
So far, several key characteristics of word-of-mouth based URL propagation in Twitter were investigated. The observed propagation patterns have direct implications on systems, especially on content distribution and caching strategies. In this section, some of these observations are revisited. Geo-location information of users was used to examine how far word-of-mouth content travels around the globe.
4.4. Content Distribution 27
1 10 100
photos music videos news applications
Size of cascade
average median 5th, 95th perc
Figure 4.9. Size per content type
inferred by using the Google Geocoding API [API, 2012], which converts addresses or city names written in free text form into geographic coordinates of latitude and longitude. In total, the location of 1,096,804 users was identified. In the remainder of this section, only the network and the URL propagation patterns among these one million users were considered.
4.4.1
Content Producers and Consumers
Physical proximity between content producers and consumers in Twitter is first inves-tigated. Here, a content producer represents a user who posts a URL independently of others (i.e., root nodes in any cascade tree) and a content consumer represents all other nodes in a cascade tree. Figure 4.10 shows the distribution of physical distance between any two users in the word-of-mouth URL propagation. Physical distance is computed based on the latitude and longitude information of two users. The distance is in units of 10km, representing a local community. The graph shows the probability distribution function for each distance d, which is the physical distance among all user pairs (u, v), where either (1) useru explicitly retweeted the URL that another user v shared or (2) user ufollows another user v and shared the same URL after v posted it on Twitter. If either of these two conditions holds, we say that there is a propagation link from user u to userv.
28 Chapter 4. On Word-of-Mouth Based Discovery of the Web 1e-06 1e-05 0.0001 0.001 0.01 0.1 1
1 10 100 1000 10000 100000
Distance (km) Propagation
Friendship
Figure 4.10. Physical distance of Twitter friendship links and URL propagation links
link. The friendship links represent the full potential of content distribution through word-of-mouth (i.e., when every follower actively reads or consumes the URL she re-ceives from others).
A significant correlation between the content propagation probability and physi-cal proximity of users is observed. That is, users within a short geographiphysi-cal distance (e.g., 10 km) have a higher probability of posting the same URL than those users who are physically located farther apart. The current OSM services infrastructures could exploit this physical proximity between content producers and consumers. Moreover, a significant correlation between the friendship and physical proximity is also observed. This is expected as users tend to interact more with other users who are physically nearby. Liben-Nowell et al. [2005] previously found a strong correlation between friend-ship and geographic location among LiveJournal users.
Interestingly, the correlation between the content propagation probability and physical proximity of users is slightly higher than that observed for having a friendship link. This might be explained by the fact that Twitter users follow not only their friends, but also media companies and celebrities, as well as distant users that post content that is valuable to them. However, when it comes to retweeting other users’ messages, Twitter users chose tweets posted by those geographically nearby.
4.4. Content Distribution 29
50 km, which roughly represents a large metropolitan area. In order to separate out the impact of producer popularity, content producers were grouped into three groups based on their in-degree. Also, in order to see the representativeness of the results, the location between all users was randomized by shuffling the location tags of users and computed the distance between them (shown as ‘random’ in the figure).
0 5 10 15 20 25 30 35 40 45 50 55 60
All Photos Videos Music News Applications
Propagation locality (%)
#followers <= 100 #followers <= 1000 #followers <= 10000 all random
Figure 4.11. Distribution locality across content types
First, we focus on the impact of content producer’s popularity on distribution lo-cality and examine the first set of bars labeled ‘All’ content type in the x-axis. Overall, about 24% of the users who propagated content are physically close to very popular content producers who had more than 1,000 followers, 32% are close to content produc-ers with between 100 and 1000 followproduc-ers, and 39% are close to content producproduc-ers with less than 100 followers. This result indicates that producers with a small number of followers tend to incur content propagations to geographically nearby locations. On the other hand, content producers with a large number of followers tend to be celebrities or well-known people and incur content propagations across wider areas.
30 Chapter 4. On Word-of-Mouth Based Discovery of the Web
Motivated by the overall high content locality at 1-hop users, we look at the dis-tance a URL travels as it is further propagated by users within 2- and 3-hops away from the content creator. Figure 4.12 shows the geographical distance related to the content creator (initiator) as a function of the height level of spreaders on the hierar-chical trees. Clearly, content tends to spread short distances on the first hops. As soon as friends-of-friends join the cascade and share the same URL, it reaches users located in different regions and, consequently, reaches distant locations.
0 1000 2000 3000 4000 5000 6000 7000
0 10 20 30 40 50 60 70 80 90 100
Distance (km)
Hops average
median 5th, 95th perc
Figure 4.12. Distance between initiators and spreaders
Chapter 5
Cross-Pollination of Information in
Online Social Media: a Case Study
on Popular Social Networks
In this chapter we discuss how URLs generated in external OSM services diffuse on Twitter. The set of analysis discussed here were also published in Jain et al. [2011].
5.1
Methodology
Next, a description of the data collection framework used in this part of the character-ization and some characteristics of the datasets collected are given.
5.1.1
Data Collection
The data collection framework is composed of two phases (see Figure 5.1). In the first phase, Twitter Streaming Application Program Interface (API) [Twitter, 2012b] is used to collect all tweets periodically, using a set of keywords. This step was part of a re-search project, developed by a Brazilian Rere-search Institute, 1
which tracks information about important events in several social and traditional media sources, like newspapers, blogs, and online social networks.2
After this step, all URLs that appear on the content of the tweets are filtered. Due to the usage of URL shorteners likebit.ly[Twitter, 2012a], all shortened URLs are expanded and all tweets with YouTube videos URLs, Flickr photos URLs, and Foursquare location URLs are filtered. Then, all tweets that contain
1
Instituto Nacional de Ciência e Tecnologia para a Web,http://www.inweb.org.br/
2
TheObservatório da WebProject,http://observatorio.inweb.org.br/
32
Chapter 5. Cross-Pollination of Information in Online Social Media: a Case Study on Popular Social Networks
these types of URLs are inserted intoForeign meme Database (FMDb). In the second phase, YouTube [YouTube, 2012], Flickr [Flickr, 2012], and Foursquare [Foursquare, 2012] APIs are used to collect information about the foreign memes and their uploaders, storing the same in Objects Database (ODb).
Figure 5.1. Data collection framework
Out of the most discussed topics on Twitter in 2010 [Twitter, 2010], a dataset for FIFA World Cup (FWC), a global event, was created. The FWC is an international football competition contested by the senior men’s national teams of the members of Fédération Internationale de Football Association (FIFA), the sport’s global governing body. The event happens every 4 years and in 2010 it took place in South Africa, from June 11th to July 11th. The FWC event was monitored from June 10th to July 12th,
using 112 keywords (e.g. worldcup, FIFA and southafrica) in 7 different languages (like Portuguese, English and Spanish). To ensure no data loss, several redundant machines were used to collect the same data.
5.1.2
Datasets
5.2. Cross-Pollination Characteristics 33
comparison helps in understanding how the introduction of foreign memes affects the diffusion OSM.
Source OSM (SOSM) URLs Tweets Twitter Users SOSM Users
YouTube 34,306 141,118 88,231 26,026
Foursquare 14,896 23,252 14,401
-Flickr 1,719 2,560 1,419 711
Baseline - 29,038,497 3,511,044
-Table 5.1. Descriptive statistics of the datasets
In order to verify the representativeness of the datasets, all the analysis were repeated using keywords related to another popular event in 2010 on Twitter — the Brazilian Presidential Election. 3
This event was especially monitored during the can-didate’s campaign, which started on July 6th and ended on October 31st, the final
election day. A set of 30 keywords (e.g. dilma, serra and marinasilva) related to the candidates and their political parties was used to monitor this event. For a better read-ability, only the results for FWC datasets are presented, but most of the conclusions hold for the Brazilian Presidential Election datasets as well.
5.2
Cross-Pollination Characteristics
In this section a key question about Cross-Pollination is investigated: What are the characteristics of Cross-Pollination? We start with some temporal characteristics, and then we analyze some topological characteristics.
5.2.1
Sharing Activity
An important temporal characteristic of Cross-Pollination is the volume of tweets gen-erated by foreign memes on a given day during a certain period of time. Figure 5.2 shows the total number of tweets with foreign memes created on each day during the FWC event. For comparison purposes, the figure also shows the total number of tweets with local memes created per day (using baseline dataset). During the whole period, a similar trend is observed, for all datasets analyzed. The trend of volume of tweets created due to meme (both foreign and local) sharing is relatively uniform and similar during the whole period, with small peaks occurring on the same days. Hence, foreign meme sharing activity follows local meme sharing activity, although absolute numbers
3
34
Chapter 5. Cross-Pollination of Information in Online Social Media: a Case Study on Popular Social Networks
differ significantly (around103
YouTube foreign memes on Twitter and106
local memes on baseline dataset).
100 101 102 103 104 105 106 107 108 109
0 5 10 15 20 25 30 35
Number of tweets with memes
Days since the beginning of dataset Baseline YouTube Foursquare Flickr
Figure 5.2. Foreign and local meme creation over time
5.2.2
User Participation
In order to verify whether users contribute equally in the traffic generated by Cross-Pollination on Twitter, User Participation (UP) was defined as the average number of tweets with memes created per day, for each user. Users were divided into bins according to their UP, and then the percentage of users in each bin is calculated (see Figure 5.3). Users contribute equally for the traffic generated by Cross-Pollinated networks; vast majority of users (more than 90%) are in the same bin, with less than 2 tweets with foreign memes created per day. Furthermore, Cross-Pollinated networks follow the diffusion OSM in this aspect, as the vast majority (more than 70%) of users from the baseline dataset is on the same bin. The same observation can be done for Flickr photos and Foursquare locations.
5.2.3
Diffusion Delay
5.2. Cross-Pollination Characteristics 35 0 10 20 30 40 50 60 70 80 90 100
UP < 2 2 <= UP < 5 UP >= 5
Percentage of users
YouTube Foursquare Flickr Baseline
Figure 5.3. User participation (UP) in meme creation
within a day. Note that YouTube and Flickr memes tend to be retweeted with a slightly higher delay than Foursquare and local memes. For example, around 50% of tweets with YouTube and Flickr memes have a delay larger than 1,000 seconds (around 16 minutes), while 30% of retweets from Foursquare and local memes have a delay larger than 1,000 seconds. Nature of the content is a reasonable explanation for this difference. A user can easily read and quickly respond a direct message (local meme), while a foreign meme becomes an indirect message as the user is expected to view the content of the URL before forwarding it. In this case, Foursquare memes are more similar to local memes because they are usually automatically posted messages which contain the name of the place from where the user “checked in” together with the URL of the location. “I am at DCC, UFMGhttp://4sq.com/XyZw” is an example of this kind of tweet.
We now turn our focus to analyze topological characteristics of Cross-Pollinated networks.
5.2.4
Information Cascades
36
Chapter 5. Cross-Pollination of Information in Online Social Media: a Case Study on Popular Social Networks
0 0.1 0.2 0.3 0.4 0.5 0.6 0.7 0.8 0.9 1
100 101 102 103 104 105 106 107 108
CCDF
Diffusion Delay (seconds) 16 minutes
1 hour 1 day
YouTube Flickr Foursquare Baseline
Figure 5.4. Diffusion delay of memes
remains to only one user. Local memes have a similar distribution. Number of cascades follow 90-10 Pareto distribution with 90% cascades with size ≤ 3 and 10% cascades with size ≥ 3, for both Cross-Pollinated network and baseline.
100 101 102 103 104 105 106 107
100 101 102 103 104
Number of cascades
Cascade size
Baseline YouTube Foursquare Flickr
Figure 5.5. Distribution of cascades with cascade size.
5.3. Relationship Between OSM Services in a Cross-Pollinated
Network 37
YouTube videos than Flickr photos, Foursquare locations and local memes (highest # spreaders / meme). Even then, note that average cascade size for YouTube remains close to the other datasets. A large number of small cascades neutralize larger cascade sizes. Average in- and out-degree for Cross-Pollinated networks are higher than baseline and close to each other. Hence, Cross-Pollinated networks behave similarly, irrespective of the type of foreign meme diffused.
Source OSM D IN OUT PL NCM CS NSM YouTube 1.06 1.17 1.12 0.37 2.81 2.53 7.08
Flickr 1.11 1.06 1.48 0.43 1.11 2.69 2.97
Foursquare 1.03 1.09 1.06 0.48 1.02 2.13 2.18
Baseline 1.07 0.53 0.53 - 1.00 2.78 2.78
Table 5.2. Information cascade statistics for three Cross-Pollinated networks and baseline. Legend: D = degree, IN = in-degree, OUT = out-degree, PL = path length, NCM = # cascades / meme, CS = cascade size, NSM = # spreaders / meme
5.3
Relationship Between OSM Services in a
Cross-Pollinated Network
Two important questions related with the relationship between the OSM services in-volved in a Pollinated network are answered in this section: (1) Does Cross-Pollination across OSM services help to increase the audience reached by the infor-mation diffused? (2) Is popularity of foreign meme on source/diffusion OSM a factor affecting its popularity on diffusion/source OSM?