Extreme ultraviolet (EUV) solar spectral irradiance (SSI) for
ionospheric application – history and contemporary state-of-art
G. Schmidtke1, Ch. Jacobi2, B. Nikutowski1,2, and Ch. Erhardt1
1Fraunhofer Institute for Physical Measurement Techniques IPM, Heidenhofstrasse 8, 79110 Freiburg, Germany 2Institute for Meteorology, University of Leipzig, Stephanstr. 3, 04103 Leipzig, Germany
Correspondence to: G. Schmidtke (gerhard.schmidtke@ipm.fraunhofer.de)
Received: 18 December 2013 – Revised: 27 February 2014 – Accepted: 14 March 2014 – Published: 11 November 2014
Abstract. After a historical survey of space related EUV measurements in Germany and the role of Karl Rawer in pur-suing this work, we describe present developments in EUV spectroscopy and provide a brief outlook on future activities. The group of Karl Rawer has performed the first scientific space project in Western Europe on 19th October 1954. Then it was decided to include the field of solar EUV spectroscopy in ionospheric investigations. Starting in 1957 an intensified development of instrumentation was going on to explore so-lar EUV radiation, atmospheric airglow and auroral emis-sions until the institute had to stop space activities in the early nineteen-eighties. EUV spectroscopy was continued outside of the institute during eight years. This area of work was sup-ported again by the institute developing the Auto-Calibrating Spectrometers (SolACES) for a mission on the International Space Station (ISS). After more than six years in space the instrument is still in operation. Meanwhile the work on the primary task also to validate EUV data available from other space missions has made good progress. The first results of validating those data and combine them into one set of EUV solar spectral irradiance are very promising. It will be recom-mended for using it by the science and application commu-nity. Moreover, a new low-cost type of an EUV spectrometer is presented for monitoring the solar EUV radiation. It shall be further developed for providing EUV-TEC data to be ap-plied in ionospheric models replacing the Covington index
F10.7. Applying these data for example in the GNSS signal evaluation a more accurate determination of GNSS receiver positions is expected for correcting the propagation delays of navigation signals traveling through the ionosphere from space to earth. – Latest results in the field of solar EUV spec-troscopy are discussed, too.
1 Introduction
During his activities in the Ionosphären-Institut Breisach, in 1957 Karl Rawer decided to start research in the field of so-lar radiation that is most strongly controlling the ionosphere flowed by the interaction with solar wind phenomena. To those times the knowledge about the dependence of the elec-tron densities on the solar activity was well established, but the relation between variability of solar extreme ultraviolet (EUV) radiation and the ionospheric response was not at all known, neither qualitatively nor quantitatively. To learn more about the varying solar EUV energy continuously deposited in the ionosphere was the task of a new group working in the area of the University of Freiburg.
2 Historical survey
After the successful measurement by a radio spectrometer aboard a French Veronique rocket on 19th October 1954 – it was the first scientific rocket mission of Western Eu-rope – Rawers team added an Impedance Probe and a Sed-don Experiment (measuring the phase delay time) to the next rocket payload in 1957 supporting ionospheric sound-ing from ground.
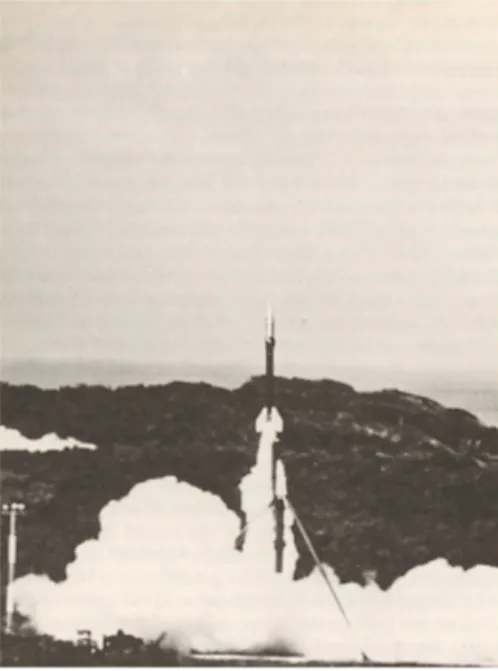
Figure 1. Launch of a Veronique rocket from Kourou/Guayana.
goal that was the development of EUV space instrumenta-tion.
Moving from the university district to an old villa Karl Rawer established the Arbeitsgruppe für PhysikaIische Welt-raumforschung (APW) in 1963. The laboratory vacuum spectrometer, a shaker for load qualification of instruments, some mechanical and electronic equipment such as a oscil-loscope supported the work for the realization of first ideas bringing together EUV and plasma instrumentation to in-situ investigating the ionosphere.
In 1963/1964 Schmidtke received a fellowship to join the U.S. Air Force group lead by Hans Hinteregger in Cambridge Massachussetts/USA. Hinteregger was a pioneer developing space-born EUV instruments based on counting spectrogram technique. After launching several Aerobee rockets the re-sults of the science data evaluation were summarized and published in a tabulation of solar EUV fluxes of the spectral range from 177.5 nm to 1 nm (Hinteregger et al., 1965). In the thermospheric-ionospheric research community this data set was used as EUV standard flux for years. A close coop-eration between the two groups continued for many years.
The generous support by Hinteregger for a successful work of the young and ambitious APW resulted in the straight-forward development of a rocket EUV spectrome-ter. Even more, a sensor of a retarding potential analyzer crossed the Atlantic Ocean for further developing and using it in a combined payload measuring the EUV energy influx and plasma parameters such as electron density and temperature and supra-thermal electron fluxes as well as ion density and ion distribution in the thermospheric-ionospheric system.
Since 1st October 1964 the APW was administrated by the Fraunhofer Gesellschaft für Angewandte Forschung. Based
on the grant WRK 50 (Weltraumkunde) from the Ministry of Education and Science (BMBW) up to 20 young enthusi-asts of space research started designing, developing, and fab-ricating instruments for rocket payloads. After several rocket missions with the Radiospectrometer, the Seddon Experi-ment and the Impedance Probe an EUV counter tube was the first experiment to detect solar radiation (Fischer, 1968). The rocket missions served also for qualifying and verify-ing of instruments to be operated aboard satellites in future projects.
In the laboratory good progress was made in the field of EUV spectroscopy related to space research. With the finan-cial support by the BMBW versatile equipment facilitated the space activities (Schmidtke, 1968). A big vacuum cham-ber was equipped with a new type of differential pumping system (Schmidtke, 1971) and with different light sources simulating the solar radiation from the X-ray through the UV spectral regions. The X-ray device generated characteris-tic emissions and bremsstrahlung from five anti-cathodes of different materials. The development of EUV hollow cath-ode discharges using materials such as wolfram, tantalum, and water-cooled aluminum provided a broad selection of spectral emissions from different gases or gas mixtures. For both types of laboratory instruments a power convertor sup-plied the radiation sources with up to 1.5 kW at voltage levels from 15 kV down to some hundred volts. Also the detectors available covered the full spectral range of interest. Count-ing technique with secondary electron multipliers as well as with channel electron multipliers and analog current record-ing represented the state of the art of those days.
Figure 2. Typical transmission characteristic of a diffraction filter (xaxis in Angstrøm units) (Schweizer and Schmidtke, 1971).
molecular nitrogen emission in a polar aurora event over Kiruna/Sweden in 1970 (Landensperger, 1971).
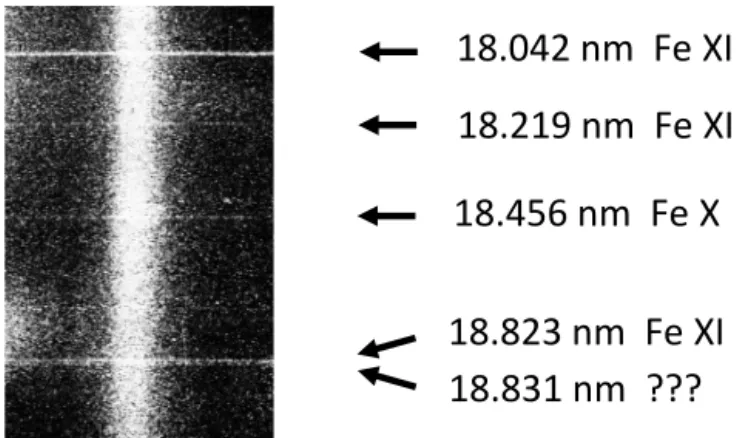
The new facilities allowed testing and calibrating of so-phisticated components and instruments. The development of the diffraction filter technology (see Fig. 2) made good progress (Schmidtke, 1968; Schmidtke, 1968/69; Schmidtke, 1970). In cooperation with Loren Actons group at Lockheed, Palo Alto, USA, a rocket payload for spectral recording of emissions has been developed. During the rocket mission of the high-resolution XUV diffraction filter spectrograph (Bruner et al., 1979; Schweizer and Schmidtke, 1971) ap-proximately 50 solar emission lines of the EUV spectrum be-tween 5 nm to 21.2 nm have been recorded on a Kodak SC-7 film with a spectral resolution of about 0.05 Å (see Figs. 3 and 4).
With the rocket launches from Hammaguir/Algeria, Sar-dinia/Italy, Andoya/Norway, Kiruna/Sweden, Wallops Is-land/USA, White Sands/USA and other places and with the presentation of the scientific results on international con-ferences such as COSPAR, URSI, SCOSTEP, IAGA, AGU, EGU and others the APW gained reputation in the space sci-ence community.
1968 the BMBW negotiated with NASA for work-ing on a German-American satellite mission explorwork-ing the ionospheric-thermospheric system. Given the international cooperation of the APW as well as the possible contribu-tion of his group a proposal for building and launching an aeronomy satellite called AEROS was elaborated. Five ac-tive experiments adding to each other were selected,
– Neutral Mass Spectrometer of Goddard Space Flight Center in Greenbelt, MD, USA,
– Ion Mass Spectrometer of the Max-Planck-Institut in Heidelberg, Germany,
– Retarding Potential Analyzer of APW in Freiburg, Ger-many,
Figure 3. The diffraction filter acted as the entrance slit of the graz-ing incidence spectrograph (Schweizer and Schmidtke, 1971).
18.042 nm Fe XI
18.219 nm Fe XI
18.456 nm Fe X
18.823 nm Fe XI
18.831 nm ???
Figure 4. Selected interval of the solar spectrum recorded with the grazing incidence spectrograph on 29th April 1971 (after Schweizer and Schmidtke, 1971).
– Impedance Probe of APW in Freiburg, Germany, and – EUV spectrometer of APW in Freiburg, Germany, plus the passive experiment Satellite Drag of Astronomische Institute of university Bonn, Germany.
These activities required the recruitment of the personnel. However, there was too little space in the rented accommo-dation of three old residential houses for the 30 employees. Therefore, 1971 the kick-off for constructing a new building envisaged the release of these limitations. In the plan the new building provided space for 49 members of staff and ample space for laboratory equipment with a large plasma simula-tion chamber and a large auroral/airglow simulasimula-tion chamber included. Working on the Veronique payloads, on the three instruments of the AEROS satellite, on developing and build-ing the instrumentation of three rocket missions for addbuild-ing altitude profiles of aeronomic parameters to the horizontally measuring AEROS instruments, on other rocket instrumenta-tion and on the procurainstrumenta-tion of the facilities for the new labo-ratories – all these activities required the full engagement of the colleagues carrying out many hours of overtime.
1971 both Veronique missions acquired good results. At the same time the Veronique instruments received the official verification label for the AEROS satellite mission. End of 1972 the satellite was launched successfully.
Figure 5. Karl Rawer attended the qualification of the two “Veronique” payloads in Toulouse/France.
It was managing the evaluation of daily accumulated data from three experiments. Strong support was received from students of the university, since topics of space research at the APW received high appreciation. Up to 30 young enthusiasts worked on the evaluation of the immense data sets from the satellite and from the other space missions. The work was centered at computer TR 86 of AEG-TELEFUNKEN con-suming 50 kW of power. The working memory of the com-puter was configuring up to just 64 K words with 24 bits, each with a tact period of 8 µs. Punched tape transported the pro-grams to this machine running around-the-clock.
The first scientific results derived from AEROS data boosted the already strong engagement of the people in-volved. The Ministry of Research and Technology (BMFT), the persons in charge of the project executing organization as well as local and national newspapers pursued the ongoing activities with strong interest. As a high point the national assignment for organizing the 16th Conference of the Com-mittee on Space Research to be held 1973 in Konstanz was delegated to the APW, indeed a great honor and a big chal-lenge at the same time.
For several reasons Karl Rawer has chosen Konstanz as venue. In a relative small town attendees can meet each other easier. The city was not destroyed during the Second World War. It is an interesting historical medieval city lake-side of the Lake Constance at the border to Switzerland. And, the conference locations have been close to each other in rather beautiful buildings and sites. For the young scientists of the APW it was an important opportunity to present the latest re-sults from the Veronique and other rocket launches as well as from the AEROS satellite mission. Based on these successes the APW became the Fraunhofer Institut für Physikalische Weltraumforschung (IPW) in 1973. By the end of the year the staff moved into the new building. In addition to the laboratories with big EUV equipment with vacuum tanks the large plasma simulation chamber and the large auroral-airglow simulation chamber were installed and operated.
During the successful mission of AEROS from Decem-ber 1972 to August 1973 the EUV Spectrometer recorded a decreasing solar photon flux of about 25 % as shown in Fig. 7 (Schmidtke, 1984). For in-space calibration purposes
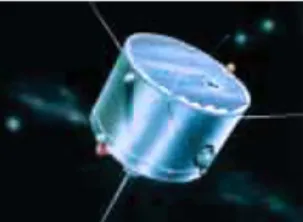
Figure 6. Picture of the AEROS satellite.
the large photocathodes of the Bendix multipliers were ex-posed to a nickel 63 radioactive beta source (Schmidtke et al., 1974).
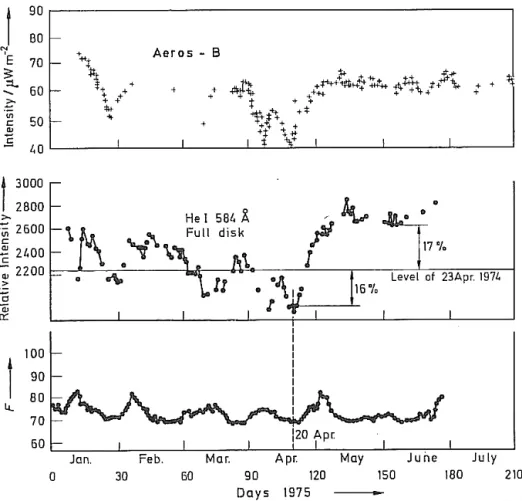
During the solar minimum that occurred in 1975 an un-expected change of the solar EUV flux was observed with a distinct minimum. During this period a rather poor corre-lation between the EUV fluxes and theF10.7cm index was noted.
Based on the AEROS findings and on those from other missions it was decided to start the follower mission of AEROS-B with the mission period lasting from July 1974 to September 1975.
End of 1979 Karl Rawer retired. In his institute a great number of experiments with the data evaluation have been accomplished: 15 different scientific instruments provided the basis for 121 rocket and 4 satellite experiments. In ad-dition the Retarding Potential Analyzer measured interplan-etary and ionospheric plasma parameters aboard the Pioneer Venus Orbiter.
In 1980 the institute was renamed to Fraunhofer Insti-tut für Physikalische Messtechnik (IPM) with a change of the fields of research. Space research was outsourced and stopped in the institute. The still on-going satellite project Airglow-Solar Spectrometer Instrument (ASSI) to be flown aboard the Italian-American San Marco 5 satellite has been worked on with Physikalisch-Technische Studien GmbH in the Karl-Rawer-Haus (Schmidtke et al., 1985). The Principal Investigator had the chance to lead the experiment outside of the IPM. In close cooperation with Tom Woods of Boulder an EUV-UV reference spectrum from 20 nm to 200 nm has been elaborated (Schmidtke et al., 1992).
Figure 7. Solar flux index EUV103−15, i.e. the flux intensity in the main EUV range of ionospheric interest (Schmidtke, 1984).
Figure 8. The solar “EUV Minimum” between solar cycles 20 and 21 in April 1975 observed at 58.4 nm (He I) on satellites AE-C and AEROS-B (Schmidtke, 1984).
of about 10 % or even less. For example, modeling the data from the satellite SNOE (Solomon et al., 2000) solar flux data as published by Hinteregger et al. (1981) had to be mul-tiplied by a factor of four below 25 nm for matching SNOE observations and modeling.
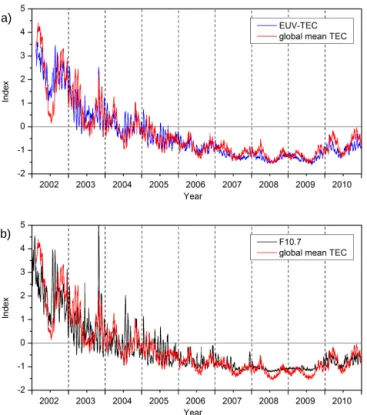
b)
Figure 9. Time series of computed daily global TEC values based on measured daily EUV-TEC indices are compared with measured global mean TEC data in the upper panel. Time series of computed daily global TEC values based on the F10.7index are compared with measured global mean TEC data in the lower panel. Data are normalised by mean and standard deviation from 2002–2007 (after Unglaub et al., 2011).
Columbus Module
Figure 10a. The International Space Station and the Columbus Module (Courtesy of NASA/ESA).
3 Solar EUV spectroscopy: state of the art
With the launch of the satellite TIMED in December 2001 (Woods et al., 2005), of the payload ISS-SOLAR aboard the Columbus Module at the International Space Station (ISS) with the instrument SolACES in April 2008 (Schmidtke et
Figure 10b. The SOLAR payload at the Columbus Module (Cour-tesy of NASA/ESA).
Figure 10c. The ISS/SolACES instrument at the SOLAR payload (Courtesy of NASA/ESA).
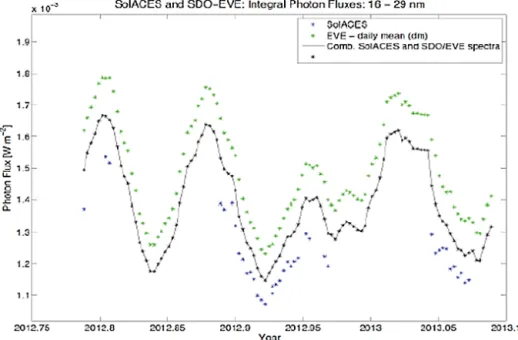
Figure 11a. SDO/EVE flux data (green dots) and ISS/SolACES flux data (blue dots) are averaged (black dots) for nearly four solar rotations in November 2012–January 2013.
Figure 11b. Selected wavelengths of the combined SolACES and SDO/EVE flux data are compared with theF10.7cm index (see+marking in black color) for nearly four solar rotations in November 2012–January 2013.
The correlation of the measured with the computed TEC val-ues is higher with the EUV data than with the F10.7index.
Deviations are most pronounced during solar minimum ac-tivity (Unglaub et al., 2011). The contribution of solar
parti-cle fluxes to the global TEC values is not taken into account in the computed TEC data.
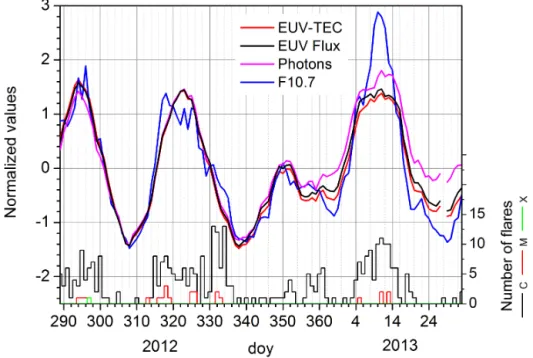
Figure 12. EUV-TEC proxy (red), based on combined SolACES and SDO-EVE spectra (17–105 nm) as shown in Fig. 11. Also shown are EUV flux (black) and photon fluxes (magenta). The data are based on EUV spectra from 17–105 nm.F10.7(blue) solar proxy is also added. All values are normalised by the data from day #299 through day #326 (approx. Carrington rotation #2143). In the lower part, the daily number of flares is shown.
and in related fields higher radiometric accuracy of long-term data sets is required. With the advent of world-wide use of satellite-born navigation systems the implementation of EUV-based ionospheric models for correcting the temporal retardation of the signals on its way from the GNSS satel-lite to the detectors on ground required is calling for on-line measurements of the solar EUV fluxes. In view of these re-quirements the following part is focused on the data derived from the three instruments mentioned before.
The instruments TIMED/SEE and SDO/EVE provide EUV data almost for every day. SEE is operating since begin-ning of 2002 and EVE started measurements in May 2010. ISS-SOLAR/SolACES is launched in April 2008 measuring periodically with regular ISS-SOLAR operational gaps be-tween the solar viewing windows (see below). These three instruments are still in operation.
Though the spectrometers are cross-calibrated (SEE and EVE once per years) and re-calibrated (SolACES up to every day during operation), degradation of the instruments is still a problem.
In order to elaborate a reference data set to propose for use in the science and application communities SDO/EVE and ISS-SOLAR/SolACES solar flux data of the spectral interval from 16 nm to 29 nm and of some selected solar emissions are averaged as a first approach (see Figs. 11a and b). The range of uncertainty of both data sets is quoted to about 10 %. In Fig. 12, the number of photons, EUV flux, and cal-culated ionization (EUV-TEC) is shown together with the
F10.7 index. These data are normalized by the values from
one solar rotation. In general, F10.7 fairly well reproduces EUV variability. During times of enhanced solar flare ac-tivity, however,F10.7tends to overestimate the EUV while
during times of low solar activity F10.7 tends to
underesti-mate the EUV variability (see Fig. 9). The data set will be extended up to the latest measurements and back to the first measurements accomplished by TIMED/SEE. This way it is expected to compile an EUV data set covering more than 11 years.
4 EUV spectroscopy: future application in GNSS data evaluation
With the presentation of an EUV data set covering 11 years studies of implementation EUV data in ionospheric-thermospheric and semi-empirical EUV modeling can be started with the goal to provide improved EUV fluxes for a wide range of applications. Because providing measured EUV SSI data is still a complex and costly task, it is indis-pensable to develop a reliable low-cost EUV detector pro-viding EUV data on-line. For GNSS data evaluation such a system should be placed aboard the GNSS satellites. It shall provide EUV data directly for computation of ionospheric TEC values and feeding the navigation data with a correc-tion for the propagacorrec-tion delays of navigacorrec-tion signals traveling through the ionosphere from space to earth.
Figure 13a. Laboratory sample of a SEPS sensor.
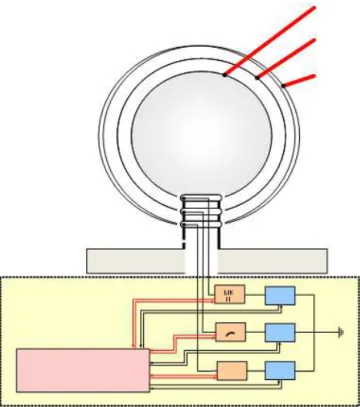
Spherical EUV and Plasma Sensor (SEPS) is providing one possibility for EUV monitoring. The device consists of three isolated spheres. A highly transparent Inner Grid (IG) and an Outer Grid (OG) are placed around the metallic sphere (MS) with a long-term low level of degradation forming three electrodes (Fig. 13). Each one is being connected to sensi-tive floating electrometers. EUV photons hitting the metallic sphere generate photoelectrons. Varying the voltage poten-tial of the metallic sphere while the potenpoten-tials of the outer and inner grids are constant, the evaluation of the photoelec-tron currents from the three electrodes allow to derive the incoming EUV photon flux. This sensor has been tested in the ESTEC plasma chamber in combination with a Langmuir Probe, in the SolACES test chamber and at the BESSY elec-tron synchroelec-tron.
The development of a low-cost EUV sensor is one of the requests of the TIGER program (Schmidtke et al., 2006). The combination with sophisticated instrumentation like SEE, EVE, SolACES or Solar Patrol (Avakyan, 2006) would meet the most important requirements for the next decade.
5 Summary
After 50 years of SSI EUV research there is a promising work going on to provide the first validated set of EUV data cover-ing more than 11 years comparable with the period of a solar cycle. This data set is being established with SOHO/SEM, TIMED/SEE, SDO/EVE, and ISS-SOLAR/SolACES data. It shall be published at the TIGER/COSPAR Symposium in Moscow 2014.
From the first set of data covering three solar rotations as shown in Fig. 11 an EUV TEC proxy has been derived (Fig. 12) as described by Unglaub et al. (2011). It will be fur-ther tested and correlated with ionospheric data from ground based measurements at the International Centre for Theoreti-cal Physics in Trieste, Italy.
Figure 13b. Schematics of the SEPS Sensor – three blue areas: volt-age Supplies; three orange areas: ampere meters; pink area: control electronics and data management.
As next step the on-orbit verification of the SEPS sen-sor for producing online EUV data is envisaged for later use aboard GNSS satellites for direct signal processing replacing
F10.7by an EUV-TEC proxy.
Acknowledgements. Gerhard Schmidtke wishes to acknowledge the unbroken support by Professor Dr. Dr. h. c. Karl Rawer from 1960 until his retirement end of 1979. Until these days it has been and it still is always a great pleasure to meet and to communicate with this open-minded and well-known scientist.
The SolACES project is sponsored by DLR Bonn, by ESA/ESTEC Noordwijk and by the Fraunhofer Institute for Mea-suring Technique.
We thank C. Unglaub and J. Hein, Leipzig, for preparing EUV-TEC data. Flare numbers have been provided by NOAA, Space Weather Prediction Center, through http://www.swpc.noaa. gov/ftpdir/indices/. F10.7 solar indices have been provided by NGDC through ftp://ftp.ngdc.noaa.gov/STP/SOLAR_DATA/.
We greatly appreciate the stimulation provided by the referees Prof. Andrei Mikhailov and Prof. Jens Taubenheim improving the content of this publication.
Edited by: M. Förster
trometer spectrograph telescope system, Proceed. Society Photo-Optical Instrumentation Engineers, 184, 270–277, 1979. Fischer, F.: Erfahrungen mit offenen UV-Zählrohren im
Wellenlän-genbereich zwischen 900 und 1300 Å, Optik, 27, 1–4, 1968. Hinteregger, H. E., Hall, L. A., and Schmidtke, G.: Solar XUV
radi-ation and neutral particle distribution in July 1963 thermosphere, Space Res., V, 1175–1190, 1965.
Hinteregger, H. E., Fukui, K., and Gilson, B. R.: Observational ref-erence and model data on solar EUV from measurements on AE-E, Geophys. Res. Lett., 8, 1147–1150, 1981.
Landensperger, W.: Auroral luminosity profile in the far ultraviolet, Space Res., XI, 1190–1195, 1971.
Schmidtke, G.: Soller-Blendensysteme als Kollimatoren und Beu-gungsfilter, Zeitschrift für angewandte Phys., 25, 314–318, 1968. Schmidtke, G.: Spektrale Anpassung von Beugungsfiltern durch den Strahlungsbündelungseffekt, Optik, 28, 578–584, 1968/69. Schmidtke, G.: EUV-Laborspektrophotometrie zur Vorbereitung
von optischen Flugexperimenten, Zeitschrift für Geophysik, 35, 69–82, 1969.
Schmidtke, G.: Diffraction filters in XUV spectroscopy, Appl. Phys., 9, 447–450, 1970.
Schmidtke, G.: New techniques for differential pumping systems, The Rev. of Scient. Instrum., 42, 1431–1433, 1971.
Schmidtke, G.: EUV indices for solar-terrestrial relations, Geophys. Res. Lett., 3, 573–576, 1976.
Schmidtke, G.: Modeling of the solar extreme ultraviolet irradiance for aeronomic applications, Encyclopedia of Physics, XLIX/7: Geophysics III, Part VII, edited by: Rawer, K., 1–55, 1984. Schmidtke, G.: Solar EUV irradiance from the San Marco ASSI: A
reference spectrum, Geophys. Res. Lett., 19, 2175–2178, 1992. Schweizer, W. and Schmidtke, G.: High-resolution
extreme-ultraviolet solar spectrum recorded with a diffraction-filter spec-trograph, The Astrophys. J., 169, L27–L29, 1971.
1975.
Schmidtke, G., Nikutowski, B., Jacobi, Ch., Brunner, R., Erhardt, Ch., Knecht, S., Scherle, J., and Schlagenhauf, J.: Solar EUV Ir-radiance Measurements by the Auto-Calibrating EUV Spectrom-eters (SolACES) aboard the International Space Station (ISS), Solar Physics, 288/2, doi:10.1007/s11207-013-0430-5, 2014. Schmidtke, G., Schweizer, W., and Knothe, M.: The AEROS-EUV
Spectrometer, J. Geophys., 40, 577–584, 1974.
Schmidtke, G., Seidl, P., and Wita, C.: Airglow-solar spectrometer instrument (20–700 nm) aboard the San Marco D satellite, Appl. Opt., 24, 3206–3213, 1985.
Solomon, S. C., Bailey, S. M., and Woods, T. N.: Effects of solar X-rays on the lower ionosphere, Geophys. Res. Lett., 28, 2149– 2152, 2000.
Unglaub, C., Jacobi, Ch., Schmidtke, G., Nikutowski, B., and Brun-ner, R.: EUV-TEC proxy to describe ionospheric variability us-ing satellite-borne solar EUV measurements: First results, Adv. Space Res., 47, 1578–1584, 2011.
Woods, T. N., Francis, G. E., Bailey, S. M., Chamberlin, P. C., Lean, J., Rottmann, G. J., Solomon, S. C., Tobiska, W. K., and Woodraska, D. L.: Solar EUV Experiment (SEE): Mis-sion overview and first results, J. Geophys. Res., 110, A01312, doi:10.1029/2004JA010765, 2005.