www.hydrol-earth-syst-sci.net/17/4925/2013/ doi:10.5194/hess-17-4925-2013
© Author(s) 2013. CC Attribution 3.0 License.
Hydrology and
Earth System
Sciences
Regional GRACE-based estimates of water mass variations over
Australia: validation and interpretation
L. Seoane1, G. Ramillien1, F. Frappart1, and M. Leblanc2,3
1Géosciences Environnement Toulouse GET – UMR5563, CNRS, Université de Toulouse UPS,
GRGS, 14, Avenue E. Belin, 31400 Toulouse, France
2School of Earth & Environmental Sciences, James Cook University, Cairns, 4878, QLD, Australia 3ANR, IRD UMR G-EAU, IRSTEA 34000 Montpellier, France
Correspondence to:L. Seoane ([email protected])
Received: 13 March 2013 – Published in Hydrol. Earth Syst. Sci. Discuss.: 29 April 2013 Revised: 18 October 2013 – Accepted: 22 October 2013 – Published: 6 December 2013
Abstract.Time series of regional 2◦×2◦Gravity Recovery
and Climate Experiment (GRACE) solutions have been com-puted from 2003 to 2011 with a 10-day resolution by using an energy integral method over Australia (112◦E–156◦E; 44◦S–10◦S). This approach uses the dynamical orbit anal-ysis of GRACE Level 1 measurements, and specially accu-rate along-track K-band range accu-rate (KBRR) residuals with a 1 µm s−1level of errors, to estimate the total water mass over continental regions. The advantages of regional solutions are a significant reduction of GRACE aliasing errors (i.e. north– south stripes) providing a more accurate estimation of water mass balance for hydrological applications. In this paper, the validation of these regional solutions over Australia is pre-sented, as well as their ability to describe water mass change as a response of climate forcings such as El Niño. Princi-pal component analysis of GRACE-derived total water stor-age (TWS) maps shows spatial and temporal patterns that are consistent with independent data sets (e.g. rainfall, cli-mate index and in situ observations). Regional TWS maps show higher spatial correlations with in situ water table mea-surements over Murray–Darling drainage basin (80–90 %), and they offer a better localization of hydrological structures than classical GRACE global solutions (i.e. Level 2 Groupe de Recherche en Géodésie Spatiale (GRGS)) products and 400 km independent component analysis solutions as a lin-ear combination of GRACE solutions provided by different centers.
1 Introduction
detection quality of true water mass signals into other time frequencies, and makes these signals indistinguishable once they are sampled. In the case of GRACE, aliasing is compli-cated since mass variations occur both in time and space, but they are sampled mainly along satellite tracks in the nearly latitudinal direction, and represented through global spheri-cal harmonic (SH) functions afterwards. The particular dis-tribution of the GRACE tracks due to the single polar orbit geometry translates into north–south “stripes” on the 10-day and monthly gravity field solutions, by the fact that the abil-ity of such an orbit configuration for recovering short-term mass and small variations is limited. The determination of the GRACE–Stokes coefficients leads to underdetermined sys-tems of normal equations to be solved, by creating correla-tions between SH of high degrees (i.e.>10–15) (see Swen-son and Wahr, 2006), and amplification of the orbit error and the data noise (Himanshu et al., 2012). Another serious draw-back of using SH functions for representing the gravity field is “leakage”, as energetic signals propagate on the entire ter-restrial sphere, since SH are defined as global undulations, and thus they come to pollute the water mass estimates in the geographical region of interest. This is particularly the case for a small region (i.e. typically about 1 millions of square km), whereas averaging over a large area, such as the Aus-tralian continent, surely cancels the spurious SH undulations from outside. Filtering techniques can partly remove some of these effects (Swenson et al., 2006; Klees et al., 2008; Frap-part et al., 2011). New regional GRACE solutions using an energy integral method (Ramillien et al., 2011, 2012) yield to significant gains in the accuracy and resolution of total wa-ter storage estimates compared to classical strategies using the spherical harmonics. The present study aims to validate these new regional solutions over Australia, the driest inhab-ited part of the world. On average, the seasonal amplitude of total water storage (TWS) in Australia is 3 times lower than the one observed in the Amazon. Thus, the challenge for us is to detect realistic structures while noise amplitude in GRACE data is closer to the amplitude of the true ter mass variations over this continent. We propose that wa-ter storage variations from regional solutions over Australia are compared with independent information given by the in situ observations (rainfall, surface water storage groundwa-ter levels). GRACE products have already been used to study time variations of water mass storages and transfers over Australia. In addition, the GRACE-based water storage so-lutions have been used to evaluate the accuracy of model es-timates (Van Dijk et al., 2011; Forootan et al., 2012). Syed et al. (2008) used GRACE data to estimate a depletion of 1.3 mm month−1of total water storage in Australia. Leblanc et al. (2009) used GRACE global solutions to analyze the im-pact of the 2007 Millennium Drought on the water resources in the Murray–Darling Basin. Awange et al. (2009) noted the typically small hydrological signals in Australia that are not detectable because of errors in the standard GRACE data processing (e.g. oceanic non-tidal model deficiencies) and
120˚ 120˚
130˚ 130˚
140˚ 140˚
150˚ 150˚
−40˚ −40˚
−30˚ −30˚
−20˚ −20˚
−10˚ −10˚
Murray−Darling basin
Gulf of Carpentaria drainage area
Georgina river
Diamantina river
Low precipitation
region
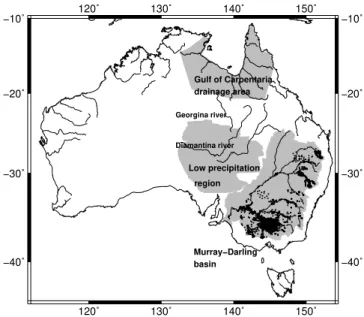
Fig. 1.Australian drainage regions used in our study. Geographical locations of the bores in the Murray–Darling are marked as black circles. They represented, with at least 60 % of data period popu-lated (because of their availability during the period 2002–2009), averages of the first 30 m of the water column height.
isotropic filtering methods. Tregoning et al. (2008) showed the propagation of error of non-tidal oceanic modelling in the Gulf of Carpentaria onto the continent in the northern pat of Queensland and Northern Territory states. Frappart et al. (2011) proposed a filtering technique based on indepen-dent component analysis (ICA) that reproduced better the in situ observations over the Murray–Darling Basin than the Level-2 GRACE GFZ, CSR and JPL solutions when these data sets are used individually.
Our regional approach, based on the energy integral method, can potentially improve further the accuracy of GRACE TWS estimations. Over South America, Ramillien et al. (2012) have shown that this regional approach offers a reduction of both north–south striping due to the distribution of GRACE satellite tracks, and temporal aliasing of correct-ing models. Besides, regional solutions present more realistic spatial and temporal patterns than the global ones when com-pared to in situ data sets (Frappart et al., 2013b).
2003 2004 2005 2006 2007 2008 2009 2010 2011 -300
-200 -100 0 100 200 300
mm EWH
(a) long wavelength loss
(b) long wavelength signal (degree= 6) (c) difference (a)-(b)
2003 2004 2005 2006 2007 2008 2009 2010 2011
-300 -200 -100 0 100 200 300
mm EWH
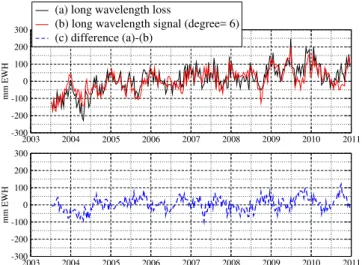
Fig. 2.Water mass time series averaged over Australia:(a)
differ-ence between regional and GRGS solutions,(b)GRGS GRACE
so-lutions up to degree 6, and(c)their difference (RMS value 39 mm).
For further validation, we compared the regional solutions to three in situ and modelled hydrology data sets: (1) rainfall across the continent; (2) surface and subsurface storage in the Murray-Darling Basin (see Fig. 1); (3) soil moiture de-rived from australian hydrologic model. The conclusion of our analysis is given in Sect. 4.
2 Data sets
2.1 GRACE land water products
2.1.1 Global Level 2 solutions from GRGS
We compare the solutions derived from integral energy ap-proach to the classical global solutions computed by the GRGS in Toulouse. The Level 2 GRGS-EIGEN-GL04 10-day models are derived from Level 1 GRACE measure-ments including KBRR and from LAGEOS-1/2 SLR data for enhancement of lower harmonic degrees (Bruinsma et al., 2010). These gravity fields are expressed in terms of normal-ized spherical harmonic coefficients of the geopotential (or Stokes coefficients) from degree 2 up to degree 50 using an empirical stabilization approach without any post-processing smoothing or filtering. Spherical harmonics up to degree 50 and the corresponding 10-day global equivalent water height (EWH) maps of 1◦spatial resolution which describe surface water mass change for 2002–2012, are available for the last release (RL02) at http://grgs.obs-mip.fr.
In the present study spatial means of TWS over a specific drainage basinδψ (1t )for the 10-day period1t, such as the Murray–Darling, is computed as the scalar product of the wa-ter mass coefficientsδCnm,δSnmwithAnmandBnmthat are
the normalized harmonic coefficients of the considered
geo-graphical mask (Wahr et al., 1998; Ramillien et al., 2006b):
δψ (1t )=4π R2 N
X
n=1
M
X
m=0
{AnmδCnm(1t )+BnmδSnm(1t )}, (1)
whereRis the Earth’s mean radius (≈6371 km). TWS vari-ations can be expressed in terms of equivalent water height changes ifδψis divided by the area of the drainage basin.
2.1.2 Global Level 2 solutions from CSR, GFZ and JPL
filtered using an ICA approach
For further comparison, a post-processing method based on independent component analysis (ICA) was applied to the Level 2 GRACE solutions from different official providers (i.e. UTCSR, JPL and GFZ) pre-filtered with 400 km ra-dius Gaussian filters. Before applying an ICA, the Level-2 GRACE solutions need to be somehow low-pass filtered not to have Gaussian distribution. When they are not filtered enough, they are still dominated by striping and their dis-tribution keeps being Gaussian. If they are too low-pass fil-tered, they correspond the long wavelengths of the continen-tal hydrology and they also exhibit Gaussianity. Thus, the good compromise of 350–400 km to ensure non-Gaussianity has been found by Frappart et al. (2011) after several ICA tests to extract most of the part of the continental hydrology. Time series of ICA-based global maps of continental water mass changes from combined global UTCSR, JPL and GFZ GRACE solutions, computed over the period March 2003– December 2010, are used in this study (Frappart et al., 2010, 2011). For a given month, the ICA 400 km-filtered solu-tions only differ from a scaling factor, so that only the GFZ-derived ICA 400 km-filtered solutions are presented.
2.1.3 Regional solutions
−40˚ −20˚
−40˚ −20˚
120˚ 140˚ −40˚ −20˚
120˚ 140˚ 120˚ 140˚ 120˚ 140˚ 120˚ 140˚ 120˚ 140˚ −210 −180 −150 −120 −90 −60 −30 0 30 60 90 120 150 180 210
mm EWH
04/12/08−13/12/0814/12/08−23/12/08 24/12/08−02/01/09 03/01/09−12/01/0913/01/09−22/01/0923/01/09−01/02/09
02/02/09−11/02/0912/02/09−21/02/09 22/02/09−03/03/09 04/03/09−13/03/0914/03/09−23/03/0924/03/09−02/04/09
03/04/09−12/04/0913/04/09−22/04/09 23/04/09−02/05/09 03/05/09−12/05/0913/05/09−22/05/0923/05/09−01/06/09
−40˚ −20˚
−40˚ −20˚
120˚ 140˚ −40˚ −20˚
120˚ 140˚ 120˚ 140˚ 120˚ 140˚ 120˚ 140˚ 120˚ 140˚ −210 −180 −150 −120 −90 −60 −30 0 30 60 90 120 150 180 210
mm EWH
02/06/09−11/06/0912/06/09−21/06/09 22/06/09−01/07/09 02/07/09−11/07/0912/07/09−21/07/0922/07/09−31/07/09
01/08/09−10/08/0911/08/09−20/08/09 21/08/09−30/08/09 31/08/09−09/09/0910/09/09−19/09/0920/09/09−29/09/09
30/09/09−09/10/0910/10/09−19/10/09 20/10/09−29/10/09 30/10/09−08/11/0909/11/09−18/11/0919/11/09−28/11/09
Fig. 3.Time series of regional maps of water mass from Decem-ber 2008 to NovemDecem-ber 2009. We notice the annual signal with am-plitude of±250 mm of EWH representing the alternating wet and dry seasons.
of known hydrological units such as individual groundwa-ter layers (Frappart et al., 2013b). These KBRR residuals were obtained by correcting the raw observations from the a priori gravitational accelerations of known large-scale mass variations (i.e. atmosphere and oceanic mass variations, po-lar movements, solid and oceanic tides) as well as the static gravity field of the Earth, during the iterative least-squares orbit adjustement made by the GINS (Géodésie par Intégra-tions Numériques Simultanées) software (Bruinsma et al., 2010). The effects of non-conservative forces measured by on-board GRACE accelerometers are also removed from the along-track observations, in order to get the contributions of unmodelled phenomena, thus mainly water mass changes in continental hydrology. In order to reduce unrealistic or-bit error at fractions of the satellite revolution period, and thus to avoid instabilities in the inversion of regional solu-tions, the GRACE-based DPA tracks passing over Australia are linearly detrended first. This operation locally absorbs orbit error and keeps a subset of short and medium
(a) Linear trends
120˚ 120˚
130˚ 130˚
140˚ 140˚
150˚ 150˚
−40˚ −40˚
−35˚ −35˚
−30˚ −30˚
−25˚ −25˚
−20˚ −20˚
−15˚ −15˚
−10˚ −10˚
−20 −15 −10 −5 0 5 10 15 20
mm EWH per year
(b) Amplitude of seasonal cycle
120˚ 120˚
130˚ 130˚
140˚ 140˚
150˚ 150˚
−40˚ −40˚
−35˚ −35˚
−30˚ −30˚
−25˚ −25˚
−20˚ −20˚
−15˚ −15˚
−10˚ −10˚
0 25 50 75 100 125 150
mm of EWH
Fig. 4. (a)Linear trends and(b) annual amplitudes derived from GRACE-based regional solutions for 2003–2009.
2003 2004 2005 2006 2007 2008 2009 2010 2011 0
20 40 60 80 100
mm of monthly rainfall
(a) Rainfall histogram 2003-2011
2003 2004 2005 2006 2007 2008 2009 2010 2011 -40
-20 0 20 40
mm EWH
Regional Solution (sigma=19.11 mm) ICA filtered solution (sigma=12.4 mm) GRGS RL02 (sigma=16.3 mm)
(b) TWS mean at desert region over the driest periods
Fig. 5.Time series of TWS means over the estimated desert region (central Australia) of 18 tiles, the largest signal amplitudes are lesser than 30 mm and the RMS value is of 19 mm.
lesser thanrand zero elsewhere). Introduction of spatial con-straints enables the ill-conditioned Newtonian matrix to be inverted, especially when the maximum radius remains large (>800 km), but leads to smoothing and thus the risk of losing details in the regional solutions. After several tests on these filtering effects on the regional estimate (see Ramillien et al., 2012), we chose a compromise by keeping realistic hydro-logical details and limiting the increase of numerical noise, therefore a radius ofr= 600 km is considered over continen-tal areas, and a longer radius ofr= 50 000 km over oceans in order to damp unrealistic oscillations efficiently. Follow-ing this latter regularization, time series of successive 10-day regional solutions of water mass have been produced over a region including the whole Australian continent (112◦E– 156◦E; 44◦S–10◦S) for 2003–2011. The idea for cancelling the lack of long wavelengths in the final 10-day regional solu-tions is to complete these solusolu-tions by adding the large-scale undulations of the GRGS solutions to them (Fig. 2). For this
120˚ 130˚ 140˚ 150˚
−40˚ −40˚
−30˚ −30˚
−20˚ −20˚
−50 −40 −30 −20 −10 0 10 20 30 40 50 mm EWH
−50 −40 −30 −20 −10 0 10 20 30 40 50 mm EWH
120˚ 130˚ 140˚ 150˚
−40˚ −40˚
−30˚ −30˚
−20˚ −20˚
120˚ 130˚ 140˚ 150˚
−40˚ −40˚
−30˚ −30˚
−20˚ −20˚
−50 −40 −30 −20 −10 0 10 20 30 40 50 mm EWH
−50 −40 −30 −20 −10 0 10 20 30 40 50 mm
120˚ 130˚ 140˚ 150˚
−40˚ −40˚
−30˚ −30˚
−20˚ −20˚
Mode 1 TWS Regional Mode 1 TWS GRGS RL02
Mode 1 TWS GFZ ICA Mode 1 Rainfall
Fig. 6.Spatial components of PCA 1st orthogonal mode.
2003 2004 2005 2006 2007 2008 2009 2010 2011 -1
-0.5 0 0.5
1 Regional solution Mode 1 (Var=0.60)
GRGS RL02 Mode 1 (Var= 0.67) GFZ ICA Mode 1 (Var=0 .52) BoM Rainfall Mode 1 (Var= 0.33)
(a) PCA
2003 2004 2005 2006 2007 2008 2009 2010 2011
-15 -10 -5 0 5 10 15
SOI interannual PDO interannual (scale x 10)
(b) Climate Index
Fig. 7. (a) Temporal components of PCA 1st orthogonal mode.
(b)Interannual variations of the Southern Oscillation Index (SOI) and Pacific Decadal Oscillation (PDO).
where the most important mass losses occur between 2003 and 2009, as Murray–Darling Basin and the Sandy desert, or mass gain, as around the Canning Basin (northwest of Aus-tralia) from 2003 to 2009. The mean annual amplitudes are obviously at a maximum in the tropics. During the dry pe-riods in the central desert (shown in Fig. 1) and based on the level of the low rainfall over six consecutive dry months which remains less than 30 mm monthly, (see Fig. 5a for time periods used); the expected TWS values can be considered as an indicator of the uncertainty level of our regional solu-tions. Fig. 5b reveals standard deviation values of 12–19 mm of EWH. Low values of ICA 400 km-filtered solutions are due to the smoothness of these combined products. Estimated values of regional and global GRGS solutions are close (i.e. 19 and 16 mm of EWH, respectively).
120˚ 130˚ 140˚ 150˚
−40˚ −40˚
−30˚ −30˚
−20˚ −20˚
−50 −40 −30 −20 −10 0 10 20 30 40 50 mm EWH
−50 −40 −30 −20 −10 0 10 20 30 40 50 mm EWH
120˚ 130˚ 140˚ 150˚
−40˚ −40˚
−30˚ −30˚
−20˚ −20˚
120˚ 130˚ 140˚ 150˚
−40˚ −40˚
−30˚ −30˚
−20˚ −20˚
−50 −40 −30 −20 −10 0 10 20 30 40 50 mm EWH
−50 −40 −30 −20 −10 0 10 20 30 40 50 mm
120˚ 130˚ 140˚ 150˚
−40˚ −40˚
−30˚ −30˚
−20˚ −20˚
Mode 3 TWS Regional Mode 2 TWS GRGS RL02
Mode 2 TWS GFZ ICA Mode 2 Rainfall
Fig. 8.Spatial components of PCA 3rd orthogonal mode of regional solutions and 2nd mode of GRGS, ICA 400 km-filtered solutions and rainfall product.
2.2 In situ and modelled hydrological data sets
Regional TWS estimates were also compared to in situ and modelled hydrological data sets. To be consistent with GRACE solutions we applied the so-called “boxcar” convo-lution filter of the Generic Mapping Tools (GMT) software (Wessel and Smith, 1998) which consists of spatially averag-ing all points inside a filter radius of 220 km in the neighbour-hood of the considered grid point (or nearly 2◦, consistently with GRACE resolution).
2.2.1 BoM rainfall product
Rainfall over Australia, from the Bureau of Meteorology (BoM) of the Australian Government, were used for com-parison against GRACE regional solutions following Rieser et al. (2010) who found a direct relationship between rainfall and GRACE surface mass changes. Rainfall observations are converted to monthly values and interpolated to geographic grids with the spatial resolution of 15′×15′ based on the Barnes successive-correction method (Jeffrey et al., 2001; Jones et al., 2009). Rainfall grids are available since 1967 using the site http://www.bom.gov.au.
2.2.2 Murray–Darling data sets
Groundwater
In situ estimates of groundwater storage (GWS) in the Murray–Darling Basin were obtained from an analysis of groundwater levels observed in government monitoring bores from 2002 to 2009. Variations in groundwater storage (1SGWS) were estimated from in situ measurements as
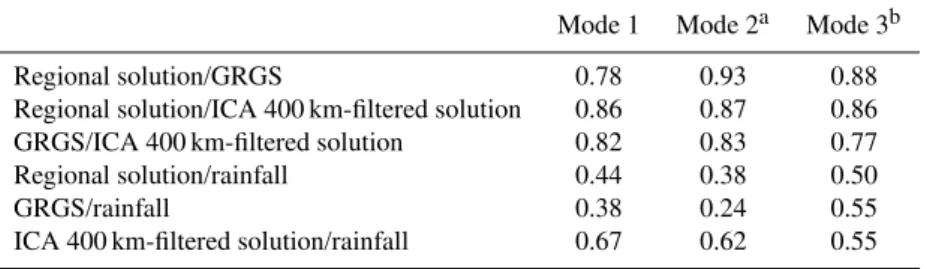
Table 1.Correlation values between PCA spatial components (mode 1, 2 and 3) of different GRACE-based data sets and rainfall BoM product.
Mode 1 Mode 2a Mode 3b
Regional solution/GRGS 0.78 0.93 0.88
Regional solution/ICA 400 km-filtered solution 0.86 0.87 0.86
GRGS/ICA 400 km-filtered solution 0.82 0.83 0.77
Regional solution/rainfall 0.44 0.38 0.50
GRGS/rainfall 0.38 0.24 0.55
ICA 400 km-filtered solution/rainfall 0.67 0.62 0.55
aExcept for regional solutions: here mode 3 is used to estimate correlation values.bExcept for regional
solutions: here mode 2 is used to estimate correlation values.
Table 2.Cross-correlation maxima values and corresponding temporal lag in number of months (second value in italic) between PCA temporal components (mode 1, 2 and 3) of different GRACE-based data sets regional solutions, GRGS and ICA 400 km-filtered solution, as well as rainfall BoM product. Data derived from regional and GRGS are filtered and interpolated to monthly resolution. The time lag represents the time delay between water mass variations derived from GRACE and the observed rainfall.
Mode 1 Mode 2a Mode 3b
Regional solution/GRGS 0.98,0 0.96,0 0.94,0
Regional solution/ICA 400 km-filtered solution 0.95,0 0.93,0 0.79,0
GRGS/ICA 400 km-filtered solution 0.97,0 0.89,0 0.64,0
Regional solution/rainfall 0.59,−1 0.19,6 0.64,4
GRGS/rainfall 0.64,−1 0.24,5 0.50,4
ICA 400 km-filtered solution/rainfall 0.70 ,0 0.33,1 0.73,4
aExcept for regional solutions: here mode 3 is used to estimate correlation values.bExcept for regional
solutions: here mode 2 is used to estimate correlation values.
where Sy is the aquifer specific yield and H is the
groundwater-level (L−1) observed in monitoring bores. Groundwater level data (H) were sourced from govern-ment departgovern-ments of the states covered by the Murray Dar-ling Basin (QLD, Natural Resources and Mines; NSW, De-partment of Water and Energy; VIC, DeDe-partment of Sus-tainability and Environment; and SA, Department of Wa-ter Land and Biodiversity Conservation). Only observation bores (production bores excluded) with an average saturated zone<30 m from the bottom of the screened interval were selected, as deeper bores can reflect processes occurring on longer timescales (Fetter, 2001). In the Murray and Darling drainage basins, changes in groundwater levels were com-puted at three- and six-month time steps, respectively. Only bores with at least 80 % of the time periods populated with groundwater levels were selected for the analysis (1470 bores in the Murray and 958 bores in the Darling, Fig. 1).
The median of the groundwater level for each time pe-riod was first calculated at each bore and any change at a bore was computed as the difference of median groundwater level between two consecutive periods. A spatial interpola-tion of the groundwater level change between two consecu-tive periods was performed across the basin using a kriging technique (Isaaks and Srivastava, 1989). Spatial averages of groundwater level change were computed for each aquifer group. The Murray–Darling drainage basin comprises
sev-eral unconfined aquifers that can be regrouped into 3 groups according to their lithology. The specific yieldSyin Eq. (2)
is estimated for each group: a range from 5 to 10 % for the clay sand unconfined aquifer group (Macumber, 1999; Cresswell et al., 2003; Hekmeijer and Dawes, 2003a; CSIRO, 2008); from 10 to 15 % for the shallow sandy clay unconfined aquifer group (Macumber, 1999; Urbano et al., 2004); and from 1 to 10 % for the fractured rock aquifer group (Cress-well et al., 2003; Hekmeijer and Dawes, 2003b; Smitt et al., 2003; Petheram et al., 2003). In situ estimates of changes in groundwater storage are calculated using the spatially av-eraged change in groundwater level for an aquifer group and the mean value of the specific yield for that group. The range of possible values for the specific yield was used to estimate the uncertainty. Groundwater changes in the deep, confined aquifers (mostly Great Artesian Basin and Ren-mark aquifers) are either due to: (1) a change in groundwa-ter recharge at unconfined outcrop; (2) shallow pumping at unconfined outcrop; or (3) deep pumping in confined areas for farming (irrigation and cattle industry). Total pumping from the deep, confined aquifers was estimated to amount to −0.42 km3yr−1in 2000 (Ife and Skelt, 2004), while
2003 2004 2005 2006 2007 2008 2009 2010 2011 -1
-0.5 0 0.5 1
Regional solution Mode 3 (Var=0.13) GRGS RL02 Mode 2 (Var= 0.17) GFZ ICA Mode 2 (Var= 0.18) BoM Rainfall Mode 2 (Var= 0.27)
(a) PCA
meters
2003 2004 2005 2006 2007 2008 2009 2010 2011
-0.2 -0.1 0 0.1 0.2
meters
Murray- Darling Basin Murray Basin Darling Basin
(b) Groundwater level observations over Murray-Darling
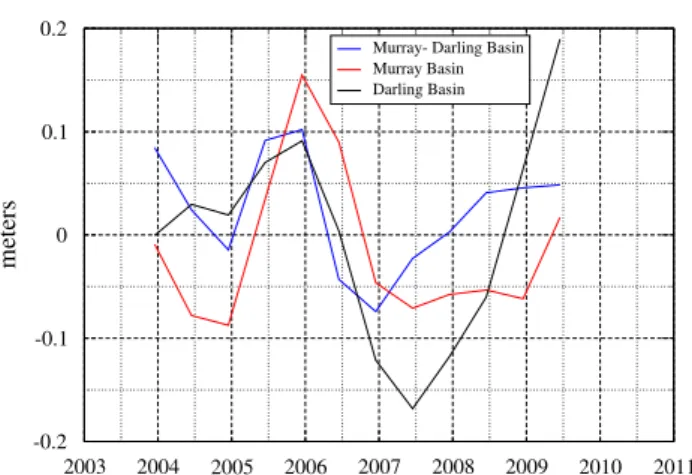
Fig. 9. (a)Temporal components of PCA 3rd orthogonal mode of regional solutions and 2nd mode of GRGS, ICA 400 km-filtered so-lutions and rainfall product.(b) Groundwater levels from in situ measurements over Murray–Darling Basin.
series, assuming the−0.42 km3yr−1pumping rate remained constant during the study period.
Surface water
In the predominantly semiarid Murray–Darling Basin, most of the surface water (SW) was stored in a network of reser-voirs, lakes and weirs (Kirby et al., 2006). A daily time se-ries of the surface water storage in the network of reservoirs were obtained from the Murray–Darling Basin Commission and the state governments from 2002 to 2010. In our study we used these series as a component of total water storage estimated from the in situ measurements.
Soil moisture derived from AWRA hydrologic model
Soil moisture (SM) was derived from the Australian Water Resources Assessment (AWRA) hydrologic model (Van Dijk and Renzullo, 2011; Van Dijk et al., 2011). The system
com-120˚ 130˚ 140˚ 150˚
−40˚ −40˚
−30˚ −30˚
−20˚ −20˚
−50 −40 −30 −20 −10 0 10 20 30 40 50 mm EWH
−50 −40 −30 −20 −10 0 10 20 30 40 50 mm EWH
120˚ 130˚ 140˚ 150˚
−40˚ −40˚
−30˚ −30˚
−20˚ −20˚
120˚ 130˚ 140˚ 150˚
−40˚ −40˚
−30˚ −30˚
−20˚ −20˚
−50 −40 −30 −20 −10 0 10 20 30 40 50 mm EWH
−50 −40 −30 −20 −10 0 10 20 30 40 50 mm
120˚ 130˚ 140˚ 150˚
−40˚ −40˚
−30˚ −30˚
−20˚ −20˚
Mode 2 TWS Regional Mode 3 TWS GRGS RL02
Mode 3 TWS GFZ ICA Mode 3 Rainfall
Fig. 10.Spatial components of PCA 2nd orthogonal mode of re-gional solutions and 3rd mode of GRGS, ICA 400 km-filtered solu-tions and rainfall product.
2003 2004 2005 2006 2007 2008 2009 2010 2011
-1 -0.5 0 0.5 1
Regional sol. Mode 2 (Var= 0.15) GRGS RL02 (Var= 0.09) ICA filtered sol. (Var= 0.10) BoM Rainfall (Var= 0.13) PCA
Mode 3
Fig. 11.Temporal components of PCA 2nd orthogonal mode of re-gional solutions and 3rd mode of GRGS, ICA 400 km-filtered solu-tions and rainfall product.
bines a comprehensive spatial hydrological model with me-teorological forcing data and remotely sensed land surface properties. Outputs are grid-based, covering the whole Aus-tralian continent with a spatial resolution of nearly 5 km and a daily time step grids from 2003 to 2011.
3 Results and discussion
3.1 PCA of the GRACE data sets
120˚ 135˚ 150˚ −30˚
−15˚
120˚ 135˚ 150˚
−30˚ −15˚
120˚ 135˚ 150˚
−30˚ −15˚
120˚ 135˚ 150˚
−30˚ −15˚
120˚ 135˚ 150˚
−30˚ −15˚
120˚ 135˚ 150˚
−30˚ −15˚
120˚ 135˚ 150˚
−30˚ −15˚
−150 −100 −50 0 50 100 150
mm EWH
120˚ 135˚ 150˚
−30˚ −15˚
0 50 100 150 200
mm
09−2010 07−2010
(a) Regional solution
(b) GRGS solution
(c) ICA solution
(d) Rainfall
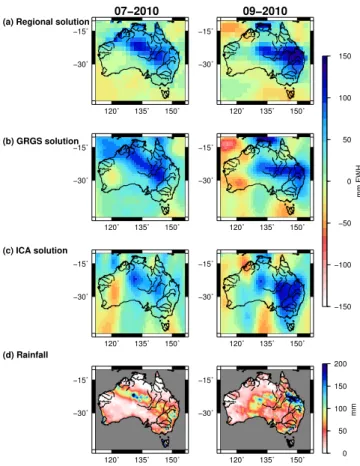
Fig. 12.Regional and GRGS RL02 of1TWS monthly maps esti-mated with respect to the mean map for the previous driest season (from June to November 2009), and rainfall maps. For these two pe-riods we notice that the regional solutions show a better localization of the exceptional rainfall maximum occurring in the central region of Australia.
Table 3.Correlation values between climate index and PCA first mode temporal patterns of regional, GRGS and ICA solutions.
SOI Index PDO index
Regional 0.73 −0.80
GRGS 0.70 −0.78
ICA 0.74 −0.72
an averaging window of 13 months. Figures 6, 8 and 10 present the spatial components of the three first modes that correspond to the most significant variability. The corre-sponding temporal components are presented in Figs. 7, 9 and 11. For the regional solutions, the first three modes of PCA explain variances of 60, 15 and 13 % of variability, re-spectively. Correlation values between the first modes of the different data sets are given in Table 1 for the spatial com-ponents and Table 2 for the temporal comcom-ponents, and their structures are discussed in the very next sections.
Table 4.Correlation (first value) and RMS of the difference (sec-ond value in italic) between time series over Murray and Darling computed from different GRACE solutions and the modelled/in situ estimates (SM + SW + GWS) using the maximum, mean and mini-mum values of the specific yield. RMS units are mm of EWH.
Murray
Regional GRGS ICA
Symin 0.92,16.27 0.87,20.27 0.87,24.96
Symean 0.92,24.03 0.88,25.10 0.85,36.03
Symax 0.92,34.35 0.89,33.72 0.84,47.47
Darling
Regional GRGS ICA
Symin 0.71,12.18 0.68,13.40 0.53,14.34
Symean 0.70,13.17 0.67,14.20 0.48,16.30
Symax 0.68,14.63 0.65,15.53 0.43,18.44
3.1.1 The first mode of TWS variability
130˚ 135˚ 140˚ 145˚ 150˚ −20˚
−15˚
−600 −400 −200 0 200 400 600
mm EWH/month
(a) Delta TWS from regional approach estimated as : TWS ( 24−12−08 / 02−01−09 ) minus TWS ( 03−01−09 / 12−01−09 )
130˚ 135˚ 140˚ 145˚ 150˚
−20˚ −15˚
−600 −400 −200 0 200 400 600
mm EWH/month
(b) Delta TWS from GRGS solutions estimated as : TWS ( 24−12−08 / 02−01−09 ) minus TWS ( 03−01−09 / 12−01−09 )
130˚ 135˚ 140˚ 145˚ 150˚
−20˚ −15˚
−600 −400 −200 0 200 400 600
mm EWH/month (c) Delta TWS derived from ICA
(January 2009 minus December 2008)
130˚ 135˚ 140˚ 145˚ 150˚
−20˚ −15˚
−600 −400 −200 0 200 400 600
mm/month (d) Rainfall anomaly of BoM
(January 2009 minus December 2008)
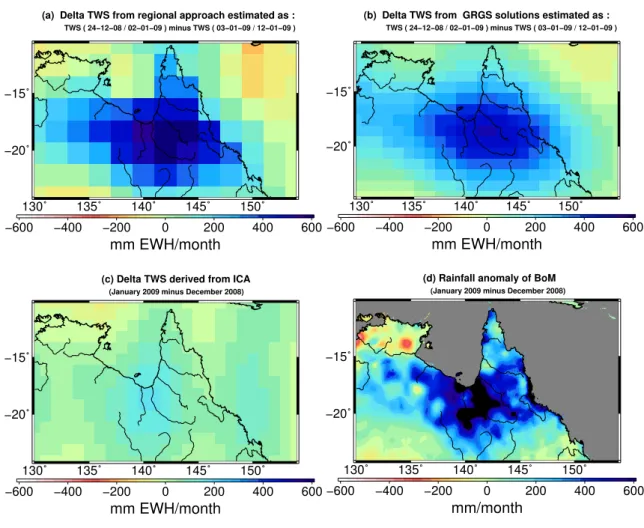
Fig. 13.1TWS time series map derived from regional solutions(a), from GRGS RL02(b), from ICA-filtered solutions(c)and rainfall anomalies for January 2009(d). We notice in January solutions the strong amplitudes in the Gulf of Carpentaria due to the floods caused by cyclone Charlotte (9 January–12 January 2009).
Drought affecting this region (Leblanc et al., 2009, 2011). The corresponding negative trend on the temporal compo-nent can be related to the cumulative effect of the prolonged drought from 2003 to 2009. The positive trend of water mass changes after 2010 indicates a gain of water mass in this southeastern part of Australia.
Climate indexes are also used to achieve the valida-tion. In fact, precedent studies show that Australian climate remains forced by these climate oscillations (Westra and Sharma, 2006). Strong correlations between oceanic indexes and GRACE TWS over Australia have been reported (e.g. García-García et al., 2011; Foorotan et al., 2012). The South Oscillation Index (SOI) and the Pacific Decadal Oscillation (PDO) interannual variations were smoothed out using the identical 13-month running average window, and then com-pared to the temporal components of the first modes (Fig. 7a and b). As illustrated in Table 3, high correlations (≈70 %) were found between these climatic indexes and the temporal components of the first TWS modes, suggesting the impor-tant role of these climate oscillations on the Australian
wa-ter mass storage variability at inwa-terannual timescales. Mantua and Hare (2002) compared the PDO index with rainfall data and suggested that warm phases of the PDO (positive values) coincide with anomalously dry periods in eastern Australia. The signature of this phenomenon can be seen in the spa-tial and temporal components of the first PCA mode over the Murray–Darling Basin (Figs. 6 and 7), and it is proba-bly the reason why the large negative correlations values are obtained (see Table 3).
3.1.2 The second and third modes
In the case of our regional solutions, the second and third modes explain a very similar percentage of total variance (i.e. 15 and 13 %, respectively), so we decided to invert their order for consistency with the modes from other solutions.
2003 2004 2005 2006 2007 2008 2009 2010 2011 -100
-50 0 50 100
mm
Regional solution GRGS RL02 ICA
Murray-Darling time series
Fig. 14.10-day and monthly time series of averaged total water storage over the whole Murray–Darling Basin from 2003 to 2011 computed from 10-day regional solutions (blue line), 10-day GRGS global solutions (red line) and monthly ICA 400 km-filtered solu-tions (green line).
Murray–Darling Basin and Lake Eyre in the centre of Aus-tralia. Looking at the temporal components in Fig. 9a, we notice that the strongest deficit happens in April 2006 and it can be interpreted as the maximum of severity of the Millen-nium Drought that has been observed (Leblanc et al., 2011). However, the low correlation values (spatial and temporal, see Tables 1 and 2) between GRACE products over the whole of Australia seem to indicate that the main amplitudes seen in the Murray–Darling Basin (see Fig. 8 spatial pattern and Fig. 9a temporal pattern) are probably related to the inter-annual groundwater level variations. Van Dijk et al. (2011) attributed the differences between GRACE data and AWRA model to deficiencies in the description of the groundwater dynamics. For our purpose, we derived interannual ground-water changes from in situ observations for comparison (see Sect. 2.2). They are obtained by computing the mean of observations over the Murray–Darling Basin, after the sea-sonal variations are removed using a running average win-dow. The water mass rate over the observation period 2003– 2010 are essentially presented in the first mode, as it is shown in Sect. 3.1.1. Then, the linear trend is also removed from groundwater observations in order to compare the residuals to the signals of second temporal mode. In Fig. 9a and b, we notice long-term consistency between the interannual varia-tions observed in mode 2 and the interannual groundwater level variations, especially over the Murray Basin: there is a maximum of water mass around 2006 for both, followed by a decrease until 2008 to finally reach a quite constant level. There are simple reasons that can explain the presence of the time shift of the 2006 peak: (1) the geographical area where the analysis is made is not the same, the comparison is made between groundwater interannual variations over Mur-ray Basin and the temporal mode 2 of GRACE which in-cludes the whole continent signal, so more signals are spa-tially averaged in the last case; (2) the localized distribu-tion of bores is clearly not homogeneous since they do not cover the complete region, the shortcoming being to miss a large portion of signal energy in uncovered areas, whereas the GRACE data have lower spacial resolution but their
cov-Fig. 15. (a) 3-month averaged time series of TWS over Murray Basin and(b)6-month averaged time series of TWS over Darling Basin for 2003–2010. Series are computed from GRACE-based re-gional solutions (blue line), GRGS RL02 (red line), ICA 400 km-filtered solutions (green line) and TWS estimated as groundwa-ter storage + surface wagroundwa-ter observations + modelled soil moisture (grey/black lines). Discontinuous grey line: maximum and min-imum values of the specific yield are used; continuous black line: mean value of specific yield is used.
erage made by the satellites along their tracks is surely more homogeneous; (3) and the lower resolution of GWS mea-surements due to gaps in the starting raw observations be-fore time averaging (6 months for the whole Murray–Darling Basin and 3 months for Murray Basin). The PCA spatial and temporal modes presented in Figs. 10 and 11 show positive variations located in the northwest part of Australia, which correspond to a gain of water mass related to an increase of rainfall (Li et al., 2009). As previously mentioned by Mu-nier et al. (2012), an interannual cycle of TWS appears over the Canning Basin. This long-term variation in the GRACE modes, shown in Figs. 10 and 11, is consistent with the third mode of rainfall (see correlation values in Tables 1 and 2). Cross-correlation values are 64, 50 and 74 % for regional, GRGS and ICA 400 km-filtered solutions, respectively and with a time lag of 4 months with respect to rainfall data.
3.2 Detection of localized hydrological events
3.2.1 An exceptional rainfall in 2010
Anomaly maps of TWS were generated as the difference be-tween the monthly TWS grids corresponding to the excep-tionally high rainfall in July and September 2010, and the mean grid averaged over the previous dry period (i.e. mean of the six months from June to November 2009). GRACE-based TWS and BoM rainfall anomaly grids are presented in Fig. 12. When the BoM rainfall anomaly grids are taken as reference, the TWS anomaly grids derived from regional solutions offer a better spatial localization of the Septem-ber 2010 rainfall structures than the ones computed with global GRGS solutions.
3.2.2 Case of cyclone Charlotte
The heavy rainfall and subsequent floods that were caused by cyclone Charlotte between 9 and 12 January 2009 in the Gulf of Carpentaria basins are clearly visible in Fig. 13. Tregoning et al. (2012) already noticed the signature of this climate event in GRACE global solutions. The first flood warnings for Queensland were issued in the first week of January from moderate to major flooding in the Gulf rivers, and in Georgina and Diamantina rivers of Western Queensland (see Fig. 1). Since important rainfall continued, these warnings were maintained for nine weeks (see BoM report of 2009). Instantaneous TWS anomalies, defined as the difference of two consecutive TWS 10-day regional and GRGS RL02 solutions are presented in Fig. 13a and b, respectively. In Fig. 13c, TWS anomalies derived from ICA 400 km-filtered solutions are defined as the difference between two consec-utive TWS monthly solutions. We notice clearly the strong signature of the floods caused by cyclone Charlotte, since the regional solutions reveal important positive water heights of≈600 mm of EWH, higher than the levels described by the solutions of the previous months. For our regional solu-tions, this corresponding TWS anomaly is localized in the Carpentaria drainage basins area (see Fig. 1). This sudden meteorological event agrees quite well with the BoM rainfall database (Fig. 13d) and GRGS RL02 estimates. However, ICA 400 km-filtered solutions show a very low amplitudes of this event, as these combined solutions remain smooth.
3.3 Basin-average time series of TWS
Leblanc et al. (2009) have shown the effects of drought over Murray–Darling Basin from 2002 to 2009, and they compared GRGS-RL02 global solutions to the sum of in situ data for surface and ground waters plus model output for soil moisture. Time series of GRACE TWS averaged over the whole Murray–Darling using regional, GRGS and ICA 400 km-filtered solu-tions are presented in Fig. 14. We notice TWS varia-tions are consistent between all GRACE soluvaria-tions (corre-lations values: regional/GRGS = 90 %, ICA/regional = 76 %,
CORRELATION
140˚ 150˚ −40˚
−30˚ −20˚
RMS
140˚ 150˚
140˚ 150˚ −40˚
−30˚ −20˚
140˚ 150˚
140˚ 150˚ −40˚
−30˚ −20˚
0.00 0.25 0.50 0.75 1.00
140˚ 150˚
0 10 20 30 40 50 60 70 80
mm
(a) Regional solution
(b) GRGS RL02 solution
(c) GFZ ICA solution
Fig. 16.Spatial correlation (left maps) and RMS (right maps) of differences between TWS (in situ GWS measurements + surface
water + modelled soil moisture) and: (a) regional solutions,
(b)GRGS RL02 solutions and(c)ICA 400 km-filtered solutions.
water content variations. These latter variations are slightly larger but very comparable to the GRACE-based amplitudes. Gridded correlations and RMS differences in the Murray– Darling Basin are even better for our regional GRACE so-lutions (Fig. 16), especially in the Murray Basin, where the correlations are greater than 75 %, and where GWS measure-ments are the densest (see data coverage in Fig. 1), whereas GRGS and ICA-filtered solutions may drop down to 25 %, and even less.
4 Conclusions
In this paper, we validated our 10-day GRACE regional so-lutions of water mass variations over Australia for the period 2003–2011 by comparing them with (i) global GRGS RL02 and ICA 400 km-filtered solutions based on global spheri-cal harmonics representation, and (ii) independent data sets, i.e. estimates of rainfall, groundwater and surface water de-rived from in situ observations and modelled soil moisture. Once applied to the GRACE data sets, PCA provided the main modes of variability of these data sets before com-parison. Temporal and spatial patterns are consistent for the regional and global solutions. However, the regional solu-tions offer better geographical localization of hydrological structures, while global GRACE solutions remain affected by aliasing errors (i.e. north–south striping). There are high correlations between SOI and PDO climate indexes during the Millennium Drought and our regional solutions, in par-ticular for the first PCA mode at the scale of the whole of Australia. Besides, second and third modes are also related to the drought that occurred in the southeastern part of Aus-tralia up to late 2006. While all the GRACE solutions re-main consistent over Australia, our regional solutions yield the best agreement with in situ water table measurements in the Murray–Darling drainage basin. This is probably due to the benefit of the gain of details dealing with regional short tracks of GRACE, instead of using band-limited harmonics functions defined on the entire terrestrial sphere.
Acknowledgements. We would like to thank Laurent Longuevergne and anonymous reviewers for their fruitful comments during the preparation of the manuscript, Adam Fakes for assisting with the processing of in situ groundwater data and Albert Van Dijk for providing Soil Moisture outputs of AWRA model. Lucia Seoane’s work was funded by ARC discovery projet at James Cook Univer-sity (Australia).
Edited by: Y. Fan
The publication of this article is financed by CNRS-INSU.
References
Andersen, O. B., Seneviratne, S. I., Hinderer, J., and Viterbo, P.: GRACE-derived terrestrial water storage depletion associated with the 2003 European heat wave, Geophys. Res. Lett., 32, L18405, doi:10.1029/2005GL023574, 2005.
Awange, J., Sharifi, M., Baur, O., Keller, W., Featherstone, W., and Kuhn, M.: GRACE hydrological monitoring of Australia: Cur-rent limitations and future prospects, J. Spatial Sci., 54, 23–36, doi:10.1080/14498596.2009.9635164, 2009.
Awange, J., Fleming, K. M., Kuhn, M., Featherstone, W. E., Heck, B., and Anjasmara, I.: On the suitability of the
4×4 GRACE mascon solutions for remote sensing
Aus-tralian hydrology, Remote Sens. Environ., 115, 864–875, doi:10.1016/j.rse.2010.11.014, 2011.
BoM report: Queensland Floods January and February 2009, Bu-reau of Meteorology, Queensland, Australia, 2009.
Bruinsma, S., Lemoine, J.-M., Biancale, R., and Valès,
N.: CNES/GRGS 10-day gravity models (release 2)
and their evaluation, Adv. Space Res., 45, 587–601,
doi:10.1016/j.asr.2009.10.012, 2010.
Cresswell, R. G., Dawes, W. R., Summerell, G. K., and Walker, G. R.: Assessment of salinity management options for Kyeamba Creek, New South Wales: Data analysis and groundwater mod-elling, CSIRO Land and Water Technical Report 26/03, Murray Darling Basin Commission, Canberra, 2003.
CSIRO Report: Water availability in the Loddon-Avoca, A report to the Australian Government from the CSIRO Murray-Darling Basin Sustainable Yields Project, published by: CSIRO, Aus-tralia, 123 pp., 2008.
Duan, J., Shum, C. K., Guo, J., and Huang, Z.: Uncovered spuri-ous jumps in the GRACE atmospheric de-aliasing data: potential contamination of GRACE observed mass change, Geophys. J. Int., 191, 83–87, doi:10.1111/j.1365-246X.2012.05640, 2012. Fetter, C. W.: Applied Hydrogeology, published by: Prentice Hall
Inc, Upper Saddle River, New Jersey, 07458 USA, 2001. Forootan, E., Awange, J., Kusche, J., Heck, B., and Eicker, A.:
In-dependent patterns of water mass anomalies over Australia from satellite data and models, J. Remote Sens. Environ., 124, 427– 443, doi:10.1016/j.rse.2012.05.023, 2012.
Frappart, F., Ramillien, G., Maisongrande, P., and Bonnet, M.-P.: Denoising satellite gravity signals by independent compo-nent analysis, IEEE Geosci. Remote Sens. Lett., 7, 421–425, doi:10.1109/LGRS.2009.2037837, 2010.
Frappart, F., Ramillien, G., Leblanc, M., Tweed, S. O., Bonnet, M.-P., and Maisongrande, P.: An independent Component Analysis approach for filtering continental hydrology in the GRACE grav-ity data, Remote Sens. Environ., 115, 187–204, 2011.
Frappart, F., Papa, F., Santos da Silva, J., Ramillien, G., Pri-gent, C., Seyler, F., and Calmant, S.: Surface freshwater stor-age and dynamics in the Amazon basin during the 2005 excep-tional drought, Environ. Res. Lett., 7, 044010, doi:10.1088/1748-9326/7/4/044010, 2012.
Frappart, F., Ramillien, G., and Ronchail, J.: Changes in terrestrial water storage versus rainfall and discharges in the Amazon basin, Int. J. Climatol., 33, 3029–3046, doi:10.1002/joc.3647, 2013a. Frappart, F., Seoane, L., and Ramillien, G: Validation of
Freeden, W. and Schreiner, M.: Spherical Functions of Mathe-matical Geosciences: A Scalar, Vectorial, and Tensorial Setup, Springer (Monography, 602 pp.), 2008.
García-García, D. C., Ummenhofer, C., and Zlotnicki, V.: Aus-tralian water mass variations from GRACE data linked to Indo-Pacific climate variability, Remote Sens. Environ., 115, 2175– 2183, doi:10.1016/j.rse.2011.04.007, 2011.
Hekmeijer, P. and Dawes, W.: Assessment of salinity management options for South Loddon Plains, Victoria: Data analysis and groundwater modeling, CSIRO Land and Water Technical Re-port 24/03, published by: Murray-Darling Basin Commission, Canberra, Australia„ 2003a.
Hekmeijer, P. and Dawes, W.: Assessment of salinity management options for Axe Creek, Victoria: Data analysis and groundwa-ter modelling, CSIRO Land and Wagroundwa-ter Technical Report 22/03, MDBC Publication 08/03, published by: Murray-Darling Basin Commission, Canberra, Australia, 40 pp., 2003b.
Himanshu, S., Bettadpur, S., and Tapley, B. D.: Reducing errors in the GRACE gravity solutions using regularization, J. Geodesy, 86, 695–711, doi:10.1007/s00190-012-0548-5, 2012.
Houborg, R., Rodell, M., Li, B., Reichle, R., and Zaitchik, B. F.: Drought indicators based on model-assimilated Grav-ity Recovery and Climate Experiment (GRACE) terrestrial wa-ter storage observations, Wawa-ter Resour. Res., 48, W07525, doi:10.1029/2011WR011291, 2012.
Ife, D. and Skelt, K.: Murray-Darling Basin Groundwater Sta-tus, Murray-Darling Basin Commission, publication 32/04, Can-berra, ISBN 1876830948, 2004.
Isaaks E.H and Srivastava R. M: An Introduction to Applied Geo-statistics, ISBN 0-19-505013-4, 1989.
Jeffrey, S. J., Carter, J. O., Moodie, K. B., and Beswick, A. R.: Us-ing spatial interpolation to construct a comprehensive archive of Australian climate data, Environ. Model. Softw., 16, 309–330, 2001.
Jones, D. A., Wang, W., and Fawcett, R: High-quality spatial cli-mate data-sets for Australia, Aust. Meteorol. Ocean. J., 58, 233– 248, 2009.
Klees, R., Revtova, E. A., Gunter, B. C., Ditmar, P., Oudman, E., Winsemius, H. C., and Savenije, H. H. G.: The design of an opti-mal filter for monthly GRACE gravity models, Geophys. J. Int., 175, 417–432, doi:10.1111/j.1365-246X.2008.03922.x, 2008. Kirby, M., Evans, R., Walker, G., Cresswell, R., Coram, J., Khan,
S., Paydar, Z., Mainuddin, M., McKenzie, N., and Ryan, S.: The shared water resources of the Murray–Darling Basin, Pub-lication 21/06, available online at: http://www.mdbc.gov.au, Murray–Darling Basin Commission, Canberra, 2006.
Leblanc, M., Tregoning, P., Ramillien, G., Tweed, S., and Fake, A.: Basin scale, integrated observations of the early 21st Century multi-year drought in southeast Australia, Water Resour. Res., 45, W04408, doi:10.1029/2008WR007333, 2009.
Leblanc, M., Tweed, S., Ramillien, G., Tregoning, P., Frappart, F., Fakes, A., and Cartwright, I.: Groundwater change in the Murray basin from long-term in situ monitoring and GRACE estimates, in: Climate change effects on groundwater resources: A global synthesis of findings and recommendations, edited by: Treidel, H. and Gurdak, J. J., CRC Press, 169–187, 2011.
Lemoine, F. G., Luthcke, S. B., Rowlands, D. D., Chinn, D. S., Klosko, S. M., and Cox, C. M.: The use of mascons to resolve
time-variable gravity from GRACE, Dynamic planet, Springer Berlin Heidelberg, 2007.
Li, L. T., Donohue, R. J., McVicar, T. R., Van Niel, T. G., Ten, J., Potter, N. J., Smith, I. N., Kirono, D. G. C., Bathols, J. M., Cai, W., Marvanek, S. P., Gallant, S. N., Chiew, F. H. S., and Frost, A. J.: Climate data and their characterisation for hydrological sce-nario modelling across northern Australia. A report to the Aus-tralian Government from the CSIRO Northern Australia Sustain-able Yields Project, published by: CSIRO Water for a Healthy Country Flagship, Australia, 63 pp., 2009.
Macumber, P. G.: Groundwater flow and resource potential in the Bridgewater and Salisbury West GMAs, Phillip Macumber Con-sulting Services, Melbourne, 88 pp., 1999.
Mantua, N. J. and Hare, S. R.: The Pacific Decadal Oscillation, J. Oceanogr., 58, 35–44, 2002.
Munier, S., Becker, M., Maisongrande, P., and Cazenave, A.: Using GRACE to detect Groundwater Storage variations: the cases of Canning Basin and Guarani aquifer system, Int. Water Technol. J., 2, 2–13, 2012.
Petheram, C., Dawes, W., Walker, G., and Grayson, R. B.: Testing in class variability of groundwater systems: Local upland systems, Hydrol. Process., 17, 2297–2313, doi:10.1002/hyp.1333, 2003. Preisendorfer, R.: Principal component analysis in meteorology and
oceanography, Amsterdam: Elsevier (ISBN 10:0444430148), 1988.
Ramillien, G., Frappart, F., Güntner, A., Ngo-Duc, T., Cazenave, A., and Laval, K.: Time variations of the regional evapotran-spiration rate from Gravity Recovery and Climate Experiment (GRACE) satellite gravimetry, Water Resour. Res., 42, W10403, doi:10.1029/2005WR004331, 2006a.
Ramillien, G., Lombard, A., Cazenave, A., Ivins, E. R., Llubes, M., Remy, F., and Biancale, R.: Interannual variations of the mass balance of the Antarctica and Greenland ice sheets from GRACE, Global Planet. Change, 53, 198–208, doi:10.1016/j.gloplacha.2006.06.003, 2006b.
Ramillien, G., Biancale, R., Gratton, S., Vasseur, X., and Bour-gogne, S.: GRACE-derived surface mass anomalies by en-ergy integral approach, Application to continental hydrology, J. Geodesy, 85, 313–328, doi:10.1007/s00190-010-0438-7, 2011. Ramillien, G., Seoane, L., Frappart, F., Biancale, R., Gratton, S.,
Vasseur, X., and Bourgogne, S.: Constrained regional recovery of continental water mass time-variations from GRACE based geopotential anomalies over South America, Surv. Geophys., 33, 887–905, doi:10.1007/s10712-012-9177-z, 2012.
Rieser, D., Kuhn, M., Pail, R., Anjasmara, I. M., and Awange, J.: Relation between GRACE-derived surface mass variations and precipitation over Australia, Aust. J. Earth Sci., 57, 887–900, doi:10.1080/08120099.2010.512645, 2010.
Rodell, M., Famiglietti, J. S., Chen, J., Seneviratne, S. I., Viterbo, P., Holl, S., and Wilson, C. R.: Basin scale estimate of evapotran-spiration using GRACE and other observations, Geophys. Res. Lett., 31, L20504, doi:10.1029/2004GL020873, 2004.
Rodell, M., Chen, J., Kato, H., Famiglietti, J. S., Nigro, J., and Wil-son, C.: Estimating groundwater storage changes in the Missis-sippi River basin (USA) using GRACE, Hydrogeol. J., 15, 159– 166, doi:10.1007/s10040-006-0103-7, 2007.
Rowlands, D. D., Luthcke, S. B., Klosko, S. M., Lemoine, F. G., Chinn, D. S., McCarthy, J. J., Cox, C. M., and Andersen, O. B.: Resolving mass flux at high spatial and temporal resolution using GRACE intersatellite measurements, Geophys. Res. Lett., 32, L04310, doi:10.1029/2004GL021908, 2005.
Smitt, C., Doherty, J., Dawes, W., and Walker, G.: Assessment of salinity management options for the Brymaroo catchment, South-eastern Queensland, CSIRO Land and Water Technical Report 23/03, Murray-Darling Basin Commission, Canberra, Australia, 2003.
Swenson, S. C. and Wahr, J.: Post-processing removal of corre-lated errors in GRACE data, Geophys. Res. Lett., 33, L08402, doi:10.1029/2005GL025285, 2006.
Syed, T. H., Famiglietti, J. S., Rodell, M., Chen, J., and Wil-son, C. R.: Analysis of terrestrial water storage changes from GRACE and GLDAS, Water Resour. Res., 44, W02433, doi:10.1029/2006WR005779, 2008.
Taylor, R. G., Scanlon, B. R., Doll, P., Rodell, M., van Beek, R., Wada, Y., Longuevergne, L., Leblanc, M., Famiglietti, J. S., Ed-munds, M., Konikow, L., Green, T. R., Chen, J., Taniguchi, M., Bierkens, M. F. P., Macdonald, A., Fan, Y., Maxwell, R. M., Yechieli, Y., Gurdak, J. J., Allen, D., Shamsudduha, M., His-cock, K., Yeh, P. J. F., Holman, I., and Treidel, H.: Ground-water and climate change, Nat. Clim. Change, 3/323–329S8, doi:10.1038/nclimate1744, 2013.
Tregoning, P., Lambeck, K., and Ramillien, G.: GRACE esti-mates of sea surface height anomalies in the Gulf of Car-pentaria, Australia, Earth Planet. Sc. Lett., 271, 241–244, doi:10.1016/j.epsl.2008.04.018, 2008.
Tregoning, P., McClusky, S., van Dijk, A. I. J. M., Crosbie, R. S., and Peña-Arancibia, J. L.: Assessment of GRACE Satellites for Groundwater Estimation in Australia, National Water Commis-sion, Canberra, 82 pp., 2012.
Urbano, L. D., Person, M., Kelts, K., and Hanor, J. S.: Tran-sient groundwater impacts on the development of paleoclimatic lake records in semi-arid environments, Geofluids, 4, 187–196, doi:10.1111/j.1468-8123.2004.00081.x, 2004.
Van Dijk, A. I. J. M. and Renzullo, L. J.: Water resource monitoring systems and the role of satellite observations, Hydrol. Earth Syst. Sci., 15, 39–55, doi:10.5194/hess-15-39-2011, 2011.
Van Dijk, A. I. J. M., Renzullo, L. J., and Rodell, M.: Use of GRACE terrestrial water storage retrievals to evaluate model es-timates by the Australian water resources assessment system, Water Resour. Res., 47, W11524, doi:10.1029/2011WR010714, 2011.
Wahr, J., Molenaar, M., and Bryan, F.: Time variability of the Earth’s gravity field: hydrological and oceanic effects and their possible detection using GRACE, J. Geophys. Res., 103, 30205– 30229, 1998.
Wessel, P. and Smith, W. H. F.: New improved version of Genereric Mapping Tools released, EOS, Trans. Amer. Geophys. U., 79, 579 pp., 1998.