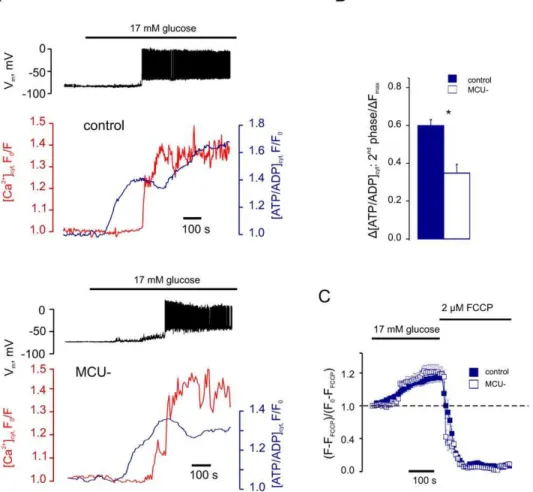
The mitochondrial Ca2+ uniporter MCU is essential for glucose-induced ATP increases in pancreatic β-cells.
Texto
Imagem

![Figure 6. Effect of the NCLX silencing on [Ca 2+ ] cyt and [Ca 2+ ] mit dynamics. Pancreatic b-cells were infected with lentiviruses delivering nonsense shRNA (‘‘control’’) or shRNA against NCLX (‘‘NCLX - ‘‘) for 36–48 h](https://thumb-eu.123doks.com/thumbv2/123dok_br/16437671.196496/8.918.91.674.92.874/figure-silencing-dynamics-pancreatic-infected-lentiviruses-delivering-nonsense.webp)

Documentos relacionados
Stimulation with LTC4 induced a substantial increase in the number of GFP-positive cells (Figure 5B) and this was significantly reduced both by mitochondrial depolarisation (Figure
Furthermore, decreased ATP synthesis that results from mitochondrial dysfunction also plays an impor- tant role in decreasing insulin secretion in patients with DM2, since it
In the present report, we show that com- pound 48/80 also inhibits glucose-induced PI turn- over and that the PLC1 encoded phospholipase C is essential both for glucose-induced
In β cells, the UCP2 protein is known to inhibit insulin secretion by routing glucose metabolism toward a molecule called NADH, rather than toward ATP. The authors demonstrate
MB significantly increases mitochondrial complex I–III activity in isolated mitochondria and enhances oxygen consumption and glucose uptake in HT-22 cells.. Using positron
As a consequence of this increased inner mitochondrial perme- ability to protons, part of the energy stored as membrane potential generated by the mito- chondrial respiratory chain
The glucose or galactose-grown yeast cells present differ- ences in the cytosolic calcium levels that were attributed to the differences in the internal level of glucose-6-P and Fig.
These results indicate that the higher cytosolic Ca 2 + level in activated lymphocytes increases their susceptibility to oxidative stress-induced cell death in a mechanism involving
