www.atmos-chem-phys.org/acp/5/3415/ SRef-ID: 1680-7324/acp/2005-5-3415 European Geosciences Union
Chemistry
and Physics
A comprehensive evaluation of water uptake on atmospherically
relevant mineral surfaces: DRIFT spectroscopy, thermogravimetric
analysis and aerosol growth measurements
R. J. Gustafsson, A. Orlov, C. L. Badger, P. T. Griffiths, R. A. Cox, and R. M. Lambert
Chemistry Department, Cambridge University, Lensfield Road, Cambridge CB2 1EW, UK Received: 4 August 2005 – Published in Atmos. Chem. Phys. Discuss.: 22 August 2005 Revised: 14 November 2005 – Accepted: 23 November 2005 – Published: 19 December 2005
Abstract. The hygroscopicity of mineral aerosol samples has been examined by three independent methods: diffuse reflectance infrared Fourier transform spectroscopy, thermo-gravimetric analysis and differential mobility analysis. All three methods allow an evaluation of the water coverage of two samples, CaCO3and Arizona Test dust, as a function of relative humidity. For the first time, a correlation between ab-solute gravimetric measurements and the other two (indirect) methods has been established. Water uptake isotherms were reliably determined for both solids which at 298 K and 80% relative humidity exhibited similar coverages of∼4 mono-layers. However, the behaviour at low relative humidity was markedly different in the two cases, with Arizona Test Dust showing a substantially higher affinity for water in the con-tact layer. This is understandable in terms of the chemical composition of these two materials. The mobility analysis results are in good accord with field observations and with our own spectroscopic and gravimetric measurements. These findings are of value for an understanding of atmospheric chemical processes.
1 Introduction
The physicochemical properties of aerosol particles affect the radiative balance and chemistry of the Earth’s atmosphere. The hygroscopic properties of aerosol particles are important both to their direct and indirect effects on the Earth’s radia-tion budget. Aerosols affect the radiative balance of the Earth by scattering and absorbing solar radiation (Kaufman et al., 2002). The single scattering albedo of a particle depends on its size and refractive index, both of which are strong func-tions of the aerosol water content.
Correspondence to:R. M. Lambert ([email protected])
Cloud droplets form via the condensational growth of aerosol particles, and the hygroscopic properties of the aerosol surface control the rate of activation of aerosol parti-cles to form cloud droplets. The optical properties and life-time of the resulting cloud depend on the hygroscopicity of the initial aerosol on which the cloud droplets form (Charl-son et al., 1992).
Aerosols also provide a sink for reactive gases as well as a substrate for chemical transformation (Ravishankara and Longfellow, 1999), and aerosol water content has been shown to affect the rate of uptake of soluble gases (Hal-lquist et al., 2003). Measurements of hygroscopic growth and associated water content are therefore necessary to un-derstand the radiative and chemical effects of tropospheric aerosol species.
We report water uptake for two classes of aerosol: cal-cite, i.e. CaCO3, and Arizona Test Dust. Calcite is an im-portant component of Saharan dust, comprising up to 30% of the aerosol mass (Loyepilot et al., 1986). The water content of calcite particles is important in the atmospheric oxidation of SO2that proceeds via the formation of a calcium sulfate hemihydrate (Dentener et al., 1996).
In the work reported in this article, the water uptake was measured by two different techniques: diffuse re-flectance Fourier transform spectroscopy (DRIFTS), and thermogravimetic analysis (TGA). Additionally, the size dis-tribution of a laboratory-generated aerosol, and therefore ap-proximate water content, was measured using a scanning electrical differential mobility analyser (DMA).
2 Experimental methods
2.1 Sample preparation and characterization
The samples analyzed were Arizona Test Dust (nominal 0– 3µm fraction, Powder Technology Inc., Minnesota, USA) and calcite (Specialty Minerals Ltd, Birmingham, UK, nom-inal diameter∼70 nm). Prior to DRIFTS and TGA experi-ments the samples were conditioned for one hour at 120◦C under helium to remove the majority of species adsorbed on the surface. Surface area analysis was performed using a Mi-cromeritics Gemini BET analyser.
2.2 Diffuse reflectance Fourier Transformed spectroscopy (DRIFTS)
DRIFTS experiments were performed with a Perkin-Elmer GX2000 spectrometer equipped with a liquid nitrogen cooled MCT detector. The DRIFTS sample (Collector II, Thermo Spectra-Tech) was installed in a controlled atmosphere cell that also allowed control of the sample temperature. The detector and sample areas of the spectrometer were purged with N2to reduce the contribution of atmospheric CO2and H2O. Accurate flows of humid gas were obtained using mass flow controllers (MKS) to pass a controlled proportion of the total gas through high purity deionized water. Relative hu-midity (RH) was measured with a humidity probe (Vaisala Humitter) and difference spectra were acquired at 25◦C with a resolution of 4 cm−1(average of 100 scans). Background spectra of the conditioned sample were taken under a flow of helium at 25◦C.
2.3 Thermogravimetric analysis (TGA)
TGA experiments were performed using a Mettler-Toledo TGA/SDTA851e with an accuracy of +/−1µg. The bal-ance and sample compartments were purged with nitrogen. The weight of the sample was measured continuously under isothermal conditions. The humidity of the purge gas was in-creased in steps, the balance output being allowed to stabilise
between each step. The experiment was repeated without the sample present to correct for water adsorption to the sample holder and balance apparatus.
2.4 Aerosol growth measurements
Hygroscopic growth factors are derived from size distribu-tions measured as a function of relative humidity (RH) by calculating the ratio of mean particle diameter of an aerosol distribution at a givenRHto that of similar particles at aRH below 30%. Aerosols were generated using a slow-flow neb-ulizer system, based on the design of Lindqvist et al. (1982). The nebulizer holds a continuously stirred suspension of par-ticles in distilled water, and a peristaltic pump generates a flow of approximately 2 ml min−1 through the hypodermic needle of the nebulizer system. At the exit of the needle, the flow of liquid meets a fast flow of N2(0.5–1.5 slm), gen-erating an aerosol with a number density of approximately 1×10⁶particles cm−3.
For certain measurements, the aerosol stream was dried to<2%RH by passing the flow through a pair of diffusion driers, which contain a clear channel around which a silica gel/cobalt chloride drying agent is packed. The relative hu-midity of the aerosol stream was controlled by the addition of a flow of humidified nitrogen. With the driers in the flow stream, a finalRHof between 2 and 70% can be generated. When the driers are bypassed, a range of 30–82%RHis ac-cessible. The aerosol stream was passed to a Pyrex condi-tioner and then to the DMA (Hauke, VIE-EMS-08). Size distributions are calculated by proprietary software that cor-rects for the effects of multiple charging, assuming spherical particle shape.
Aerosols were generated from suspensions in distilled wa-ter of calcite particles and Arizona Test Dust. The calcite particles were used as supplied, while the Arizona Test Dust sample was filtered using Fisherbrand QT 260 filter paper, and the filtrate used in the nebulizer – a procedure found to give the most stable operation. Filtration reduced the concentration of dust in the suspension from 20 mg cm−3to 10.6 mg cm−3, a reduction of 47%.
3 Results
3.1 Water uptake on calcium carbonate
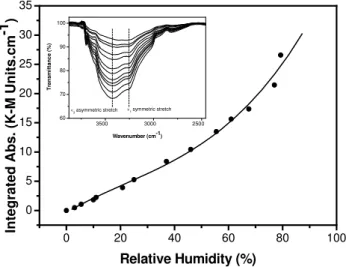
Adsorption of water vapour onto the CaCO3 surface was measured at room temperature by means of DRIFTS: the in-tegrated intensity of the O-H stretching region (ca. 3000– 3700 cm−1, see inset Fig. 1) provides a measure of the amount of water on the surface (Saliba et al., 2001).
0 20 40 60 80 100 0
5 10 15 20 25 30 35
3500 3000 2500 60
70 80 90 100
ν3 asymmetric stretch
Tr
a
n
s
m
it
tan
c
e
(
%
)
Wavenumber (cm-1)
ν1 symmetric stretch
Integrated Abs. (K-M Units.cm
-1 )
Relative Humidity (%)
Fig. 1. Water uptake isotherm for calcite obtained using DRIFTS. Region integrated in shown in the inset.
The reflected radiation in DRIFTS is dependent on many factors including: particle dimension, packing density and homogeneity among others (Armaroli et al., 2004). In ad-dition, unlike transmission FTIR, DRIFTS shows no linear relation between band intensity and concentration. Gain-ing quantitative information from the spectra is non-trivial as the Beer-Lambert law used in transmittance is not appli-cable. However, Kubelka-Munk theory can be applied to im-prove the linearity of the dependence of signal intensity upon concentration (Armaroli et al., 2004). By considering the reflection and absorbance of incident flux on a particle this methodology leads to expressions for these two parameters; in the limit of thick samples, it leads to a linear relationship between concentration and reflected radiation intensity.
Figure 1 shows the water adsorption isotherm obtained af-ter applying the Kubelka-Munk function to the DRIFTS data. The isotherm exhibits type III characteristics indicative of a low adsorption enthalpy in the contact layer: the absence of a clear indication of the monolayer point makes cover-age quantification problematic. Accordingly, in order to ob-tain absolute values of surface coverage thermogravimetric analysis (TGA) was used to measure the mass of adsorbed water as a function of relative humidity (Fig. 2, closed cir-cles). Knowing the surface area of the sample (17.8 m2g−1 from BET) the mass of water adsorbed was converted into coverage in terms of formal water monolayers by making a reasonable assumption about the size of the adsorbed water molecule (14.3 ˚A2(Hackerman and Hall, 1958)). On this ba-sis, we calculate that one monolayer is absorbed at∼55% RH, adsorption proceeding up to∼4.5 monolayers at 80% RH. The shape of the corresponding isotherm (Fig. 2) re-sembles that of the DRIFTS-derived isotherm (Fig. 1) and Fig. 3 shows the correlation between TGA and DRIFTS re-sults. This is linear at sub-monolayer coverage, but at higher
0 30 60 90
0 1 2 3 4 5
No.
mon
o
layer
s
Relative Humidity (%) ATD
CaCO3
Fig. 2.Water uptake isotherms for calcite and ATD obtained using TGA.
coverages DRIFTS appears to underestimate the amount of adsorbed water.
3.2 Hygroscopic growth of calcium carbonate aerosol The calcite aerosol was found to have a bimodal size distri-bution, which could be represented as the sum of two log-normal distributions of the form:
dN dlnD =
N
√
2πlnσg
exp(−(lnD−lnDpg) 2
2 ln2σg
where D is the particle diameter, Dpgthe median diameter of
the distribution andσgthe geometric standard deviation. At
5%RH, values of Dpgof 40 nm andσgof 1.5 were obtained
for smaller of the two modes, while for the larger mode, Dpg=250 nm andσg=1.4.
The median diameter of the smaller mode was found to in-crease with increasingRH. Figure 4 shows the growth, plot-ted as Dpg(RH)/Dpg,0where Dpg,0is the average “dry” me-dian diameter, derived from measurements over the range 0– 30%RH. At 80%RH, a growth factor of 1.14±0.06 is mea-sured. The solid line shows a fit a power law expression of the form
D D0 =
1−RH 100
−γ
to the data, weighted by the uncertainty of each measure-ment. For CaCO3,γ=0.073. The measured size distribution at 50%RHis also shown as an inset to Fig. 4.
3.3 Water uptake on Arizona test dust
0 1 2 3 4 0
5 10 15 20 25
In
teg
rated
ab
so
rb
ance (K-M
un
it
s.
cm
-1 )
Monolayers (mg)
Fig. 3. Correlation between DRIFTS and TGA measurements for calcite.
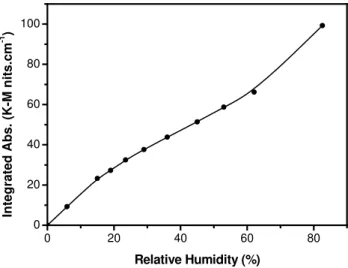
TGA-derived isotherm (Fig. 2) is markedly different to that for CaCO3. In the present case a shoulder is clearly appar-ent indicating a higher appar-enthalpy of adsorption into the con-tact layer. At sufficiently highRH(∼70%) where multilayer formation is well developed (∼2.5 layers) and the influence of the underlying solid surface reduced, the calcite and Ari-zona Test Dust isotherms converge, as would be expected. At∼80%RHthe coverage corresponds to∼4 monolayer for both samples. In the sub-monolayer range, the two isotherms are markedly divergent, reflecting the stronger water-Arizona Test Dust interaction in the contact layer, compared to water-CaCO3. In passing, we note that the (physically reasonable) calculated coverages that characterize the monolayer and multilayer regimes of these isotherms validate our method of quantifying the TGA data. As in the case of CaCO3, the DRIFTS isotherm (Fig. 5) qualitatively resembles the TGA isotherm results but the two diverge at higherRHto due non-linearities in the spectral response.
3.4 Hygroscopic growth of Arizona Test Dust aerosol As for the calcite particles, the aerosol generated from a suspension of Arizona Test Dust was found to be bimodal. At 5% RH, average values of 56 nm and 250 nm were ob-tained for Dpgin the two modes, with corresponding values
of 1.4 forσgfor both modes. Figure 6 shows the hygroscopic
growth factors of the small mode – slightly lower growth is observed, compared to the calcite particles. At 80%RH, a growth factor of 1.07±0.02 is observed. The solid line shows a fit of the power law expression, weighted by the uncertainty in each measurement, to the experimental data. For ATD, γ=0.036. The inset in Fig. 6 shows the measured size distri-bution at 50%RH.
In view of the small amount of water soluble material present in commercial ATD samples, additional
measure-0 20 40 60 80
0.98 1.00 1.02 1.04 1.06 1.08 1.10 1.12 1.14 1.16 1.18 1.20 1.22
10 100 1000
0.0 0.2 0.4 0.6 0.8 1.0 1.2
dN
/dln
D
/
arb
itrar
y un
it
s
Diameter / nm
Hyg
ro
sco
pi
c gr
owth
factor
, D/
D0
Relative humidity (%)
Fig. 4. Water uptake isotherm for CaCO3 obtained using DMA analysis.
ments were performed using samples from which the wa-ter soluble fraction had been removed by repeated treatment with deionized water. To within experimental error, identical growth factors were observed.
4 Discussion
0 20 40 60 80 0
20 40 60 80 100
In
teg
rated
A
b
s.
(K-M n
its.
c
m
-1 )
Relative Humidity (%)
Fig. 5.Water uptake isotherm for ATD obtained using DRIFTS.
Arizona test dust consists principally of silica (∼70%) and alumina (∼20%) with small amounts of other minerals (ox-ides of iron, titanium, calcium etc.). In accord with this, our results for Arizona Test Dust do not differ significantly from published results for water uptake on silica and alumina pow-ders (Goodman et al., 2001).
In order to rationalize the weaker interaction of water with CaCO3 compared to Arizona Test Dust at low relative hu-midity, it is necessary to consider the chemical interactions that occur at the solid/liquid interface. The interaction of sil-ica (which dominates in Arizona Test Dust) with water is well understood (Papirer, 2000). It is thought that∼3 lay-ers of water interact strongly with the surface via hydrogen-bonding interactions involving the surface-capping silanol groups (Saliba et al., 2001). Higher layers behave essentially as liquid water.
The mechanisms of water interaction with calcite surfaces have been studied by several groups (Al-Hosney and Gras-sian, 2005; Stipp, 1999; Stipp et al., 1994). CaCO3 sur-faces exposed to water vapour form CO3H− and OH− sur-face groups (Stipp, 1999), the resulting Ca(OH)(CO3H) giv-ing rise to enhanced hydrophilic properties and facilitatgiv-ing further water adsorption. It is suggested that at<50%RH water forms 2-D islands with 3-D islands appearing at higher humidity (Al-Hosney and Grassian, 2005).
The isotherms obtained by TGA (Fig. 2) were used to cal-culate enthalpies of adsorption. The values obtained (from their corresponding BET parameters) were 45.7 kJmol−1 for calcite and 52.2 kJmol−1 in the case of Arizona Test Dust. The difference in adsorption enthalpies and the con-sequent difference in isotherms observed for these two sam-ples (Fig. 2) reflects the different interaction strengths of the two types of surface hydroxylated groups with adsorbed wa-ter. One of several possible factors influencing interaction strength is the higher electronegativity of Si compared to Ca increases the polarity of the –OH group which in turn gives
0 20 40 60 80
0.98 1.00 1.02 1.04 1.06 1.08 1.10
10 100 1000
0.0 0.2 0.4 0.6 0.8 1.0
dN
/d
ln
D
/
a
rbi
tr
ary u
n
it
s
Diameter / nm
Hyg
ro
scop
ic gr
owth
facto
r,
D/
DO
Relative humidity / %
Fig. 6. Hygroscopic growth factors for ATD obtained using DMA analysis, measured for the small mode. The line is fit to a power-law expression (see text).
rise to stronger H-bonding in Arizona Test Dust. Thus the substantial differences in the early stages of water uptake be-tween carbonate and Arizona Test Dust samples reflect the difference in chemical composition of two solids.
4.1 DMA results
A number of new observations concerning the hygroscopic properties of mineral dust surfaces are presented. Firstly, a bimodal size distribution has been observed for an aerosol generated from a suspension of solid particles in water. Sec-ondly, hygroscopic growth factors have been measured and shown to increase monotonically with increasing RH over the range 0–80%, with similar growth factors (∼1.10) being measured for both Arizona Test Dust and CaCO3aerosol at 80%RH.
The origin of the two modes observed in the size distribu-tion is at this point not entirely clear. At the present time, we consider that the small mode is generated from nebuliza-tion of individual mineral dust particles in solunebuliza-tion, while the larger mode is the result of agglomeration of particles within the liquid suspension.
0 10 20 30 40 50 60 70 80 0.98
0.99 1.00 1.01 1.02 1.03 1.04 1.05 1.06 1.07
Hy
gros
c
o
pic
grow
th
f
a
c
tor,
D/D
0
Relative humidity (%)
Fig. 7. Hygroscopic growth factors for ATD obtained using DMA analysis, measured for the large mode.
second order effects such as gas phase nucleation, may be excluded.
Figure 7 shows the hygroscopic growth of the large mode. To within the precision of our experiments, no hygro-scopic growth was observed. Although perhaps surprising at first sight, these results are consistent with the hygroscopic growth factors of the smaller mode.
For a solid aerosol particle that is unable to absorb water into the bulk, the use of hygroscopic growth factors is some-what misleading because condensation is then a purely sur-face phenomenon, and the observed growth factors are per-haps better expressed as the corresponding changes in parti-cle diameter.
For example, in the case of ATD, hygroscopic growth fac-tors of 1.09 were derived for the small mode at 80%, cor-responding to a change in diameter of around 3 nm. This lies well within the precision of the DMA measurement tech-nique. At 250 nm no growth can be observed as the predicted increase in diameter is within the uncertainty of the measure-ment. Thus, the data shown in Fig. 7, while noisy and show-ing no clear trend in growth with increasshow-ingRH, do not con-tradict our measurements of growth of the small mode. They are simply more precise measurements of the same growth process.
Conversion of changes in (mobility derived) particle diam-eter to surface coverage is not straightforward, being compli-cated by uncertainties arising from changes in particle shape (which affects mobility) and of the molecular diameter of wa-ter on the surface, an estimate of surface coverage may be made using the growth measurements. Taking the area of an adsorbed water molecule as 14.3 ˚A2 (Hackerman and Hall, 1958) and assuming a flat adsorption geometry, a molecular
diameter of 420 pm is derived. Thus a change in particle di-ameter of 5 nm, as measured for calcium carbonate, is equiv-alent to a coverage of 6 ML. For ATD, coverages of around 4 ML are calculated. Both results agree with the TGA and DRIFTS data within the experimental uncertainties.
To date, there have been only a few atmospheric ob-servations relating to the hygroscopic growth of mineral dust aerosol. Carrico et al. report hygroscopic growth fac-tors derived from measurements of the radiative proper-ties of aerosol during the ACE-ASIA campaign (Carrico et al., 2003). The ratios of total light scattering coefficients at 550 nm were used to derive hygroscopic growth factors, which during dust-dominated events, were found to be in the range 1.18 to 1.39, although there are indications that this value contains a contribution from an electrolyte component. Li-Jones et al. (1998) measured hygroscopic growth factors for mineral dust particles advected over the Atlantic Ocean. Aerosol scattering coefficients were measured using an inte-grating nephelometer and growth factors of 1.0 to 1.1 were estimated using data from periods of high dust concentra-tion. In view of these studies, and the results reported in this work, a diameter-dependent growth factor is recommended for mineral dust aerosol. For freshly emitted 100 nm mineral dust particles in the atmosphere a growth factor of 1.05 is suggested, falling to 1.005, or 0.5%, for 1µm particles.
5 Conclusions
1. Arizona Test Dust and CaCO3 show markedly differ-ent water uptake characteristics over theRH range 0– 80%. These differences in behaviour are understand-able in terms of differences in specific interactions at the solid/liquid interface.
2. TGA provides a reliable quantitative measure of wa-ter uptake over the entireRHrange enabling relatively unambiguous identification of the monolayer point. DRIFT spectra scale linearly with TGA data at lowRH, but diverge significantly at highRH.
3. Our laboratory measurements of hygroscopic growth factors are in accord with both field measurements and with our spectroscopic and gravimetric results. The re-sults indicate moderate hygroscopicity of the mineral dusts, and provide important new data of relevance for the calculation of the rate of uptake of soluble gases by mineral aerosol and the radiative properties of these par-ticles.
Edited by: J. Abbatt
References
Al-Abadleh, H. A., Al-Hosney, H. A., and Grassian, V. H.: Oxide and carbonate surfaces as environmental interfaces: the impor-tance of water in surface composition and surface reactivity, J. Molecular Catalysis a-Chemical, 228, 47–54, 2005.
Al-Abadleh, H. A., Krueger, B. J., Ross, J. L., and Grassian, V. H.: Phase transitions in calcium nitrate thin films, Chemical Com-munications, 2796–2797, 2003.
Al-Hosney, H. A. and Grassian, V. H.: Water, sulfur dioxide and nitric acid adsorption on calcium carbonate: A transmission and ATR-FTIR study, Phys. Chem. Chem. Phys., 7, 1266–1276, 2005.
Armaroli, T., Becue, T., and Gautier, S.: Diffuse reflection infrared spectroscopy (DRIFTS): Application to the in situ analysis of catalysts, Oil & Gas Science and Technology-Revue De L Insti-tut Francais Du Petrole, 59, 215–237, 2004.
Carrico, C. M., Kus, P., Rood, M. J., Quinn, P. K., and Bates, T. S.: Mixtures of pollution, dust, sea salt, and volcanic aerosol during ACE-Asia: Radiative properties as a function of relative humid-ity, J. Geophys. Res.-Atmospheres, 108, 8650–8668, 2003. Charlson, R. J., Schwartz, S. E., Hales, J. M., Cess, R. D., Coakley,
J. A., Hansen, J. E., and Hofmann, D. J.: Climate Forcing by Anthropogenic Aerosols, Science, 255, 423–430, 1992. Dentener, F. J., Carmichael, G. R., Zhang, Y., Lelieveld, J., and
Crutzen, P. J.: Role of mineral aerosol as a reactive surface in the global troposphere, J. Geophys. Res.-Atmospheres, 101, 22 869– 22 889, 1996.
Garrett, T. J., Russell, L. M., Ramaswamy, V., Maria, S. F., and Huebert, B. J.: Microphysical and radiative evolution of aerosol plumes over the tropical North Atlantic Ocean, J. Geophys. Res.-Atmospheres, 108, 4022–4038, 2003.
Goodman, A. L., Bernard, E. T., and Grassian, V. H.: Spectroscopic study of nitric acid and water adsorption on oxide particles: En-hanced nitric acid uptake kinetics in the presence of adsorbed water, J. Phys. Chem. A, 105, 6443–6457, 2001.
Hackerman, N. and Hall, A. C.: The adsorption of water vapor on quartz and caclite, J. Phys. Chem., 62, 1212–1214, 1958. Hallquist, M., Stewart, D. J., Stephenson, S. K., and Cox, R. A.:
Hydrolysis of N2O5on sub-micron sulfate aerosols, Phys. Chem. Chem. Phys., 5, 3453–3463, 2003.
Hanke, M., Umann, B., Uecker, J., Arnold, F., and Bunz, H.: Atmo-spheric measurements of gas-phase HNO3and SO2using chem-ical ionization mass spectrometry during the MINATROC field campaign 2000 on Monte Cimone, Atmos. Chem. Phys., 3, 417– 436, 2003,
SRef-ID: 1680-7324/acp/2003-3-417.
Kaufman, Y. J., Tanre, D., and Boucher, O.: A satellite view of aerosols in the climate system, Nature, 419, 215–223,2002. Li-Jones, X. and Prospero, J. M.: Variations in the size
distri-bution of non-sea-salt sulfate aerosol in the marine boundary layer at Barbados: Impact of African dust, J. Geophys. Res.-Atmospheres, 103, 16 073–16 084, 1998.
Lindqvist, O., Ljungstrom, E., and Svensson, R.: Low-Temperature Thermal-Oxidation of Nitric-Oxide in Polluted Air, Atmos. Env-iron., 16, 1957–1972, 1982.
Loyepilot, M. D., Martin, J. M., and Morelli, J.: Influence of Sa-haran Dust on the Rain Acidity and Atmospheric Input to the Mediterranean, Nature, 321, 427–428, 1986.
Papirer, E.: Adsorption on Silica Surfaces, Marcel Dekker, New York, 2000.
Ravishankara, A. R. and Longfellow, C. A.: Reactions on tropo-spheric condensed matter, Phys. Chem. Chem. Phys., 1, 5433– 5441, 1999.
Saliba, N. A., Yang, H., and Finlayson-Pitts, B. J.: Reaction of gaseous nitric oxide with nitric acid on silica surfaces in the presence of water at room temperature, J. Phys. Chem. A, 105, 10 339–10 346, 2001.
Savoie, D. L. and Prospero, J. M.: Particle-Size Distribution of Ni-trate and Sulfate in the Marine Atmosphere, Geophys. Res. Lett., 9, 1207–1210, 1982.
Seisel, S., Lian, Y., Keil, T., Trukhin, M. E., and Zellner, R.: Kinet-ics of the interaction of water vapour with mineral dust and soot surfaces at T=298 K, Phys. Chem. Chem. Phys., 6, 1926–1932, 2004.
Stipp, S. L. S.: Toward a conceptual model of the calcite sur-face: Hydration, hydrolysis, and surface potential, Geochim. Cosmochim. Acta, 63, 3121–3131, 1999.
Stipp, S. L. S., Eggleston, C. M., and Nielsen, B. S.: Calcite Surface-Structure Observed at Microtopographic and Molecular Scales with Atomic-Force Microscopy (AFM), Geochim. Cos-mochim. Acta, 58, 3023–3033, 1994.