ACPD
13, 8873–8900, 2013Uptake of HO2
radicals on Arizona test dust surface
Y. Bedjanian et al.
Title Page
Abstract Introduction
Conclusions References
Tables Figures
◭ ◮
◭ ◮
Back Close
Full Screen / Esc
Printer-friendly Version
Interactive Discussion
Discussion
P
a
per
|
Dis
cussion
P
a
per
|
Discussion
P
a
per
|
Discussio
n
P
a
per
|
Atmos. Chem. Phys. Discuss., 13, 8873–8900, 2013 www.atmos-chem-phys-discuss.net/13/8873/2013/ doi:10.5194/acpd-13-8873-2013
© Author(s) 2013. CC Attribution 3.0 License.
Atmospheric Chemistry and Physics
Open Access
Discussions
Geoscientiic Geoscientiic
Geoscientiic Geoscientiic
This discussion paper is/has been under review for the journal Atmospheric Chemistry and Physics (ACP). Please refer to the corresponding final paper in ACP if available.
Uptake of HO
2
radicals on Arizona test
dust surface
Y. Bedjanian, M. N. Romanias, and A. El Zein
Institut de Combustion, A ´erothermique, R ´eactivit ´e et Environnement (ICARE), CNRS, 45071 Orl ´eans Cedex 2, France
Received: 7 March 2013 – Accepted: 23 March 2013 – Published: 3 April 2013
Correspondence to: Y. Bedjanian ([email protected])
ACPD
13, 8873–8900, 2013Uptake of HO2
radicals on Arizona test dust surface
Y. Bedjanian et al.
Title Page
Abstract Introduction
Conclusions References
Tables Figures
◭ ◮
◭ ◮
Back Close
Full Screen / Esc
Printer-friendly Version
Interactive Discussion
Discussion
P
a
per
|
Dis
cussion
P
a
per
|
Discussion
P
a
per
|
Discussio
n
P
a
per
|
Abstract
The interaction of HO2 radicals with solid films of Arizona Test Dust (ATD) was
studied using a low pressure flow reactor (1–9 Torr) combined with a modulated molecular beam mass spectrometer for monitoring of the gaseous species involved. The reactive uptake coefficient of HO2 was measured from the kinetics of HO2
5
consumption on Pyrex rods coated with ATD as a function of HO2
concentra-tion ((0.35–3.30)×1012molecule cm−3), relative humidity (RH=0.02–94 %), temper-ature (T =275–320 K) and UV irradiance intensity (JNO2=0–0.012 s
−1
). The initial uptake coefficient was found to be independent of concentration of HO2,
temper-ature and irradiation conditions, and to decrease with increasing relative humidity: 10
γ0=1.2/(18.7+RH 1.1
) (calculated using geometric surface area, with 30 % estimated conservative uncertainty). An upper limit of 5 % was found for the H2O2forming
path-way of the HO2 reaction with ATD surface. The results of the measurements indicate
that HO2 loss on dust aerosol may be a non negligible sink for HOx species in the troposphere with the effect depending on specific local conditions.
15
1 Introduction
The HO2 radical is an important atmospheric species, which controls the oxidative capacity of the troposphere through rapid interconversion between HOx (OH, HO2)
species. HO2 is a precursor of the tropospheric ozone through its reaction with NO
and further photodissociation of NO2, resulting in production of ozone in the presence 20
of oxygen (Finlayson-Pitts and Pitts, 2000). The HO2 radical is also involved in HOx
and halogen catalyzed cycles of stratospheric ozone depletion (Bedjanian and Poulet, 2003).
The atmospheric concentration of HOx family is controlled by the production and
loss rates of these species. While the chemistry of HOx in the gas phase is, in
gen-25
ACPD
13, 8873–8900, 2013Uptake of HO2
radicals on Arizona test dust surface
Y. Bedjanian et al.
Title Page
Abstract Introduction
Conclusions References
Tables Figures
◭ ◮
◭ ◮
Back Close
Full Screen / Esc
Printer-friendly Version
Interactive Discussion
Discussion
P
a
per
|
Dis
cussion
P
a
per
|
Discussion
P
a
per
|
Discussio
n
P
a
per
|
strong need for such data are more and more frequently mentioned in the literature (Thornton et al., 2008; Mao et al., 2010; Macintyre and Evans, 2011). The informa-tion on kinetics and mechanism of the interacinforma-tion of HOx with different surfaces of
atmospheric relevance is essential to accurate modelling of the chemical composition and prediction of changes in the oxidative capacity of the troposphere and regional air 5
quality. Numerous previous studies have consistently reported a discrepancy between modelled and observed concentrations of HO2in different regions. The overestimation
of HO2 concentrations by the models was attributed to heterogeneous loss of these radicals on aerosol surface as a missing HO2 sink, not properly accounted for in the
models (Cantrell et al., 1996a,b; Jaegl ´e et al., 2000; Kanaya et al., 2000; Sommariva 10
et al., 2004, 2006; De Reus et al., 2005; Mao et al., 2010). The laboratory database for uptake coefficients of HO2on different surface types is rather scarce, especially for
solid surfaces. For example, only one direct study is available for HO2uptake on soot
(Bedjanian et al., 2005) and no data have been reported so far for the interaction of HO2 with mineral dust surfaces. In a few studies, attempts were made to summarize
15
the available uptake data and parameterize them for further use in atmospheric mod-elling (Jacob, 2000; Thornton et al., 2008; Macintyre and Evans, 2011). Thus, recently, Macintyre and Evans (2011) reviewed the existing laboratory data on HO2 uptake on
tropospheric aerosol and derived the global mean uptake coefficient of HO2,γ= 0.028,
which is by an order of magnitude lower than those considered in earlier works (Jacob, 20
2000; Thornton et al., 2008). Another critical issue concerning the heterogeneous in-teraction of HO2 with atmospheric aerosol is the reaction mechanism, especially with
regard to the formation of H2O2 as the reaction product. Depending on whether or not H2O2 is produced, the HO2 uptake on aerosols has opposite effects on the
concen-tration of H2O2. The only product study of HO2 interaction with solid surface is that of
25
Loukhovitskaya et al. (2009), where H2O2 was identified as the main product of the HO2reaction with a solid salt surface.
Considering the limited kinetic and mechanistic data on HO2-aerosol interaction and
ACPD
13, 8873–8900, 2013Uptake of HO2
radicals on Arizona test dust surface
Y. Bedjanian et al.
Title Page
Abstract Introduction
Conclusions References
Tables Figures
◭ ◮
◭ ◮
Back Close
Full Screen / Esc
Printer-friendly Version
Interactive Discussion
Discussion
P
a
per
|
Dis
cussion
P
a
per
|
Discussion
P
a
per
|
Discussio
n
P
a
per
|
in atmospheric modelling of HOx budget, it is clear that additional laboratory studies of HO2 uptake, including product study as well as temperature and relative humidity
dependence, on various aerosol types are strongly required. In the present study we report the measurements of the uptake coefficient of HO2 radicals on Arizona Test Dust (ATD), mimicking the mineral atmospheric aerosol, under dark and UV irradiation 5
conditions as a function of relative humidity and temperature. The possible formation of H2O2as a reaction product is also examined.
2 Experimental
2.1 Preparation of ATD films
Solid films of ATD were deposited on the outer surface of a Pyrex tube (0.9 cm o.d.) 10
using suspension of ATD (Powder Technology Inc., nominal 0–3 µm ATD) in ethanol. Prior to film deposition, the Pyrex tube was treated with hydrofluoric acid and washed with distilled water and ethanol. Then the tube was immersed into the suspension, withdrawn and dried with a fan heater. As a result, rather homogeneous (to eye) solid films were formed at the Pyrex surface. In order to eliminate the possible residual traces 15
of ethanol, prior to uptake experiments, the freshly prepared ATD samples were heated at (100–150)◦C during (20–30) min under pumping. In order to measure the mass of the sample on the Pyrex tube the deposited solid film was mechanically removed at the end of the kinetic experiments. BET surface area of the ATD powder was determined using a Quantachrome – Autosorb -1-MP-6 apparatus and nitrogen as adsorbate gas 20
and was found to be 85±10 m2g−1.
2.2 Flow reactor
The interaction of HO2with solid ATD films was studied at 1–9 Torr total pressure of He
ACPD
13, 8873–8900, 2013Uptake of HO2
radicals on Arizona test dust surface
Y. Bedjanian et al.
Title Page
Abstract Introduction
Conclusions References
Tables Figures
◭ ◮
◭ ◮
Back Close
Full Screen / Esc
Printer-friendly Version
Interactive Discussion
Discussion
P
a
per
|
Dis
cussion
P
a
per
|
Discussion
P
a
per
|
Discussio
n
P
a
per
|
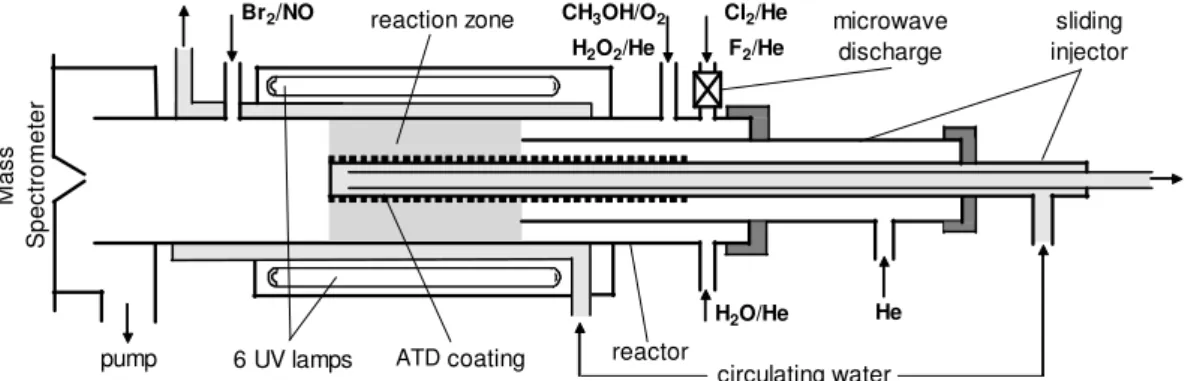
kinetic measurements were described in previous papers from this group (Bedjanian et al., 2005; Loukhovitskaya et al., 2009; El Zein and Bedjanian, 2012). The main reac-tor (Fig. 1) consisted of a Pyrex tube (40 cm length and 2.4 cm i.d.) with a jacket for the thermostatted liquid circulation. Experiments were carried out using a coaxial configu-ration of the flow reactor with movable central injector: the Pyrex tube with deposited 5
sample was introduced into the main reactor along its axis. The coated tube could be moved relative to the outer tube of the injector that allowed the variation of the solid film length exposed to gas phase reactant and consequently of the reaction time. The walls of the main reactor as well as of the outer tube of the movable injector (in contact with HO2) were coated with halocarbon wax in order to minimize the heterogeneous
10
loss of HO2outside the reaction zone.
Externally, the reactor was surrounded by 6 UV lamps (Sylvania BL350, 8 W) with a broad UV emission spectrum between 315−400 nm. The UV lamps were installed into an aluminum light-tight box covering the main reactor tube. Therefore, by switching on or offthe lamps, the kinetic measurements could be realized under UV irradiation or 15
dark conditions, respectively. The irradiance intensity in the reactor was characterized by direct measurements of the NO2 photolysis frequency, JNO2, as a function of the
number of lamps switched on. The values ofJNO2 were found to be between 0.002 and
0.012 s−1for 1 to 6 lamps switched on, respectively (El Zein and Bedjanian, 2012).
2.3 Generation of HO2radicals and measurement of absolute concentrations 20
Two methods were used to produce HO2 radicals. In the first one, HO2radicals were
formed in the fast reaction of fluorine atoms, produced in the microwave discharge of F2/He mixture, with excess H2O2:
F+H2O2→HO2+HF (R1)
It was verified by mass spectrometry that more than 90 % of F2 was dissociated 25
in the microwave discharge. Initial concentrations of F2 and H2O2 were ∼10 12
and
ACPD
13, 8873–8900, 2013Uptake of HO2
radicals on Arizona test dust surface
Y. Bedjanian et al.
Title Page
Abstract Introduction
Conclusions References
Tables Figures
◭ ◮
◭ ◮
Back Close
Full Screen / Esc
Printer-friendly Version
Interactive Discussion
Discussion
P
a
per
|
Dis
cussion
P
a
per
|
Discussion
P
a
per
|
Discussio
n
P
a
per
|
inside the microwave cavity, a ceramic (Al2O3) tube was inserted in this part of the discharge tube. The second source of HO2 used in this study was the reaction of Cl
atoms with an excess of CH3OH in presence of O2:
Cl+CH3OH→CH2OH+HCl (R2)
CH2OH+O2→HO2+CH2O (R3)
5
Chlorine atoms were generated by microwave discharge in Cl2diluted with He. Initial concentration of Cl2 was in the range (1–3)×1012molecule cm−3, and the fraction of
dissociated Cl2 was around 20–30 %. Methanol was introduced into the reactor from
a bubler containing thermostated (T =298 K) liquid methanol. The concentrations of methanol and oxygen in the reactor were generally in the range (1–3)×1014 and (3–
10
10)×1014molecule cm−3, respectively. Under these experimental conditions Reactions (R2) and (R3) were rapidly completed ensuring that chlorine atoms and CH2OH
radi-cals did not reach the reaction zone (in contact with dust sample).
Combination of the chemical conversion method with mass spectrometry provides a few possibilities for HO2 detection (Bedjanian et al., 2001). HO2 radicals may be
15
detected at their parent peak atm/z=33 (HO+2). This signal should be corrected for the contribution of H2O2 due to its fragmentation in the ion source, which was operating
at 25–30 eV. These corrections could be easily done by simultaneous detection of the signals from H2O2 at m/z=33 and 34. The contribution of H2O2 at m/z=33 was on the order of 3 % of the intensity of H2O2peak atm/z=34. HO2 may also be detected
20
by chemical conversion to NO2(m/z=46) through reaction with NO:
HO2+NO→OH+NO2 (R4)
Reaction (R4) leads to simultaneous production of OH radicals, which may be rapidly scavenged by Br2(when added simultaneously with NO) through Reaction (R5),
form-ing HOBr (Bedjanian et al., 1999b): 25
ACPD
13, 8873–8900, 2013Uptake of HO2
radicals on Arizona test dust surface
Y. Bedjanian et al.
Title Page
Abstract Introduction
Conclusions References
Tables Figures
◭ ◮
◭ ◮
Back Close
Full Screen / Esc
Printer-friendly Version
Interactive Discussion
Discussion
P
a
per
|
Dis
cussion
P
a
per
|
Discussion
P
a
per
|
Discussio
n
P
a
per
|
Assuming a stoichiometric conversion of HO2 to NO2 and OH to HOBr, one has: [HO2]=[NO2] =[HOBr]. Thus, in addition, HO2 may be detected at m/z=96/98 as
HOBr+. In the present study, the HO2 detection at m/z=46 (NO+2) and m/z=96/98
(HOBr+) was preferred to the detection at its parent peak (m/z=33, HO+2), since the sensitivity of the mass spectrometer at these masses was higher and correspond-5
ing MS signals were free of contributions of other species and, consequently, did not require any corrections. It should be mentioned that the concentrations of HO2 deter-mined through [NO2] and [HOBr] measurements were found to be in agreement within
10 %. NO and Br2, involved in titration Reactions (R4) and (R5), were introduced at
rel-atively high concentrations (∼5×10¹³molecule cm−3) at the end of the reactor through 10
inlet located upstream of the sampling cone (Fig. 1).
Similar reactive configuration, consisting of conversion of HO2 to NO2 and HOBr,
was also used for the determination of the absolute concentrations of HO2 radicals.
The absolute concentrations of HOBr were measured using the reaction of OH radicals with excess Br2(Reaction R5). In the calibration experiments OH radicals were formed
15
through the fast reaction of H atoms with excess NO2:
H+NO2→OH+NO (R6)
Thus, HOBr concentrations were determined from the consumed concentration of Br2:
[OH]=[HOBr]= ∆[Br2]. The possible influence of secondary chemistry on the proce-dure used for the absolute calibration of HOBr signals was discussed in details in pre-20
vious papers (Bedjanian et al., 1999a, 2001) and was shown to be negligible.
The concentrations of the stable gas phase species (NO, NO2, Br2) in the reac-tor were calculated from their volumetric flow rates obtained from the measurements of pressure drop of mixtures of the species with helium in calibrated volume flasks. The absolute calibration of H2O2 has been performed by injecting known amounts 25
(0.5−10 µL) of the 60 wt % solution inside the flow tube reactor and recording the par-ent mass peak intensity of H2O2 at m/z=34. The integrated area of the mass
spec-trometric signals corresponding to the known total number of H2O2molecules injected
ACPD
13, 8873–8900, 2013Uptake of HO2
radicals on Arizona test dust surface
Y. Bedjanian et al.
Title Page
Abstract Introduction
Conclusions References
Tables Figures
◭ ◮
◭ ◮
Back Close
Full Screen / Esc
Printer-friendly Version
Interactive Discussion
Discussion
P
a
per
|
Dis
cussion
P
a
per
|
Discussion
P
a
per
|
Discussio
n
P
a
per
|
of water vapor were determined by calculating the H2O flow rate from the total (H2O+ He) and H2O vapor pressures in the bubbler and the measured flow rate of He through
the bubbler.
3 Results
3.1 Kinetics of HO2loss 5
Figure 2 displays a typical behavior of the concentration of HO2radicals upon
introduc-tion of the ATD coated tube into the reacintroduc-tion zone (sample in). Fast initial consumpintroduc-tion of HO2, followed by surface deactivation resulting in a decrease of HO2loss rate, was
observed. When the mineral sample was withdrawn from the reaction zone after expo-sure to HO2 (sample out,t≈86 min), that is when HO2 was no longer in contact with
10
the sample surface, the concentration of HO2recovered rapidly to its initial value. One
may note that irradiation of the ATD surface with 6 UV lamps (UV on) had no impact on the kinetics of HO2 loss. In the present study we have measured the initial uptake coefficient of HO2(γ0), because the “quasi” steady state uptake of HO2 was found to
slowly decrease with exposure time (Fig. 2) and, in addition, could be influenced by the 15
presence of the species from the HO2sources. The uptake coefficient was determined as the probability of irreversible loss of the radicals per collision with dust surface:
γ=4k
′
ω ×
V
S (1)
wherek′
is the first order rate coefficient of HO2 loss (s −1
),ωthe average molecular speed (cm s−1),V the volume of the reaction zone (cm3) andS the surface area of the 20
solid sample involved in the heterogeneous reaction (cm2).
Figure 3 displays examples of HO2loss kinetics in heterogeneous reaction with the
ACPD
13, 8873–8900, 2013Uptake of HO2
radicals on Arizona test dust surface
Y. Bedjanian et al.
Title Page
Abstract Introduction
Conclusions References
Tables Figures
◭ ◮
◭ ◮
Back Close
Full Screen / Esc
Printer-friendly Version
Interactive Discussion
Discussion
P
a
per
|
Dis
cussion
P
a
per
|
Discussion
P
a
per
|
Discussio
n
P
a
per
|
HO2, which is equivalent to varying the reaction time. The decays of HO2were found to be exponential (solid lines in Fig. 3) and were treated with the first-order kinetics formalism, the rate constant being determined as:
k′ obs=−
d ln([HO2])
dt (2)
wheret is the reaction time defined by the sample length to flow velocity ratio. The 5
values of the observed first-order rate constants,kobs′ , determined from the decays of HO2should be corrected for the diffusion limitation in the HO2radial transport from the
volume to the reactive surface. The radial diffusion problem for the coaxial configuration of the reactor used in the present study was solved by Gershenzon and co-workers (Gershenzon et al., 1994, 1995):
10
1
k′ obs
= 1
k′+ R2 Kd(q)D
0
×P (3)
wherek′is a true rate constant,D0is the diffusion coefficient of HO2at 1 Torr pressure
(Torr cm2s−1),P is the total pressure in the reactor andKd(q) is a dimensionless rate constant of radial diffusion, which is a function of sample tube radius (r) to main reactor radius (R) ratio,q=r/R=0.375 (for configuration used in the present study). Diffusion 15
corrections onk′
obswere calculated using Eq. (3) withD0=430 Torr cm 2
s−1(Bedjanian et al., 2005; Ivanov et al., 2007) atT =298 K and assumingT1.75-dependence of the diffusion coefficient on temperature andKd(q)=4.4 (Gershenzon et al., 1995). In order to reduce rather elevated diffusion corrections on kobs′ due to high uptake of HO2 on ATD surface, most of experiments were carried out at relatively low pressure of 1 Torr. 20
The diffusion corrections applied tok′
obswere generally between 10 and 30 %, however
ACPD
13, 8873–8900, 2013Uptake of HO2
radicals on Arizona test dust surface
Y. Bedjanian et al.
Title Page
Abstract Introduction
Conclusions References
Tables Figures
◭ ◮
◭ ◮
Back Close
Full Screen / Esc
Printer-friendly Version
Interactive Discussion
Discussion
P
a
per
|
Dis
cussion
P
a
per
|
Discussion
P
a
per
|
Discussio
n
P
a
per
|
3.2 Dependence on sample mass
Surface area involved in the heterogeneous reaction is an important parameter which is required for calculation of the uptake coefficient. In order to determine the surface area of ATD accessible to HO2, the uptake of HO2 was measured as a function of the thickness of ATD sample. The experiments were performed atT =300 K under dry 5
conditions. The obtained results are presented in Fig. 4, where the uptake coefficient of HO2, calculated applying the geometric (projected) surface area of ATD sample, is shown as a function of the ATD mass deposited per unity length of the support tube. One may note that three different regimes were observed: the first one, where ge-ometric uptake coefficient linearly increases upon increase of the sample mass (up 10
to nearly 0.06 mg cm−1), the second one (transition region, between 0.06 and nearly 1 mg cm−1), where γ continues to increase slowly, and, finally, the saturation region, where the uptake coefficient is mass-independent (>1 mg cm−1). The linear depen-dence ofγgeom on mass (thickness) of the reactive film is generally considered as an
indication that the entire surface area of the solid sample is accessible to the gaseous 15
reactant (Underwood et al., 2000), which implies the use of the BET surface area in the calculations of true uptake coefficient. In the present study the linear regime of the uptake coefficient was observed at relatively low masses of the ATD coating. Working with such low masses of solid samples was associated with some experimental diffi cul-ties. Firstly, by the method that we used, the measurement of the total dust masses of 20
a few tenths of mg was problematic and associated with high uncertainties. Secondly, the reproducibility of the kinetic data observed with dust samples of low masses was rather poor. In addition, the reason for the initial linear mass dependence ofγ at very low masses could also be the incomplete coverage of the support tube by dust aggre-gates. It is not certain that for sample mass lower than 0.06 mg cm−1 a coherent dust 25
ACPD
13, 8873–8900, 2013Uptake of HO2
radicals on Arizona test dust surface
Y. Bedjanian et al.
Title Page
Abstract Introduction
Conclusions References
Tables Figures
◭ ◮
◭ ◮
Back Close
Full Screen / Esc
Printer-friendly Version
Interactive Discussion
Discussion
P
a
per
|
Dis
cussion
P
a
per
|
Discussion
P
a
per
|
Discussio
n
P
a
per
|
geometric uptake is independent of the sample mass) and the uptake coefficient of HO2 was calculated with geometric (projected) surface area. Thereby, the uptake coefficient of HO2 from the present study should be considered as an upper limit. On the other
hand, the lower limit of the uptake coefficient may be also estimated. So applying the BET surface area to the experimental data observed for geometric uptake coefficient 5
at low masses (in linear regime), it turns out that the uptake coefficient calculated with total specific surface area is by a factor 40 lower than that with geometric one.
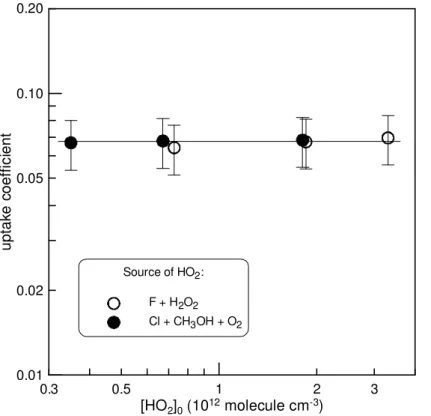
3.3 Dependence on initial concentration of HO2
The dependence ofγon initial concentration of HO2radicals, varied in the range (0.35–
3.3)×1012molecule cm−3, was measured at T =300 K under dry conditions (RH= 10
0.03 %). The observed results are displayed in Fig. 5. The initial uptake coefficient of HO2,γ (±2σ)=(6.7±0.4 )×10−2, was found to be independent of the initial
radi-cal concentration in the range of [HO2]0used. Generally, initial uptake (in case of first
order kinetics) is not expected to be dependent on the gas phase concentration of the reactant since at the initial stage of the surface exposure, the active sites on the sur-15
face are not depleted or blocked and are all available for the heterogeneous reaction. One may note that good agreement exists between the results obtained for the uptake coefficient using two different methods to generate HO2radicals (Fig. 5). This observa-tion seems to indicate that the presence of H2O2(when F+H2O2reaction is used for
generation of HO2) in the reactive system has a negligible impact, at least, on the
ini-20
tial uptake of HO2radicals on ATD surface. This was verified in additional experiments where the uptake coefficient of HO2was measured with concentration of H2O2varied
between 2×10¹³and 2.6×10¹⁴molecule cm−3. The values ofγmeasured in the
pres-ence of different concentrations of H2O2 in the reactor were found to be similar within
uncertainty of the measurements. Similar invariance of the initial uptake coefficient was 25
ACPD
13, 8873–8900, 2013Uptake of HO2
radicals on Arizona test dust surface
Y. Bedjanian et al.
Title Page
Abstract Introduction
Conclusions References
Tables Figures
◭ ◮
◭ ◮
Back Close
Full Screen / Esc
Printer-friendly Version
Interactive Discussion
Discussion
P
a
per
|
Dis
cussion
P
a
per
|
Discussion
P
a
per
|
Discussio
n
P
a
per
|
3.4 Dependence on RH, temperature and UV irradiation intensity
RH dependence of the uptake coefficient was studied atT =275 K, with relative humid-ity in the reactor being varied in the range (0.02–94) %. Rather low temperature was chosen for these experiments in order to provide reasonably high RH in the reactor with relatively low total pressures used. The results obtained for initial uptake coefficients 5
of HO2 on ATD surface are displayed in Fig. 6. One may note again that the uptake
data obtained using different chemical systems for generation of HO2 radicals (filled and open symbols in Fig. 6) are in agreement within the experimental uncertainty on the determination ofγ (estimated to be 20–30 %).
As it may be seen in Fig. 6, the values of the uptake coefficient can be considered as 10
RH independent under dry conditions (up to RH∼2 %). However, significant decrease ofγ is observed when RH is further increased. The solid line in Fig. 6 represents a fit to the experimental data according to the following expression:
γ0=1.2/(18.7+RH1.1)
This empirical equation allows describing our results in the whole RH range used with 15
estimated conservative uncertainty of 30 %.
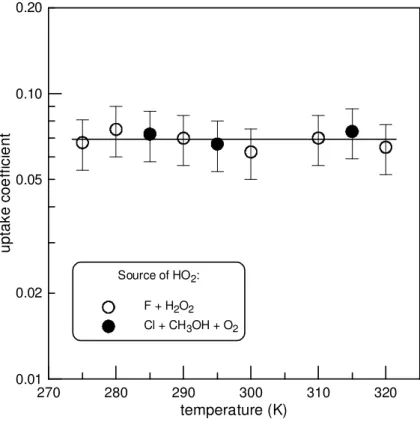
Temperature dependence of the uptake coefficient was measured in the temperature range (275–320) K at a fixed relative humidity of 0.04 %. The results are presented in Fig. 7. As one may note, the initial uptake coefficient was found to be independent of temperature.
20
Dependence of the uptake coefficient on the irradiation intensity was studied in ad-ditional experiments by switching on the different number of lamps in the reactor, from 1 to 6. This corresponds to the variation of the NO2 photolysis frequency from 0.002 to 0.012 s−1. Under these irradiance conditions we have not observed any effect of the UV irradiation on the kinetics of HO2loss (see Fig. 2, for example) on the ATD samples
25
ACPD
13, 8873–8900, 2013Uptake of HO2
radicals on Arizona test dust surface
Y. Bedjanian et al.
Title Page
Abstract Introduction
Conclusions References
Tables Figures
◭ ◮
◭ ◮
Back Close
Full Screen / Esc
Printer-friendly Version
Interactive Discussion
Discussion
P
a
per
|
Dis
cussion
P
a
per
|
Discussion
P
a
per
|
Discussio
n
P
a
per
|
3.5 Estimation of H2O2yield
In previous study from this group, H2O2was detected as a product of the HO2 uptake
on salt surface (Loukhovitskaya et al., 2009). In this work, we have examined the pos-sible H2O2 formation upon interaction of HO2 radicals with ATD surface. Experiments
were carried out at P=1 Torr total pressure,T = 300 K and under dry conditions. Re-5
action of Cl atoms with a large excess of CH3OH/O2 mixture was used as a source of HO2 radicals. The experiment consisted in the introduction of ATD sample in the
reaction zone (in contact with HO2) and monitoring of the consumed HO2
concentra-tion and possibly formed H2O2concentration. No changes in the relatively high (due to contribution of molecular oxygen) background signal atm/z=34 (parent peak of H2O2) 10
was observed upon heterogeneous consumption of 2.1×10¹²molecule cm−3 of HO2.
This non observation of H2O2in the gas phase allowed to set an upper limit of 5 % for
its yield in reaction of HO2with ATD surface. This upper limit of H2O2yield was deter-mined as a ratio of the concentration of H2O2 formed (<9.7×10
10
molecule cm−3) to the concentration of HO2consumed.
15
4 Discussion
This work reports the first measurement of the HO2 radical uptake on mineral dust. The uptake coefficient of HO2 on Arizona Test Dust measured in the present study decreases with relative humidity being nearly 2.6×10⁻²and 8.4×10⁻³at RH=20 and 80 %, respectively. The negative dependence of HO2 uptake on ATD surface on RH
20
may be compared with the effect of humidity on the rate of the heterogeneous loss of HO2on salt surfaces, for which a number of studies are available. For dry aerosol
parti-cles of NaCl, Taketani et al. (2008) observed an enhancement of the HO2uptake in the
presence of water vapor; however, Remorov et al. (2002) reported a decrease in the probability of HO2 uptake on NaCl upon addition of water in the reactor. In a previous
25
ACPD
13, 8873–8900, 2013Uptake of HO2
radicals on Arizona test dust surface
Y. Bedjanian et al.
Title Page
Abstract Introduction
Conclusions References
Tables Figures
◭ ◮
◭ ◮
Back Close
Full Screen / Esc
Printer-friendly Version
Interactive Discussion
Discussion
P
a
per
|
Dis
cussion
P
a
per
|
Discussion
P
a
per
|
Discussio
n
P
a
per
|
for the uptake of HO2on solid NaCl and NaBr, however, inhibiting effect of water was observed for the uptake of HO2 on MgCl2×6H2O, which is a more hygroscopic salt
(Bedjanian and Loukhovitskaya, 2011). Much higher values of the uptake coefficient compared to dry salt were systematically observed for wet particles (Taketani et al., 2008, 2009) suggesting that heterogeneous loss of HO2is enhanced by particles
con-5
taining water. One may note that even for salt surfaces the available information on RH dependence of HO2uptake is controversial. The RH dependence ofγobserved in the present study (decrease of the uptake coefficient upon increase of RH) points to the role of water rather as blocking the available active sites on the surface. It may be noted that theγvalues measured in the present study for RH between 20 and 80 % are close 10
to that measured for the uptake coefficient of HO2 on water, γ≥0.01 (Hanson et al.,
1992). This fact seems to correlate, at least qualitatively, with the available data for the adsorption of water on mineral oxides (Goodman et al., 2001; Ma et al., 2010). Indeed, it was reported that water adsorption to SiO2, Al2O3, MgO, Fe2O3, and TiO2(which are components of ATD) could be well described with the Brunauer−Emmett−Teller (BET) 15
type isotherm, with the monolayer coverage occurring between 20 and 30 % relative humidity (Goodman et al., 2001; Ma et al., 2010).
In only one previous product study of HO2interaction with solid surface
(Loukhovit-skaya et al., 2009), H2O2 was identified as the main product of the HO2 reaction with
surface of NaBr. Considering the measured H2O2 yield of nearly 0.5, Loukhovitskaya 20
et al. (2009) proposed a two-step reaction mechanism resulting in the HO2
recombi-nation on the surface. The upper limit of 5 %, determined in the present study for the gaseous H2O2forming channel of the HO2+ATD reaction, points to a different mech-anism of the reactive uptake of HO2 on mineral oxides. For example, HO2 may react
with OH groups present on the surfaces of mineral oxides leading to formation of H2O
25
and O2 as final reaction products. Another point, which should be mentioned, is the rather high reactive uptake of H2O2 on mineral surfaces which was recently reported
ACPD
13, 8873–8900, 2013Uptake of HO2
radicals on Arizona test dust surface
Y. Bedjanian et al.
Title Page
Abstract Introduction
Conclusions References
Tables Figures
◭ ◮
◭ ◮
Back Close
Full Screen / Esc
Printer-friendly Version
Interactive Discussion
Discussion
P
a
per
|
Dis
cussion
P
a
per
|
Discussion
P
a
per
|
Discussio
n
P
a
per
|
as a primary product, H2O2, once formed, may be further processed in heterogeneous reactions on ATD surface. Temperature dependence of the uptake coefficient measured on ATD surface is also quite different from those on salt surfaces. All temperature de-pendence studies of HO2uptake on solid salt particles report a rather strong negative temperature dependence of the uptake coefficient (Antsupov, 1988; Gratpanche et al., 5
1996; Remorov et al., 2002; Loukhovitskaya et al., 2009), while in the present study we have not observed any effect of temperature (for T =275–320 K) on the HO2 uptake on ATD. This seems to indicate once again the difference in the uptake mechanism on these surfaces. Let’s note that the temperature independent value of γ was also reported for the uptake of HO2on soot surface (Bedjanian et al., 2005).
10
The importance of HO2 loss in the heterogeneous reaction with atmospheric dust aerosol
HO2+dust→products (R7)
may be briefly discussed. First, it should be noted that the range ofγ reported in the present study is close to the global mean value of 0.028 based on recent parameteri-15
sation of the available laboratory data by Macintyre and Evans (2011), but this value is significantly lower than those adopted in earlier modeling studies. The potential atmo-spheric impact of Reaction (R7) may be roughly estimated by comparing its rate with that of the known loss processes of HOx in the atmosphere. In the high NOx regime
(polluted urban troposphere) a major gas phase sink for the HOx species is Reaction 20
(R8) of OH radicals with NO2
OH+NO2(+M)→HNO3(+M) (R8)
combined with the heterogeneous removal of HNO3. For the ratio of the rates of the Reactions (R7) and (R8) one has:
R7
R8 =
k′ 7[HO2] k8[OH][NO2]
ACPD
13, 8873–8900, 2013Uptake of HO2
radicals on Arizona test dust surface
Y. Bedjanian et al.
Title Page
Abstract Introduction
Conclusions References
Tables Figures
◭ ◮
◭ ◮
Back Close
Full Screen / Esc
Printer-friendly Version
Interactive Discussion
Discussion
P
a
per
|
Dis
cussion
P
a
per
|
Discussion
P
a
per
|
Discussio
n
P
a
per
|
In accordance with
k′ 7=
ωγ
4
S V
and using γ=0.02 measured in the present study for RH=30 %, dust surface load-ing of ∼10−6cm2cm−3 (Zhang and Carmichael, 1999; De Reus et al., 2005) the calculated value is:k′
7≈2.2×10 −4
s−1 (for T =300 K). Further, using the value, k8∼
5
10−11cm3molecule−1s−1(Sander et al., 2011) and a typical ratio [HO2]/[OH]∼100, we
obtain: R7/R8=2.2×10 9/[NO2]. This ratio indicates that for concentrations of NO2 of
a few ppbv heterogeneous loss of HO2 does not represent a significant sink for HOx
compared with Reaction (R8). However, under specific conditions, for example, of se-vere dust storm, when aerosol surface loading can be as high as 2×10 −5cm2cm−3
10
(Zhang and Carmichael, 1999) the rate of Reaction (R7) may be comparable with that of the OH+NO2reaction.
Under low NOx conditions (free troposphere) the loss of atmospheric HOxis mainly due to reactions between HOx radicals:
OH+HO2→H2O+O2 (R9)
15
HO2+HO2→H2O2+O2 (R10)
The rate of HO2 loss in heterogeneous Reaction (R7) may be compared with that of self-reaction of HO2radicals:
R7 R10
= k
′ 7[HO2]
2k10[HO2]2
= k
′ 7
2k10[HO2]
20
One may note that the relative contribution of Reaction (R7) in this case depends on the absolute concentration of HO2, because the rate of the self-reaction of HO2is
ACPD
13, 8873–8900, 2013Uptake of HO2
radicals on Arizona test dust surface
Y. Bedjanian et al.
Title Page
Abstract Introduction
Conclusions References
Tables Figures
◭ ◮
◭ ◮
Back Close
Full Screen / Esc
Printer-friendly Version
Interactive Discussion
Discussion
P
a
per
|
Dis
cussion
P
a
per
|
Discussion
P
a
per
|
Discussio
n
P
a
per
|
the range (0.1–2)×10−5cm2cm−3),k10∼=2.5×10 −12
cm3molecule−1s−1(Sander et al., 2011) and typical HO2concentration of∼108molecule cm−3, we obtain R7/R10=0.44–
8.8. These calculations show that heterogeneous sink for HO2 on aerosol surface
may be comparable and even higher, during severe dust storm events, than HO2loss
through self reaction. This point is of importance not only for HOx but also for H2O2 5
budget considering the absence of H2O2 in the products of HO2 interaction with dust
aerosol shown in the present study. The conclusion of these rough estimations is that HO2 loss on dust aerosol may be a non negligible sink for HOx species in the tropo-sphere with an effect depending on specific conditions such as aerosol loading, relative humidity, concentrations of HOx. It should be noted however that all the considerations
10
above were based on the upper limit of the uptake coefficient measured on Arizona Test Dust. ATD, representing Arizona sand, mimics quite well the chemical composi-tion of atmospheric dust, however it may differ from it in some physical and chemical properties. It is clear that additional measurements of the HO2interaction with real dust
samples from different locations would be very useful. 15
Acknowledgements. This study was supported by ANR from Photodust grant. A. E. Z. is very grateful to r ´egion Centre for financing his Ph.D. grant.
References
Antsupov, E.: Temperature dependence of the heterogeneous loss of HO2 radical studied by laser magnetic resonance method, Sov. J. Chem. Phys., 7, 1082–1086, 1988.
20
Bedjanian, Y. and Loukhovitskaya, E.: Adsorption of water vapor on MgCl2×6H2O salt surface, Atmos. Environ., 45, 2373–2378, 2011.
Bedjanian, Y. and Poulet, G.: Kinetics of halogen oxide radicals in the stratosphere, Chem. Rev., 103, 4639–4656, 2003.
Bedjanian, Y., Le Bras, G., and Poulet, G.: Kinetic study of OH+OH and OD+OD reactions, J.
25
Phys. Chem. A, 103, 7017–7025, 1999a.
ACPD
13, 8873–8900, 2013Uptake of HO2
radicals on Arizona test dust surface
Y. Bedjanian et al.
Title Page
Abstract Introduction
Conclusions References
Tables Figures
◭ ◮
◭ ◮
Back Close
Full Screen / Esc
Printer-friendly Version
Interactive Discussion
Discussion
P
a
per
|
Dis
cussion
P
a
per
|
Discussion
P
a
per
|
Discussio
n
P
a
per
|
Bedjanian, Y., Riffault, V., Le Bras, G., and Poulet, G.: Kinetic study of the reactions of Br with HO2and DO2, J. Phys. Chem. A, 105, 573–578, 2001.
Bedjanian, Y., Leli `evre, S., and Le Bras, G.: Experimental study of the interaction of HO2 radi-cals with soot surface, Phys. Chem. Chem. Phys., 7, 334–341, 2005.
Cantrell, C. A., Shetter, R. E., Gilpin, T. M., and Calvert, J. G.: Peroxy radicals measured
dur-5
ing Mauna Loa Observatory Photochemistry Experiment 2: the data and first analysis, J. Geophys. Res., 101, 14643–14652, doi:10.1029/95JD01698, 1996a.
Cantrell, C. A., Shetter, R. E., Gilpin, T. M., Calvert, J. G., Eisele, F. L., and Tanner, D. J.: Peroxy radical concentrations measured and calculated from trace gas measurements in the Mauna Loa Observatory Photochemistry Experiment 2, J. Geophys. Res., 101, 14653–
10
14664, doi:10.1029/95JD03613, 1996b.
de Reus, M., Fischer, H., Sander, R., Gros, V., Kormann, R., Salisbury, G., Van Dingenen, R., Williams, J., Z ¨ollner, M., and Lelieveld, J.: Observations and model calculations of trace gas scavenging in a dense Saharan dust plume during MINATROC, Atmos. Chem. Phys., 5, 1787–1803, doi:10.5194/acp-5-1787-2005, 2005.
15
El Zein, A. and Bedjanian, Y.: Interaction of NO2with TiO2surface under UV irradiation: mea-surements of the uptake coefficient, Atmos. Chem. Phys., 12, 1013–1020, doi:10.5194/acp-12-1013-2012, 2012.
Finlayson-Pitts, B. J. and Pitts, J. N. J.: Chemistry of the Upper and Lower Atmosphere: Theory, Experiments and Applications, Academic Press, San Diego, 2000.
20
Gershenzon, Y. M., Grigorieva, V. M., Zasypkin, A. Y., and Remorov, R. G.: Theory of radial diffusion and first order wall reaction in movable and immovable media, in: Book of Abstracts, Proceedings of the 13th International Symposium on Gas Kinetics, Dublin, Ireland, 420–422, 1994.
Gershenzon, Y. M., Grigorieva, V. M., Ivanov, A. V., and Remorov, R. G.: O3and OH sensitivity
25
to heterogeneous sinks of HOxand CH3O2on aerosol particles, Faraday Discuss., 100, 83– 100, 1995.
Goodman, A. L., Bernard, E. T., and Grassian, V. H.: Spectroscopic study of nitric acid and water adsorption on oxide particles: enhanced nitric acid uptake kinetics in the presence of adsorbed water, J. Phys. Chem. A, 105, 6443–6457, 2001.
30
ACPD
13, 8873–8900, 2013Uptake of HO2
radicals on Arizona test dust surface
Y. Bedjanian et al.
Title Page
Abstract Introduction
Conclusions References
Tables Figures
◭ ◮
◭ ◮
Back Close
Full Screen / Esc
Printer-friendly Version
Interactive Discussion
Discussion
P
a
per
|
Dis
cussion
P
a
per
|
Discussion
P
a
per
|
Discussio
n
P
a
per
|
Hanson, D. R., Burkholder, J. B., Howard, C. J., and Ravishankara, A. R.: Measurement of hydroxyl and hydroperoxy radical uptake coefficients on water and sulfuric acid surfaces, J. Phys. Chem., 96, 4979–4985, doi:10.1021/j100191a046, 1992.
Ivanov, A. V., Trakhtenberg, S., Bertram, A. K., Gershenzon, Y. M., and Molina, M. J.: OH, HO2, and ozone gaseous diffusion coefficients, J. Phys. Chem. A, 111, 1632–1637, 2007.
5
Jacob, D. J.: Heterogeneous chemistry and tropospheric ozone, Atmos. Environ., 34, 2131– 2159, 2000.
Jaegl ´e, L., Jacob, D. J., Brune, W. H., Faloona, I., Tan, D., Heikes, B. G., Kondo, Y., Sachse, G. W., Anderson, B., Gregory, G. L., Singh, H. B., Pueschel, R., Ferry, G., Blake, D. R., and Shetter, R. E.: Photochemistry of HOxin the upper troposphere at northern
10
midlatitudes, J. Geophys. Res., 105, 3877–3892, doi:10.1029/1999JD901016, 2000. Kanaya, Y., Sadanaga, Y., Matsumoto, J., Sharma, U. K., Hirokawa, J., Kajii, Y., and
Akimoto, H.: Daytime HO2 concentrations at Oki Island, Japan, in summer 1998: comparison between measurement and theory, J. Geophys. Res., 105, 24205–24222, doi:10.1029/2000JD900308, 2000.
15
Loukhovitskaya, E., Bedjanian, Y., Morozov, I., and Le Bras, G.: Laboratory study of the interac-tion of HO2radicals with the NaCl, NaBr, MgCl2×6H2O and sea salt surfaces, Phys. Chem. Chem. Phys., 11, 7896–7905, 2009.
Ma, Q., He, H., and Liu, Y.: In situ DRIFTS study of hygroscopic behavior of mineral aerosol, J. Environ. Sci., 22, 555–560, doi:10.1016/S1001-0742(09)60145-5, 2010.
20
Macintyre, H. L. and Evans, M. J.: Parameterisation and impact of aerosol uptake of HO2 on a global tropospheric model, Atmos. Chem. Phys., 11, 10965–10974, doi:10.5194/acp-11-10965-2011, 2011.
Mao, J., Jacob, D. J., Evans, M. J., Olson, J. R., Ren, X., Brune, W. H., Clair, J. M. St., Crounse, J. D., Spencer, K. M., Beaver, M. R., Wennberg, P. O., Cubison, M. J.,
25
Jimenez, J. L., Fried, A., Weibring, P., Walega, J. G., Hall, S. R., Weinheimer, A. J., Co-hen, R. C., CCo-hen, G., Crawford, J. H., McNaughton, C., Clarke, A. D., Jaegl ´e, L., Fisher, J. A., Yantosca, R. M., Le Sager, P., and Carouge, C.: Chemistry of hydrogen oxide radicals (HOx) in the Arctic troposphere in spring, Atmos. Chem. Phys., 10, 5823–5838, doi:10.5194/acp-10-5823-2010, 2010.
30
ACPD
13, 8873–8900, 2013Uptake of HO2
radicals on Arizona test dust surface
Y. Bedjanian et al.
Title Page
Abstract Introduction
Conclusions References
Tables Figures
◭ ◮
◭ ◮
Back Close
Full Screen / Esc
Printer-friendly Version
Interactive Discussion
Discussion
P
a
per
|
Dis
cussion
P
a
per
|
Discussion
P
a
per
|
Discussio
n
P
a
per
|
Pradhan, M., Kyriakou, G., Archibald, A. T., Papageorgiou, A. C., Kalberer, M., and Lam-bert, R. M.: Heterogeneous uptake of gaseous hydrogen peroxide by Gobi and Saharan dust aerosols: a potential missing sink for H2O2in the troposphere, Atmos. Chem. Phys., 10, 7127–7136, doi:10.5194/acp-10-7127-2010, 2010b.
Remorov, R. G., Gershenzon, Y. M., Molina, L. T., and Molina, M. J.: Kinetics and mechanism
5
of HO2uptake on solid NaCl, J. Phys. Chem. A, 106, 4558–4565, 2002.
Romanias, M. N., El Zein, A., and Bedjanian, Y.: Heterogeneous interaction of H2O2with TiO2 surface under dark and UV light irradiation conditions, J. Phys. Chem. A, 116, 8191–8200, 2012.
Sander, S. P., Abbatt, J., Barker, J. R., Burkholder, J. B., Friedl, R. R., Golden, D. M., Huie, R. E.,
10
Kolb, C. E., Kurylo, M. J., Moortgat, G. K., Orkin, V. L., and Wine, P. H.: Chemical Kinetics and Photochemical Data for Use in Atmospheric Studies, Evaluation No. 17, JPL Publication 10–6, Jet Propulsion Laboratory, Pasadena, 2011.
Sommariva, R., Haggerstone, A.-L., Carpenter, L. J., Carslaw, N., Creasey, D. J., Heard, D. E., Lee, J. D., Lewis, A. C., Pilling, M. J., and Z ´ador, J.: OH and HO2chemistry in clean marine air
15
during SOAPEX-2, Atmos. Chem. Phys., 4, 839–856, doi:10.5194/acp-4-839-2004, 2004. Sommariva, R., Bloss, W. J., Brough, N., Carslaw, N., Flynn, M., Haggerstone, A.-L.,
Heard, D. E., Hopkins, J. R., Lee, J. D., Lewis, A. C., McFiggans, G., Monks, P. S., Pen-kett, S. A., Pilling, M. J., Plane, J. M. C., Read, K. A., Saiz-Lopez, A., Rickard, A. R., and Williams, P. I.: OH and HO2 chemistry during NAMBLEX: roles of oxygenates, halogen
ox-20
ides and heterogeneous uptake, Atmos. Chem. Phys., 6, 1135–1153, doi:10.5194/acp-6-1135-2006, 2006.
Taketani, F., Kanaya, Y., and Akimoto, H.: Kinetics of heterogeneous reactions of HO2radical at ambient concentration levels with (NH4)2SO4and NaCl aerosol particles, J. Phys. Chem. A, 112, 2370–2377, 2008.
25
Taketani, F., Kanaya, Y., and Akimoto, H.: Heterogeneous loss of HO2 by KCl, synthetic sea salt, and natural seawater aerosol particles, Atmos. Environ., 43, 1660–1665, 2009.
Thornton, J. A., Jaegl ´e, L., and McNeill, V. F.: Assessing known pathways for HO2 loss in aqueous atmospheric aerosols: regional and global impacts on tropospheric oxidants, J. Geophys. Res., 113, D05303, doi:10.1029/2007JD009236, 2008.
30
ACPD
13, 8873–8900, 2013Uptake of HO2
radicals on Arizona test dust surface
Y. Bedjanian et al.
Title Page
Abstract Introduction
Conclusions References
Tables Figures
◭ ◮
◭ ◮
Back Close
Full Screen / Esc
Printer-friendly Version
Interactive Discussion
Discussion
P
a
per
|
Dis
cussion
P
a
per
|
Discussion
P
a
per
|
Discussio
n
P
a
per
|
Wang, W.-G., Ge, M.-F., and Sun, Q.: Heterogeneous uptake of hydrogen peroxide on mineral oxides, Chin. J. Chem. Phys., 24, 515–520, 2011.
ACPD
13, 8873–8900, 2013Uptake of HO2
radicals on Arizona test dust surface
Y. Bedjanian et al.
Title Page
Abstract Introduction
Conclusions References
Tables Figures
◭ ◮
◭ ◮
Back Close
Full Screen / Esc
Printer-friendly Version
Interactive Discussion
Discussion
P
a
per
|
Dis
cussion
P
a
per
|
Discussion
P
a
per
|
Discussio
n
P
a
per
|
1
2
3
4
5
6
7
8
9
Ma
ss
S
pe
c
tr
om
et
er
circulating water pump
He
reactor
sliding injector
ATD coating reaction zone
6 UV lamps
CH3OH/O2
H2O2/He
microwave discharge Cl2/He
F2/He
H2O/He Br2/NO
ACPD
13, 8873–8900, 2013Uptake of HO2
radicals on Arizona test dust surface
Y. Bedjanian et al.
Title Page
Abstract Introduction
Conclusions References
Tables Figures
◭ ◮
◭ ◮
Back Close
Full Screen / Esc
Printer-friendly Version
Interactive Discussion
Discussion
P
a
per
|
Dis
cussion
P
a
per
|
Discussion
P
a
per
|
Discussio
n
P
a
per
|
0 10 20 30 40 50 60 70 80 90
exposure time (min)
0.4 0.6 0.8 1.0 1.2
[H
O2
]/
[H
O2 ]0
sample in UV on UV off sample out
1
Fig. 2. Typical uptake profile of HO2 on ATD surface: T =300 K, P =1 Torr, dry conditions
ACPD
13, 8873–8900, 2013Uptake of HO2
radicals on Arizona test dust surface
Y. Bedjanian et al.
Title Page
Abstract Introduction
Conclusions References
Tables Figures
◭ ◮
◭ ◮
Back Close
Full Screen / Esc
Printer-friendly Version
Interactive Discussion
Discussion
P
a
per
|
Dis
cussion
P
a
per
|
Discussion
P
a
per
|
Discussio
n
P
a
per
|
0 4 8 12 16
sample length (cm)
0.1 1.0
0.2 0.4 0.6 0.8
[HO
2
]/[H
O2 ]0
1
Fig. 3. Example of kinetics of HO2 consumption in reaction with ATD surface: T = 300 K,
P=1 Torr, dry conditions, [HO2]0=2.0×10¹²molecule cm−3. Circles and squares correspond to the results obtained using F+H2O2 and Cl+CH3OH+O2 systems to produce HO2and with samples of 2.5 and 2.8 mg cm−1
ACPD
13, 8873–8900, 2013Uptake of HO2
radicals on Arizona test dust surface
Y. Bedjanian et al.
Title Page
Abstract Introduction
Conclusions References
Tables Figures
◭ ◮
◭ ◮
Back Close
Full Screen / Esc
Printer-friendly Version
Interactive Discussion
Discussion
P
a
per
|
Dis
cussion
P
a
per
|
Discussion
P
a
per
|
Discussio
n
P
a
per
|
0 0.5 1 1.5 2 2.5
sample mass (mg cm-1) 0
0.02 0.04 0.06 0.08
u
p
ta
ke
co
e
ff
ic
ie
n
t
0 0.02 0.04 0.06 0.08
0 0.01 0.02 0.03
1
Fig. 4.Dependence of the uptake coefficients of HO2(calculated using geometric surface area)
ACPD
13, 8873–8900, 2013Uptake of HO2
radicals on Arizona test dust surface
Y. Bedjanian et al.
Title Page
Abstract Introduction
Conclusions References
Tables Figures
◭ ◮
◭ ◮
Back Close
Full Screen / Esc
Printer-friendly Version
Interactive Discussion
Discussion
P
a
per
|
Dis
cussion
P
a
per
|
Discussion
P
a
per
|
Discussio
n
P
a
per
|
1 2 3
0.5 0.3
[HO2]0(1012molecule cm-3)
0.01 0.10
0.02 0.05 0.20
uptak
e
c
o
effi
c
ient
Source of HO2:
F + H2O2 Cl + CH3OH + O2
1
Fig. 5.Uptake coefficients as function of the initial concentration of HO2:T =300 K, P=1 Torr,
dry conditions, sample mass=(1.2–1.4) mg cm−1
ACPD
13, 8873–8900, 2013Uptake of HO2
radicals on Arizona test dust surface
Y. Bedjanian et al.
Title Page
Abstract Introduction
Conclusions References
Tables Figures
◭ ◮
◭ ◮
Back Close
Full Screen / Esc
Printer-friendly Version
Interactive Discussion
Discussion
P
a
per
|
Dis
cussion
P
a
per
|
Discussion
P
a
per
|
Discussio
n
P
a
per
|
0.01 0.1 1 10 100
relative humidity (%) 0.001
0.01 0.1
up
tak
e
c
o
e
ffi
c
ie
n
t
Source of HO2:
F + H2O2
Cl + CH3OH +O2
1
Fig. 6.Initial uptake coefficients of HO2 on ATD as a function of relative humidity:T =275 K,
P= 1.0–9.0 Torr, [HO2]0≈ 1012 molecule cm−3, sample mass=(1.2–1.5) mg cm−1. The data were obtained with two sources of HO2radicals: reactions F+H2O2(open symbols) and Cl+
ACPD
13, 8873–8900, 2013Uptake of HO2
radicals on Arizona test dust surface
Y. Bedjanian et al.
Title Page
Abstract Introduction
Conclusions References
Tables Figures
◭ ◮
◭ ◮
Back Close
Full Screen / Esc
Printer-friendly Version
Interactive Discussion
Discussion
P
a
per
|
Dis
cussion
P
a
per
|
Discussion
P
a
per
|
Discussio
n
P
a
per
|
270 280 290 300 310 320
temperature (K)
0.01 0.10
0.02 0.05 0.20
uptak
e
c
oe
ffi
c
ie
n
t
Source of HO2:
F + H2O2 Cl + CH3OH + O2
2
Fig. 7.Temperature dependence of the uptake coefficient of HO2on ATD: P=1 Torr,T =275–
![Fig. 2. Typical uptake profile of HO 2 on ATD surface: T = 300 K, P = 1 Torr, dry conditions (RH ≈ 0.02 %), [HO 2 ] 0 = 1.3 × 10 12 molecule cm −3 , sample mass = 0.47 mg cm −1 .](https://thumb-eu.123doks.com/thumbv2/123dok_br/18395986.358109/23.918.98.638.117.490/typical-uptake-profile-surface-torr-conditions-molecule-sample.webp)
![Fig. 3. Example of kinetics of HO 2 consumption in reaction with ATD surface: T = 300 K, P = 1 Torr, dry conditions, [HO 2 ] 0 = 2.0 × 10 12 molecule cm − 3](https://thumb-eu.123doks.com/thumbv2/123dok_br/18395986.358109/24.918.140.564.70.493/example-kinetics-consumption-reaction-surface-torr-conditions-molecule.webp)
![Fig. 4. Dependence of the uptake coe ffi cients of HO 2 (calculated using geometric surface area) on mass of ATD samples (per 1 cm length of the support tube): T = 300 K, P = 1 Torr, dry con-ditions, [HO 2 ] 0 ≈ 10 12 molecule cm −3](https://thumb-eu.123doks.com/thumbv2/123dok_br/18395986.358109/25.918.143.562.73.475/dependence-calculated-geometric-surface-samples-support-ditions-molecule.webp)
![Fig. 6. Initial uptake coe ffi cients of HO 2 on ATD as a function of relative humidity: T = 275 K, P = 1.0–9.0 Torr, [HO 2 ] 0 ≈ 10 12 molecule cm −3 , sample mass = (1.2–1.5) mg cm −1](https://thumb-eu.123doks.com/thumbv2/123dok_br/18395986.358109/27.918.145.562.83.483/initial-uptake-cients-function-relative-humidity-molecule-sample.webp)