Vibrational spectroscopic study of the sulphate mineral glaucocerinite
(Zn,Cu)
10
Al
6
(SO
4
)
3
(OH)
32
18H
2
O – A natural layered double hydroxide
Ray L. Frost
a,⇑, Frederick L. Theiss
a, Andrés López
a, Ricardo Scholz
ba
School of Chemistry, Physics and Mechanical Engineering, Science and Engineering Faculty, Queensland University of Technology, GPO Box 2434, Brisbane, Queensland 4001, Australia
b
Geology Department, School of Mines, Federal University of Ouro Preto, Campus Morro do Cruzeiro, Ouro Preto, MG 35400-00, Brazil
h i g h l i g h t s
We have studied the molecular
structure of the mineral glaucocerinite.
Using a combination of Raman and
infrared spectroscopy.
The mineral is one of the hydrotalcite
supergroup of natural layered double hydroxides.
The observation of multiple bands
provides evidence for the reduction in symmetry of the sulphate anion from
TdtoC2v.
Vibrational spectroscopy enables
aspects of the molecular structure of glaucocerinite to be determined.
g r a p h i c a l
a b s t r a c t
a r t i c l e
i n f o
Article history:
Received 4 November 2013
Received in revised form 2 February 2014 Accepted 19 February 2014
Available online 28 February 2014
Keywords:
Raman spectroscopy Glaucocerinite Sulphate
Infrared spectroscopy
a b s t r a c t
We have studied the molecular structure of the mineral glaucocerinite (Zn,Cu)5Al3(SO4)1.5(OH)169(H2O)
using a combination of Raman and infrared spectroscopy. The mineral is one of the hydrotalcite super-group of natural layered double hydroxides. The Raman spectrum is characterised by an intense Raman band at 982 cm1with a low intensity band at 1083 cm1. These bands are attributed to the sulphate
symmetric and antisymmetric stretching mode. The infrared spectrum is quite broad with a peak at 1020 cm1. A series of Raman bands at 546, 584, 602, 625 and 651 cm1are assigned to the
m4(SO4)2 bending modes. The observation of multiple bands provides evidence for the reduction in symmetry of the sulphate anion fromTdtoC2vor even lower symmetry. The Raman band at 762 cm1is attributed
to a hydroxyl deformation mode associated with AlOH units. Vibrational spectroscopy enables aspects of the molecular structure of glaucocerinite to be determined.
Ó2014 Elsevier B.V. All rights reserved.
Introduction
Studies of anionic clays have been undertaken for a long time
[1–3]. In this work we are undertaking a study of glaucocerinite (Zn,Cu)5Al3(SO4)1.5(OH)169(H2O). Anionic clays, hydrotalcites or
layered double hydroxides (LDH) are less well-known than cationic
clays like smectites[4–6]. The structure of hydrotalcite can be de-rived from a brucite structure (Mg(OH)2) in which e.g. Al3+or Fe3+
(pyroaurite–sjögrenite) substitutes a part of the Mg2+. This
substi-tution creates a positive layer charge on the hydroxide layers, which is compensated by interlayer anions or anionic complexes. In hydrotalcites, a broad range of compositions are possible of the type M2þ
1xM
3þ x ðOHÞ2
h i
An
x=nyH2O, where M
2+ and M3+are
the di- and trivalent cations in the octahedral positions within
http://dx.doi.org/10.1016/j.saa.2014.02.086
1386-1425/Ó2014 Elsevier B.V. All rights reserved.
⇑ Corresponding author. Tel.: +61 7 3138 2407; fax: +61 7 3138 1804.
E-mail address:[email protected](R.L. Frost).
Contents lists available atScienceDirect
Spectrochimica Acta Part A: Molecular and
Biomolecular Spectroscopy
the hydroxide layers withxnormally between 0.17 and 0.33. Anis an exchangeable interlayer anion. Many variations in compositions have been reported for hydrotalcites. In a recent study, Mills et al.
[7]have described the hydrotalcite supergroup as the grouping of several mineral groups: hydrotalcite, quintinite, fougèrite, wood-wardite, glaucocerinite, wermlandite, cualstibite, hydrocalumite as well as unclassified minerals in a total of 43 approved minerals. In previous studies, the former hydrotalcite group minerals were described as members of manasseite groups of minerals composed by hexagonal carbonates and the triclinic carbonates known as the hydrotalcites or double layer hydroxides [8–11]. In the normal course of events, it is essential to determine the X-ray diffraction of the layered double hydroxide or hydrotalcite like compound. In this was the interlayer space may be determined and the struc-ture ascertained. Single crystal XRD is not normally used as the size of the crystals of the layered double hydroxide or hydrotalcite like compound are too small. For this reason vibrational spectroscopy is essential for the determination of the molecular structure of the mineral.
The mineral glaucocerinite (Zn,Cu)5Al3(SO4)1.5(OH)169(H2O) is
a sulphate based mineral[12]and is one of the hydrotalcite super-group of natural layered double hydroxides[7]. According to Raade et al., the structure is hexagonal and is related to a pyroaurite-2H type structure[12]. The mineral is found in acid mine drainage, old mine sites (such as the old lead mines from Laurion, Greece)
[13,14] and polluted waterways[13,15,16]. According to Raade et al. [12], the alleged co-type glaucocerinite from Laurion is related to woodwardite and has the formula [(Zn,Cu)2Al(OH)6]
[(SO4)0.53H2O]. This woodwardite-like mineral has a
cation-or-dered pyroaurite-2H structure with hexagonal cell parameters a= 5.306(2) andc= 26.77(2) Å; its strongest X-ray powder lines occur at 8.9 (1 0 0)(0 0 3), 4.47 (9 0)(0 0 6), 2.55 (6 0)(1 1 3), and 2.28 Å (50)(1 1 6). So-called woodwardite from Caernarvonshire (Wales) is the Cu-analogue of glaucocerinite, whereas an 11 Å min-eral occurring with carrboydite in Western Australia is the Ni-ana-logue. According to Mills et al.[7]glaucocerinite is still an accepted mineral name as is the glaucocerinite group which currently also includes hydrowoodwardite, carrboydite, hydrohonessite, mount-keithite and zincaluminite (though Mills et al. currently lists carrboydite and zincaluminite as questionable species). In the past, glaucocerinite phases have been confused with woodwardite, hydrowoodwardite and zincowoodwardite phases[7]. One reason for undertaking the spectroscopic analysis of glaucocerinite is to see if this mineral may be distinguished from the others above.
Spectroscopic methods are the most direct and powerful means of obtaining experimental information on the electronic structure of materials. Moreover, Raman spectroscopy is considered a powerful tool in order to estimate the degree of structural order– disorder at short-range in different types of the materials. Raman spectroscopy has proven most useful for the study of mineral structure. The objective of this research is to report the Raman and infrared spectra of glaucocerinite and to relate the spectra to the mineral structure.
Experimental
Samples description and preparation
The glaucocerinite sample studied in this work forms part of the collection of the Geology Department of the Federal University of Ouro Preto, Minas Gerais, Brazil, with sample code SAA-197. The sample was gently crushed and the associated minerals were re-moved under a stereomicroscope (Leica MZ4). The glaucocerinite studied in this work occurs as single crystals with prismatic hexag-onal form up to 5 mm. The mineral was identified with X-ray dif-fraction and the unit cell parameters were refined. Scanning
electron microscopy (SEM) in the EDS mode was applied to support the mineral characterisation. In the normal course of events, we would undertake SEM and EDX analysis. In this way the chemical composition of the mineral may be obtained. The mineral glauco-cerinite is quite difficult to handle because of its partial solubility. Thus, these experiments were not undertaken. It was impossible to polish the crystals.
Raman microprobe spectroscopy
Crystals of glaucocerinite were placed on a polished metal sur-face on the stage of an Olympus BHSM microscope, which is equipped with 10x, 20x, and 50xobjectives. The microscope is part of a Renishaw 1000 Raman microscope system, which also includes a monochromator, a filter system and a CCD detector (1024 pixels). The Raman spectra were excited by a Spectra-Physics model 127 He–Ne laser producing highly polarised light at 633 nm and col-lected at a nominal resolution of 2 cm1 and a precision of
±1 cm1in the range between 200 and 4000 cm1. Repeated
acqui-sitions on the crystals using the highest magnification (50x) were accumulated to improve the signal to noise ratio of the spectra. Raman Spectra were calibrated using the 520.5 cm1 line of a
silicon wafer.
Infrared spectroscopy
Infrared spectra were obtained using a Nicolet Nexus 870 FTIR spectrometer with a smart endurance single bounce diamond ATR cell. Spectra over the 4000–525 cm1 range were obtained
by the co-addition of 128 scans with a resolution of 4 cm1and a
mirror velocity of 0.6329 cm/s. Spectra were co-added to improve the signal to noise ratio.
Spectral manipulation such as baseline correction/adjustment and smoothing were performed using the Spectracalc software package GRAMS (Galactic Industries Corporation, NH, USA). Band component analysis was undertaken using the Jandel ‘Peakfit’ soft-ware package that enabled the type of fitting function to be se-lected and allows specific parameters to be fixed or varied accordingly. Band fitting was done using a Lorentzian–Gaussian cross-product function with the minimum number of component bands used for the fitting process. The Gaussian–Lorentzian ratio was maintained at values greater than 0.7 and fitting was under-taken until reproducible results were obtained with squared corre-lations ofr2greater than 0.995.
Results and discussion
Vibrational spectroscopy
Background
The Raman spectroscopy of the aqueous sulphate tetrahedral oxyanion yields the symmetric stretching (
m
1) vibration at 981 cm1, the in-plane bending (m
2) mode at 451 cm1, the
anti-symmetric stretching (
m
3) mode at 1104 cm1and the out-of-plane bending (m
4) mode at 613 cm1[17]. Ross[18,19]reports the inter-pretation of the infrared spectra for potassium alum asm
1, 981 cm1;m
2, 465 cm1;
m
3, 1200, 1105 cm1;m
4, 618 and 600 cm1 [18]. Water stretching modes were reported at 3400and 3000 cm1, bending modes at 1645 cm1, and librational
modes at 930 and 700 cm1[19]. The Raman spectrum of the
min-eral chalcanthite shows a single symmetric stretching mode at 984.7 cm1. Two
m
2 modes are observed at 463 and 445 cm1
and three
m
3modes at 1173, 1146 and 1100 cm1. Them
4mode is observed as a single band at 610 cm1. A complex set of210 136 and 126 cm1. Recently, Raman spectra of four basic
cop-per sulphate minerals, namely antlerite, brochantite, posnjakite and langite, were published [20]. The SO symmetric stretching modes for the four basic copper sulphate minerals are observed at 985, 990, 972 and 974 cm1respectively. Only the mineral
bro-chantite showed a single band in this region. Multiple bands were observed for these minerals in the antisymmetric stretching region.
Ross [18] also lists the infrared spectra of the pseudo-alums formed from one divalent and one trivalent cations. Halotrichite has infrared bands at
m
1, 1000 cm1;m
2, 480 cm1;m
3, 1121, 1085, 1068 cm1;m
4, 645, 600 cm1. Pickeringite the Mg end mem-ber of the halotrichite–pickeringite series has infrared bands atm
1, 1000 cm1;m
2, 435 cm1;
m
3, 1085, 1025 cm1;m
4, 638, 600 cm1 [18]. These minerals display infrared water bands in the OH stretching, 3400 and 3000 cm1 region; OH deformation,1650 cm1region; OH libration, 725 cm1region. Ross also reports
a weak band at960 cm1which is assigned to a second OH
libra-tional vibration[18]. As with the infrared spectra, Raman spectra of alums are based on the combination of the spectra of the sulphate and water. Sulphate typically is a tetrahedral oxyanion with Raman bands at 981 (
m
1), 451 (m
2), 1104 (m
3) and 613 (m
4) cm1[21]. Some sulphates have their symmetry reduced through acting as mono-dentate and bimono-dentate ligands[21]. In the case of bidentate behav-iour both bridging and chelating ligands are known. This reduction in symmetry is observed by the splitting of them
3andm
4into two components under C3v symmetry and 3 components under C2vsymmetry.
Vibrational spectroscopy
The Raman spectrum of glaucocerinite over the complete mea-sured wavenumber range is displayed inFig. 1a. This figure shows the position of the Raman bands and their relative intensities and also provides an indication of the sharpness of these bands. Large parts of the spectrum are noted where little or no intensity is found. Therefore, the spectra are subdivided into sections based upon the differing vibrations being studied. The infrared spectrum of glaucocerinite over the 500–4000 cm1 spectral range is
re-ported inFig. 1b. This figure shows the position and relative inten-sities of the infrared active glaucocerinite bands. The spectra are subdivided into sections as is convenient, based upon the vibra-tions being studied.
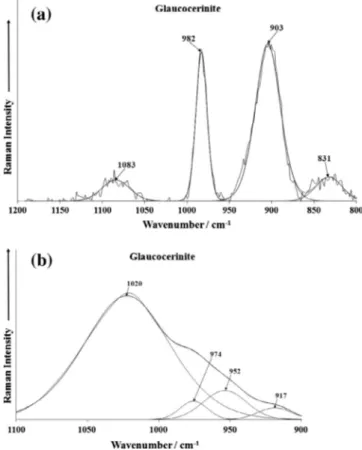
The Raman spectrum of glaucocerinite over the 800–1400 cm1
spectral range is displayed inFig. 2a. This spectral region is the re-gion of the symmetric stretching modes. The spectrum is domi-nated by an intense Raman band at 991 cm1. The position of
this band is in agreement with previously published data [22]. Two low intensity shoulders to this band are observed at 982 and 998 cm1. This band at 999 cm1is assigned to the SO2
4
m
1symmetric stretching mode. In addition, Raman bands are ob-served at 1072 (sharp), 1118 (very broad) and 1206 cm1. These
bands with the exception of the 1072 cm1band may be attributed
to the SO2
4
m
3antisymmetric stretching mode.A comparison of the spectra of glaucocerinite may be made with other sulphate containing minerals. Natural carrboydite is charac-terised by an intense band centred at 980 cm1and is assigned to
the SO2
4 symmetric stretching vibration. A very broad band for
natural carrboydite is observed at around 1125 cm1and this must
be the observation of the Raman bands of the SO2
4 antisymmetric
stretching vibrations. The infrared spectrum of carrboydite shows three bands at 1088, 1021 and 978 cm1. The first two bands are
due to the intense SO2
4 antisymmetric stretching vibrations and
the last band is the weak infrared SO2
4 symmetric stretching
vibra-tion. No carbonate bands at around 1060 cm1was observed in the
Raman spectrum; thus indicating the carrboydite was a pure
Fig. 1.(a) Raman spectrum of glaucocerinite over the 100–4000 cm1spectral
range and (b) infrared spectrum of glaucocerinite over the 500–4000 cm1spectral
range.
Fig. 2.(a) Raman spectrum of glaucocerinite over the 800–1400 cm1spectral
range and (b) infrared spectrum of glaucocerinite over the 500–1300 cm1spectral
sulphate mineral with no carbonate exchange. In contrast, the Ra-man spectrum of both hydrohonessite and reevesite show sharp bands at 1008 cm1. Hydrohonessite Raman spectrum shows two
bands at 1135 and 1115 cm1. The reevesite Raman spectrum
dis-plays two bands at 1135 and 1118 cm1. The infrared spectrum of
hydrohonessite shows two intense bands at 1088 and 1021 cm1.
A very weak band is observed at 978 cm1. In comparison the
bandwidths of the infrared peaks are very broad. The Raman spec-trum of mountkeithite displays two bands at 1129 and 1109 cm1,
assigned to the SO2
4 antisymmetric stretching vibrations.
According to Myneni[23], the SO2
4 polyhedra of the channels in
glaucocerinite are present in three crystallographically different sites and exhibit weakly split S–O antisymmetric stretching vibra-tions at 1136 cm1 (with several components) and symmetric
stretch at 1016, 1008, and 989 cm1. The observation of three
sym-metric stretching bands in this work, fits well with the concept of three different non-equivalent sulphate units in the glaucocerinite structure. These researchers[23]studied the incorporation of arse-nate ions into the glaucocerinite structure and reported the changes in the Raman and infrared spectra during this adsorption. The band at 1072 cm1looks very much like a carbonate stretching
mode. It is possible that the mineral being studied is a solid solu-tion of glaucocerinite. Thus the presence of this latter mineral in the solid solution would give rise to the carbonate bands.
Bish and Livingstone observed for honessite the sulphate
m
1,m
2,m
3andm
4modes at 980, 500, 1140 and 650 cm1, respectively[24]. Them
3mode is clearly split but no separate band positions were gi-ven. The infrared spectrum of synthetic hydrohonessite was very similar to that of the naturally occurring honessite[24]. Although the split of them
3mode is only visible as a weak shoulder on the low wavenumber side of the comparatively broad band in contrast to the (hydro)honessite, where the weaker of the two bands is ob-served as a separate band or shoulder at the higher wavenumber side. The fact that these authors found all four modes to be infrared active indicates that the symmetry of the sulphate anion has been lowered fromTdfor the free anion toC3orC3v, which would resultin activation of the two infrared inactive modes plus splitting of the
m
3mode. Dutta and Puri observed bands associated with the sulphate anion in Li/Al-hydrotalcite in the Raman spectrum around 457, 467, 620 (all three weak), 986 and 1116 cm1(broad). Thesplitting of
m
2and the broadening of the antisymmetric stretching modem
3indicate a significant symmetry lowering. Dutta and Puri [25]suggestedD2which is however not compatible with theinfra-red data where all four bands have been observed[25]. For similar reasonsC3site symmetry as suggested by Bish is not compatible
with the Raman data. Therefore, based on combined observations in both the infrared and Raman spectra the conclusion has to be that the site symmetry is most probablyC2vorCswith
m
1A1 infra-red and Raman active,m
2A1infrared and Raman active,m
2A2only Raman active, andm
3andm
4A1+B1+B2all infrared and Raman ac-tive. The infrared spectrum over the 900–1100 cm1spectral rangeis shown inFig. 2b. Strong infrared bands are observed at 1053, 1078 and 1109 cm1which may be assigned to the SO2
4
m
3anti-symmetric stretching mode. The low intensity infrared band at 986 cm1is attributed to the SO2
4
m
1symmetric stretching mode.The Raman spectra of glaucocerinite over the 300–800 cm1
spectral range and over the 100–300 cm1 spectral range are
shown inFig. 3. A series of Raman bands are observed at 546, 584, 602, 625 and 651 cm1. These bands are assigned to the
m
4
(SO4)2bending modes. Renaudin et al.[22]found a Raman band
at 549 cm1for a synthetic glaucocerinite analogue and attributed
this band to an Al(OH)6 vibration. We found a Raman band at
546 cm1. The observation of multiple bands in this
m
4spectral
re-gion offers evidence for the reduction in symmetry of the sulphate anion fromTdtoC2vor even lower symmetry. The Raman band at
762 cm1is attributed to a hydroxyl deformation mode associated
with AlOH units. It is likely that the infrared bands at 851 and 877 cm1 are also due to this vibrational unit. The Raman band
at 455 cm1with a low wavenumber shoulder at 430 cm1are
as-cribed to the
m
2(SO4)2bending modes. Renaudin et al.[22]found a band at 451 cm1for a synthetic glaucocerinite analogue andas-signed this band to a
m
2sulphate vibration. The band at 359 cm1is attributed to a CaO stretching vibration. In the far low wavenum-ber region a broad spectral feature is observed which may be re-solved into component bands at 115, 180, 211 and 237 cm1.These bands are simply described as lattice vibrations.
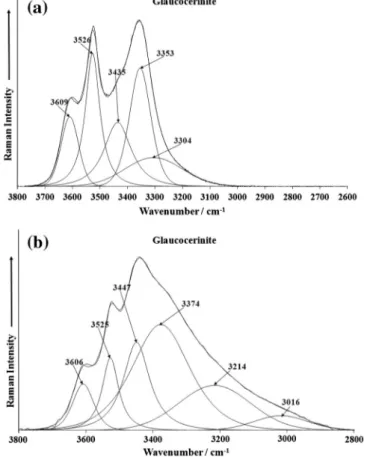
The Raman spectrum of glaucocerinite over the 3000– 3800 cm1 spectral range is illustrated inFig. 4a. The spectrum
shows two features: a band at 3629 cm1and a broad feature at
around 3500 cm1. This latter band may be resolved into
compo-nent bands at 3260, 3386 and 3487 cm1. The first band at
3629 cm1 is assigned to the OH stretching vibration of the OH
units. The broad feature is attributed to water stretching vibra-tions. Renaudin et al. observed the OH stretching vibration at 3638 cm1. These researchers found the water band at
3440 cm1and found the band was very broad. The infrared
spec-trum of glaucocerinite over the 2600–3800 cm1spectral range is
shown inFig. 4b. The spectral profile of the infrared spectrum resembles the Raman spectrum in this spectral region. An infrared band is found at 3626 cm1assigned to the OH stretching vibration
of the OH units. The broad band centred upon 3398 cm1 is
assigned to water stretching vibration. The broad band may be resolved into component bands at 3116, 3241 and 3398 cm1.
The infrared spectrum of glaucocerinite over the 1300– 1800 cm1 spectral range is shown inFig. 5. It should be noted
no intensity was found over this spectral range in the Raman spectrum. Two infrared bands are found at 1636 and 1676 cm1
Fig. 3.(a) Raman spectrum of glaucocerinite over the 300–800 cm1spectral range
and are assigned to water stretching vibrational modes. The band at 1403 cm1may be due to a carbonate impurity. Thus, the
pres-ence of this latter mineral in the solid solution would give rise to the carbonate bands.
Conclusions
The structure of hydrotalcite-2H can be derived from a brucite structure (Mg(OH)2) in which trivalent cations e.g. Al3+ or Fe3+
(pyroaurite-2H) substitutes as part of the Mg2+. This substitution
creates a positive layer charge on the hydroxide layers, which is compensated by interlayer anions or anionic complexes.
Water plays a unique role in the stabilisation of the hydrotal-cite-2H structure. The position and intensity of the Raman bands in the hydroxyl-stretching region indicates that the water is highly structured. The position of the bands in the hydroxyl deformation region of the infrared spectrum supports the concept of structured water between the hydrotalcite layers. Four types of water are identified: (a) water hydrogen bonded to the interlayer carbonate ion, (b) interlamellar water, (c) water hydrogen bonded to the hy-droxyl units and (d) water which bridges the sulphate anion and the M3OH surface. The position of the suite of bands associated
with the sulphate ion indicates the carbonate ion is perturbed and not bonded to the metal centres but is strongly hydrogen bonded to the interlayer water. An intense band at around 559 cm1is observed and it is proposed that this band is due to
the librational mode of water hydrogen bonded to the metal hy-droxyl surface.
In this work, the Raman spectra of the interlayer anions of sul-phate of a natural mineral glaucocerinite have been collected. The splitting of the
m
3,m
4andm
2modes indicates symmetry lowering. The symmetry lowering must be taken into account through the bonding of the sulphate anion to both water and the brucite-like hydroxyl surface. Water plays an essential role in the glaucoceri-nite-2H structure as may be evidenced by the position of the water bending modes. The water is strongly hydrogen bonded to both the anions and the hydroxyl surface. Raman spectroscopy has the advantage that water molecules are not observed as water is a very poor Raman scatterer. Water is however easily measured with infrared spectroscopy. The combination of the two techniques en-ables the bands ascribed to hydroxyl units and to water molecules to be distinguished. Thus the cation OH stretching vibrations are more readily observed with Raman spectroscopy.Acknowledgements
The financial and infra-structure support of the Discipline of Nanotechnology and Molecular Science, Science and Engineering Faculty of the Queensland University of Technology, is gratefully acknowledged. The Australian Research Council (ARC) is thanked for funding the instrumentation. The authors would like to acknowledge the Center of Microscopy at the Universidade Federal de Minas Gerais (<http://www.microscopia.ufmg.br>) for provid-ing the equipment and technical support for experiments involvprovid-ing electron microscopy. R. Scholz thanks to CNPq – Conselho Nacional de Desenvolvimento Científico e Tecnológico (Grant No. 306287/ 2012-9).
References
[1]C. Frondel, Am. Mineral. 26 (1941) 295.
[2]M.C. Van Oosterwyck-Gastuche, G. Brown, M.M. Mortland, Clay Miner. 7 (1967) 177.
[3]C.W. Beck, Am. Mineral. 35 (1950) 985.
[4]J.T. Kloprogge, D. Wharton, L. Hickey, R.L. Frost, Am. Mineral. 87 (2002) 623. [5]R.L. Frost, W.N. Martens, L. Duong, J.T. Kloprogge, J. Mater. Sci. Lett. 21 (2002)
1237.
[6]L. Hickey, J.T. Kloprogge, R.L. Frost, J. Mater. Sci. 35 (2000) 4347.
[7]S.J. Mills, A.G. Christy, J.M.R. Genin, T. Kameda, F. Colombo, Mineral. Mag. 76 (2012) 1289.
[8]A.S. Bookin, V.I. Cherkashin, V.A. Drits, Clays Clay Miner. 41 (1993) 558. [9]V.A. Drits, N.A. Lisitsyna, V.I. Cherkashin, Dokl. Akad. Nauk SSSR 284 (1985)
443.
[10] V.A. Drits, T.N. Sokolova, G.V. Sokolova, V.I. Cherkashin, Izv. Akad. Nauk SSSR, Ser. Geol. (1986) 76.
[11]V.A. Drits, T.N. Sokolova, G.V. Sokolova, V.I. Cherkashin, Clays Clay Miner. 35 (1987) 401.
[12]G. Raade, C.J. Elliott, V.K. Din, Mineral. Mag. 49 (1985) 583.
[13] P. Schreck, T. Witzke, H. Pollmann, Applied mineralogy: in research, economy, technology, ecology and culture, in: Proceedings of the International Congress
Fig. 4.(a) Raman spectrum of glaucocerinite over the 2600–4000 cm1spectral
range and (b) infrared spectrum of glaucocerinite over the 2600–4000 cm1
spectral range.
Fig. 5.Infrared spectrum of glaucocerinite over the 1300–1800 cm1 spectral
on Applied Mineralogy, 6th, vol. 2, no. 2, Goettingen, Germany, July 17–19, 2000, pp. 679.
[14]M. Schubert, R. Wennrich, H. Weiss, P. Schreck, T. Zeller, H.H. Otto, H. Wolfram, Eur. J. Mineral. 17 (2005) 119.
[15] J.J. Kim, Y.H. Kim, S.W. Choi, Y.D. Jang, C.S. Yu, E.S. Woo, Abstracts of Papers, 239th ACS National Meeting, San Francisco, CA, United States, March 21–25, 2010, GEOC, 2010.
[16]E.S. Woo, J.J. Kim, Y.H. Kim, G.C. Jeong, Y.D. Jang, W.A. Dick, Environ. Earth Sci. 69 (2013) 2199.
[17]R.L. Frost, P.A. Williams, W. Martens, J.T. Kloprogge, P. Leverett, J. Raman Spectrosc. 33 (2002) 260.
[18]S.D. Ross, The Infrared Spectra of Minerals, vol. 18, The Mineralogical Society London, 1974.
[19]S.D. Ross, Inorganic Infrared and Raman Spectra, European Chemistry Series, 1972.
[20]W. Martens, R.L. Frost, J.T. Kloprogge, P.A. Williams, J. Raman Spectrosc. 34 (2003) 145.
[21]R.L. Frost, J.T. Kloprogge, P.A. Williams, P. Leverett, J. Raman Spectrosc. 31 (2000) 1083.
[22]G. Renaudin, R. Segni, D. Mentel, J.-M. Nedelec, F. Leroux, C. Taviot-Gueho, J. Adv. Concr. Technol. 5 (2007) 299.
[23]S.C.B. Myneni, S.J. Traina, G.A. Waychunas, T.J. Logan, Geochim. Cosmochim. Acta 62 (1998) 3499.