© Author(s) 2011. CC Attribution 3.0 License.
Thermal adaptation of net ecosystem exchange
W. Yuan1,2, Y. Luo2, S. Liang1,3, G. Yu4, S. Niu5,2, P. Stoy6, J. Chen7, A. R. Desai8, A. Lindroth9, C. M. Gough10, R. Ceulemans11, A. Arain12, C. Bernhofer13, B. Cook14, D. R. Cook15, D. Dragoni16, B. Gielen11, I. A. Janssens11, B. Longdoz17, H. Liu18, M. Lund19, G. Matteucci20, E. Moors21, R. L. Scott22, G. Seufert23, and R. Varner24
1College of Global Change and Earth System Science, Beijing Normal University, Beijing 100875, China 2Department of Botany and Microbiology, University of Oklahoma, Norman, OK 73019, USA
3Department of Geography, University of Maryland, College Park, MD 20742, USA
4Key Laboratory of Ecosystem Network Observation and Modeling, Synthesis Research Center of Chinese Ecosystem Research Network, Institute of Geographic Sciences and Natural Resources Research, Chinese Academy of Sciences, Beijing 100101, China
5State Key Laboratory of Vegetation and Environmental Change, Institute of Botany, Chinese Academy of Sciences, Xiangshan, Beijing 100093, China
6Department of Land Resources and Environmental Sciences, Montana State University, Bozeman, MT 59717-3120, USA 7Department of Environmental Sciences, University of Toledo, Toledo, OH 43606-3390, USA
8Atmospheric and Oceanic Sciences Department, University of Wisconsin – Madison, Madison, WI 53706, USA 9Department of Physical Geography and Ecosystem Analysis, Lund University, Sölvegatan 12, 223 62, Sweden 10Department of Biology, Virginia Commonwealth University, Richmond, VA 23284-2012, USA
11Department of Biology, University of Antwerp, Universiteitsplein 1, 2610 Wilrijk, Belgium
12School of Geography and Earth Sciences, and McMaster Centre for Climate Change, McMaster University, 1280 Main Street West, Hamilton, ON, L8S 4K1, Canada
13Institute of Hydrology and Meteorology, Technische Universität Dresden, 01737 Tharandt, Germany 14Biospheric Science, NASA Goddard Space Flight Center, Greenbelt, MD 20771, USA
15Climate Research Section, Environmental Science Division, Argonne Nat. Lab., Lemont, IL 60439, USA 16Atmospheric Science Program, Geography Department, Indiana University, Bloomington, IN 47405-7100, USA 17INRA, UMR1137 Ecologie et Ecophysiologie Forestière, Centre de Nancy, 54280 Champenoux, France
18Laboratory for Atmospheric Research, Department of Civil and Environmental Engineering, Washington State University, Pullman, WA 99164-2910, USA
19Department of Arctic Environment, National Environmental Research Institute, Aarhus University, Frederiksborgvej, 4000 Roskilde, Denmark
20Institute for Agricultural and Forestry Systems in the Mediterranean, Via Cavour, Rende 4-6, 87036, Italy 21ESS-CC, Alterra Wageningen UR, 6700 AA Wageningen, The Netherlands
22Southwest Watershed Research Center, USDA-ARS, Tucson, AZ 85719, USA
23Institute for Environment and Sustainability, Joint Research Centre – European Commission, 21027 Ispra, Italy 24Institute for the Study of Earth, Oceans and Space and Earth Sciences, University of New Hampshire, Durham, NH 03824, USA
Received: 21 December 2010 – Published in Biogeosciences Discuss.: 7 February 2011 Revised: 11 April 2011 – Accepted: 15 April 2011 – Published: 6 June 2011
Abstract. Thermal adaptation of gross primary production
and ecosystem respiration has been well documented over broad thermal gradients. However, no study has examined
Correspondence to:W. Yuan ([email protected])
transition temperature (Tb) at which ecosystem transfer from carbon source to sink and optimal temperature (To) at which carbon uptake is maximized.Tbwas strongly correlated with annual mean air temperature.Towas strongly correlated with mean temperature during the net carbon uptake period across the study ecosystems. Our results imply that the net ecosys-tem exchange of carbon adapts to the ecosys-temperature across the geographical range due to intrinsic connections between veg-etation primary production and ecosystem respiration.
1 Introduction
Temperature is considered the most important extrinsic fac-tor influencing biological systems across the scales from the kinetics of biochemical reactions to ecosystem biogeochemi-cal processes including carbon cycling (Johnson et al., 1974). Both photosynthetic carbon assimilation (i.e. gross primary production, GPP) and ecosystem respiration (Re), the two largest fluxes determining the net ecosystem exchange (NEE) of CO2 in terrestrial ecosystems, are temperature sensitive. A number of studies have shown significant thermal adapta-tions of GPP andRein ecosystems (Luo et al., 2001; Melillo et al., 2002; Galmés et al., 2005; Eliasson et al., 2005; Wright et al., 2006; Angiletta, 2009; Bradford et al., 2009). For ex-ample, Baldocchi et al. (2001) examined a variety of ecosys-tem types and suggested that the ecosys-temperature optimum for ecosystem GPP is a function of mean summer temperature. Plant autotrophic respiration also represents the adaptation to the prevailing ambient temperature by adjustment of enzyme activity and substrate availability (Atkin and Tjoelker, 2003). Thermal adaptation of GPP andRe, however, has mostly been studied individually, with relatively little known about their interaction as a function of temperature, i.e. the thermal responses of NEE. When considering the combined thermal responses of GPP and Re, some studies conducted within individual sites demonstrated thermal adaptation of the net ecosystem exchange of CO2(Luyssaert et al., 2007; Way and Sage, 2008). For example, a high-elevation forest ecosys-tem was found to adapt to low ecosys-temperatures; while high ecosys- tem-peratures in the midsummer constrained photosynthesis and stimulated respiration, causing a greater reduction in carbon sequestration strength (Huxman et al., 2003).
Different functions are used to describe the responses of GPP andRe to temperature among the models for predict-ing ecosystem responses to global change at global or re-gional scales (Running and Coughlan, 1988; Running and Gower, 1991; Potter et al., 1993; Woodward et al., 1995; Foley et al., 1996; Wang et al., 2011). These models tend to represent GPP and Re as separate functions despite re-cent findings that these opposing carbon fluxes are strongly coupled (Ekblad and Hogberg, 2001; Högberg et al., 2001; Bhupinderpal-Singh et al., 2003). Thermal properties of NEE, if consistent across a broad geographic range, may
re-sult in a simple whole-ecosystem understanding of ecosys-tem carbon metabolism (Baldocchi et al., 2005) that will both be useful for modeling studies while stimulating research on how ecosystems respond to and adjust to shifting thermal constraints.
From the standpoint of ecosystem carbon balance regu-lation and prediction, one can define temperature threshold points. We studyTb, the temperature at which NEE changes from carbon source to sink andTothe optimal temperature for carbon uptake. Tb is related to the length of carbon up-take period, which is a primary determinant of annual NEE (Baldocchi et al., 2001; Churkina et al., 2003), andTo corre-sponds with the maximum NEE, which is a signature for the potential carbon sequestration capacity of ecosystem (Falge et al., 2002). Our overarching goal of this study is to inves-tigate the thermal adaptation of ecosystems on NEE by ex-amining the value ofTbandToof ecosystems across a broad geographic range.
2 Data and methods
We used eddy covariance (EC) data from the AmeriFlux (http://public.ornl.gov/ameriflux) and CarbonEuropeIP (http://gaia.agraria.unitus.it/database/carboeuropeip/) con-sortia. We selected the non-crop sites which include at least two years of measurements. Eventually, 72 sites consisting of 380 site-years of data were included in this study to explore the changes of Tb and To, including five major terrestrial biomes: deciduous broadleaf forests (DBF), evergreen needleleaf forests (ENF), mixed forests of deciduous broadleaf and evergreen needleleaf species (MIX), shrublands (SHR) and grasslands (GRS) (Table 1). Supplementary information on the vegetation, climate, and soil of each site is available online.
Half-hourly or hourly averaged global radiation (Rg), pho-tosynthetically active radiation (PAR), air temperature (Ta), and friction velocity (u∗)were used in conjunction with eddy covariance fluxes of CO2(Fc). When available, datasets gap-filled by site investigators were used for this study. For other sites, data filtering and gap-filling were conducted according to the following procedures. An outlier (“spike”) detection technique was applied, and the spikes were removed, follow-ing Papale et al. (2006). Because nighttime CO2flux can be underestimated by eddy covariance measurements under sta-ble conditions (Falge et al., 2002), nighttime data with non-turbulent conditions were removed based on au∗-threshold criterion (site-specific 99 % threshold criterion following Pa-pale et al., 2006, and Reichstein et al., 2005).
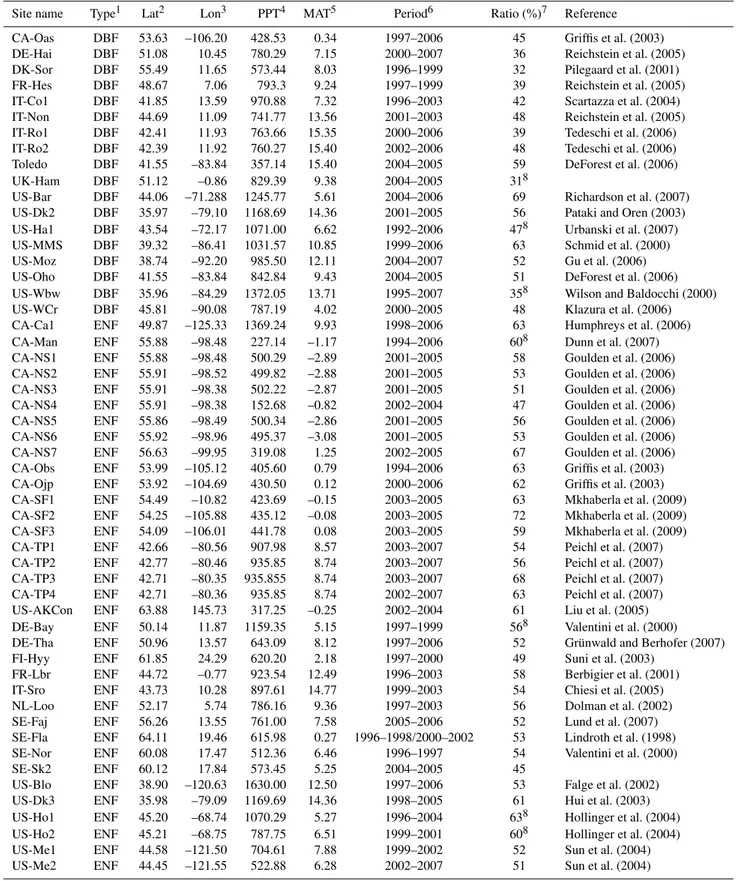
Table 1.The FLUXNET sites used in this study arranged according to ecosystem type.
Site name Type1 Lat2 Lon3 PPT4 MAT5 Period6 Ratio (%)7 Reference CA-Oas DBF 53.63 –106.20 428.53 0.34 1997–2006 45 Griffis et al. (2003) DE-Hai DBF 51.08 10.45 780.29 7.15 2000–2007 36 Reichstein et al. (2005) DK-Sor DBF 55.49 11.65 573.44 8.03 1996–1999 32 Pilegaard et al. (2001) FR-Hes DBF 48.67 7.06 793.3 9.24 1997–1999 39 Reichstein et al. (2005) IT-Co1 DBF 41.85 13.59 970.88 7.32 1996–2003 42 Scartazza et al. (2004) IT-Non DBF 44.69 11.09 741.77 13.56 2001–2003 48 Reichstein et al. (2005) IT-Ro1 DBF 42.41 11.93 763.66 15.35 2000–2006 39 Tedeschi et al. (2006) IT-Ro2 DBF 42.39 11.92 760.27 15.40 2002–2006 48 Tedeschi et al. (2006) Toledo DBF 41.55 –83.84 357.14 15.40 2004–2005 59 DeForest et al. (2006) UK-Ham DBF 51.12 –0.86 829.39 9.38 2004–2005 318
US-Bar DBF 44.06 –71.288 1245.77 5.61 2004–2006 69 Richardson et al. (2007) US-Dk2 DBF 35.97 –79.10 1168.69 14.36 2001–2005 56 Pataki and Oren (2003) US-Ha1 DBF 43.54 –72.17 1071.00 6.62 1992–2006 478 Urbanski et al. (2007) US-MMS DBF 39.32 –86.41 1031.57 10.85 1999–2006 63 Schmid et al. (2000) US-Moz DBF 38.74 –92.20 985.50 12.11 2004–2007 52 Gu et al. (2006) US-Oho DBF 41.55 –83.84 842.84 9.43 2004–2005 51 DeForest et al. (2006) US-Wbw DBF 35.96 –84.29 1372.05 13.71 1995–2007 358 Wilson and Baldocchi (2000) US-WCr DBF 45.81 –90.08 787.19 4.02 2000–2005 48 Klazura et al. (2006) CA-Ca1 ENF 49.87 –125.33 1369.24 9.93 1998–2006 63 Humphreys et al. (2006) CA-Man ENF 55.88 –98.48 227.14 –1.17 1994–2006 608 Dunn et al. (2007) CA-NS1 ENF 55.88 –98.48 500.29 –2.89 2001–2005 58 Goulden et al. (2006) CA-NS2 ENF 55.91 –98.52 499.82 –2.88 2001–2005 53 Goulden et al. (2006) CA-NS3 ENF 55.91 –98.38 502.22 –2.87 2001–2005 51 Goulden et al. (2006) CA-NS4 ENF 55.91 –98.38 152.68 –0.82 2002–2004 47 Goulden et al. (2006) CA-NS5 ENF 55.86 –98.49 500.34 –2.86 2001–2005 56 Goulden et al. (2006) CA-NS6 ENF 55.92 –98.96 495.37 –3.08 2001–2005 53 Goulden et al. (2006) CA-NS7 ENF 56.63 –99.95 319.08 1.25 2002–2005 67 Goulden et al. (2006) CA-Obs ENF 53.99 –105.12 405.60 0.79 1994–2006 63 Griffis et al. (2003) CA-Ojp ENF 53.92 –104.69 430.50 0.12 2000–2006 62 Griffis et al. (2003) CA-SF1 ENF 54.49 –10.82 423.69 –0.15 2003–2005 63 Mkhaberla et al. (2009) CA-SF2 ENF 54.25 –105.88 435.12 –0.08 2003–2005 72 Mkhaberla et al. (2009) CA-SF3 ENF 54.09 –106.01 441.78 0.08 2003–2005 59 Mkhaberla et al. (2009) CA-TP1 ENF 42.66 –80.56 907.98 8.57 2003–2007 54 Peichl et al. (2007) CA-TP2 ENF 42.77 –80.46 935.85 8.74 2003–2007 56 Peichl et al. (2007) CA-TP3 ENF 42.71 –80.35 935.855 8.74 2003–2007 68 Peichl et al. (2007) CA-TP4 ENF 42.71 –80.36 935.85 8.74 2002–2007 63 Peichl et al. (2007) US-AKCon ENF 63.88 145.73 317.25 –0.25 2002–2004 61 Liu et al. (2005) DE-Bay ENF 50.14 11.87 1159.35 5.15 1997–1999 568 Valentini et al. (2000) DE-Tha ENF 50.96 13.57 643.09 8.12 1997–2006 52 Grünwald and Berhofer (2007) FI-Hyy ENF 61.85 24.29 620.20 2.18 1997–2000 49 Suni et al. (2003)
FR-Lbr ENF 44.72 –0.77 923.54 12.49 1996–2003 58 Berbigier et al. (2001) IT-Sro ENF 43.73 10.28 897.61 14.77 1999–2003 54 Chiesi et al. (2005) NL-Loo ENF 52.17 5.74 786.16 9.36 1997–2003 56 Dolman et al. (2002) SE-Faj ENF 56.26 13.55 761.00 7.58 2005–2006 52 Lund et al. (2007) SE-Fla ENF 64.11 19.46 615.98 0.27 1996–1998/2000–2002 53 Lindroth et al. (1998) SE-Nor ENF 60.08 17.47 512.36 6.46 1996–1997 54 Valentini et al. (2000) SE-Sk2 ENF 60.12 17.84 573.45 5.25 2004–2005 45
Table 1.Continued.
Site name Type1 Lat2 Lon3 PPT4 MAT5 Period6 Ratio (%)7
US-Me3 ENF 44.32 –121.61 719.25 7.07 2004–2005 48 Sun et al. (2004)
US-Me4 ENF 44.50 –121.62 1038.82 7.61 1999–2000 53 Sun et al. (2004)
US-NR1 ENF 40.03 –105.55 632.32 2.46 1998–2004 51 Monson et al. (2005)
US-SP1 ENF 29.74 –82.22 1309.77 20.06 2003/2005/2006 46 Kim et al. (2006)
US-SP2 ENF 29.76 –82.24 1314.41 20.07 1999–2004 45 Kim et al. (2006)
US-SP3 ENF 29.75 –82.16 1312.35 20.25 1999–2003 47 Kim et al. (2006)
US-Wrc ENF 45.82 –121.95 2451.96 9.45 1999–2004 52 Cook et al. (2004)
NL-Cal GRS 51.97 4.93 776.67 9.59 2003–2006 458
NL-Haa GRS 52.00 4.81 534.72 4.94 2003–2004 52
NL-Hor GRS 52.03 5.07 779.70 9.50 2004–2006 538
NL-Mol GRS 51.65 4.64 218.48 3.73 2005–2006 548
CA-Let GRS 49.71 –112.94 398.40 5.36 2001–2004 61 Flanagan and Johnson (2005)
US-Wlr GRS 51.52 –96.86 209.31 18.36 2002–2004 63 Song et al. (2005)
US-Wlr GRS 37.52 –96.85 995.70 13.10 2002–2004 52
US-Syv MIX 46.24 –89.35 391.93 5.20 2002–2006 71 Desai et al. (2005)
US-UMB MIX 45.56 –84.71 615.64 7.35 1999–2003 518 Curtis et al. (2005)
BE-Vie MIX 50.30 6.00 821.02 8.31 1996–1998 458 Aubinet et al. (2001)
BE-Bra MIX 51.30 4.52 822.39 11.34 1996–1999 428 Gielen et al. (2010)
US-Los SHR 46.08 –89.98 690.12 4.72 2001–2005 648 Sulman et al. (2009)
1Ecosystem type, DBF: deciduous broadleaf forest; ENF: evergreen needleleaf forest; GRS: grassland; SHR: shrub wetland; MIX: mixed deciduous and evergreen needleleaf forest. 2Positive value indicates north latitude.
3Negative value indicates west longitude, positive value indicates east longitude. 4PPT: mean annual precipitation (mm yr−1).
5MAT: mean annual temperature (◦).
6Available years.
7The percent of measurements that were used in this analysis.
8These sites do not measure the soil moisture, so all measurements are used in these sites.
and Taylor, 1994) equation was used to fill the missing night-time fluxes (Fc,night):
Fc,night=Ae(BTa) (1)
where,AandBare estimated model coefficients, andTais air temperature. A Michaelis-Menten light response equation was used to fill the missing daytime fluxes (Fc,day)(Falge et al., 2001):
Fc,day= α·PAR·FGPP,sat FGPP,sat+α·PAR
−FRE,day (2) whereFGPP,sat(GPP at saturating light) andα(initial slope of the light response function) are empirically-estimated coeffi-cients, andFRE,day(daytimeRe)was estimated by extrapola-tion of Eq. (1) using the daytime air temperature. Daily mete-orological and flux variables values were synthesized based on half-hourly or hourly values, and the daily values were indicated as missing when missing hourly values exceeded 20 % of potential observations during each day.
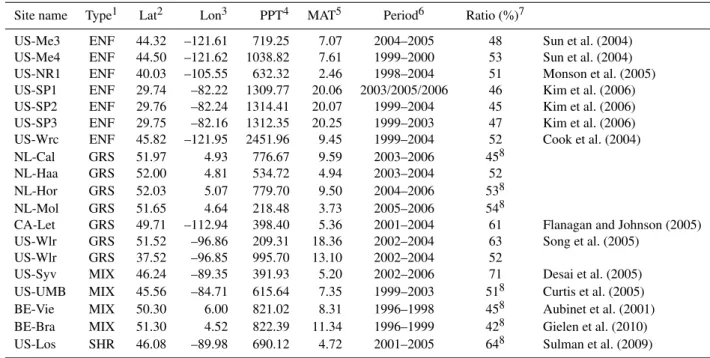
The decreased solar radiation during cloudy days signif-icantly restricts GPP more thanRe, resulting in a reduced NEE. To exclude the influence of clouds on NEE and thus isolate the temperature response, the cloudy days were ex-cluded from our analysis (Fig. 1a). Cloudiness was defined
by using a clearness index (CI), defined as periods when the ratio of the global solar radiation received on the surface to the extraterrestrial solar radiation exceeded 0.5. On average, 35 % of days were removed which were defined as the cloudy days. The amount of cloudy days excluded varied among sites and ranged from 45 % (US-MMS) to 23 % (SE-Nor). Moreover, the effects of drought on NEE during the growing season were accounted for in a simplified way. A water stress index (WSI) was calculated as:
WSI= SW−SWW
SWF−SWW (3)
Fig. 1.Comparison on net ecosystem exchange (NEE) between all
days and sunny days(a)and wet days(b) and selected days
ex-cluding both cloudy and drought days(c)at DE-Tha site. Negative
values on y-axes indicate that carbon is absorbed by the ecosystem, while positive values indicate that that carbon is released by the ecosystem to the atmosphere.
From−30◦to its maximum, temperature categories were set at 1◦increments. Air temperature and NEE for each site were averaged within each increment over the study years in order to examine the changes of NEE with temperature to de-termineTbandTo(Fig. 2). The start and end dates of carbon uptake were identified as the day when daily NEE shifted signs (Falge et al., 2002). To deduce these dates objectively, an 11-day running mean was calculated and the onset date of carbon uptake was determined when consecutive forego-ing days acted as a net carbon source to the atmosphere, and subsequent days represented a net carbon sink.
3 Results
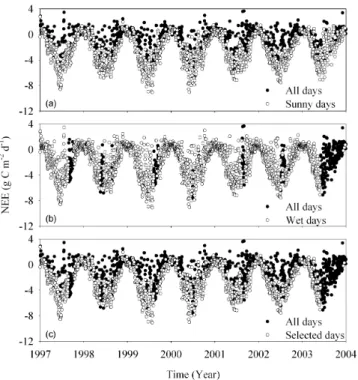
Our analysis shows thatTb andTo decreased significantly with latitude, which co-varies strongly with temperature (data not shown). Tb was strongly correlated with an-nual mean air temperature across a broad geographic range (Fig. 3a). Specifically, Tb under the same thermal condi-tions was higher in deciduous broadleaf forests than in other ecosystem types, though the regression curve ofTbto mean annual temperature in the deciduous broadleaf forests did not show a significant difference among all sites. In con-trast, we observed a significant difference in the regression
Fig. 2. Typical example of response curve of net ecosystem
ex-change (NEE) with temperature at DE-Tha site. Negative values at y-axes indicate that carbon is absorbed by the ecosystem, while positive values indicate that carbon is released by the ecosystem to the atmosphere. The curve of “all days” was derived from all mea-surements without any data filting; the curve of “sunny days” was derived after excluding the cloudy days; the curve of “wet days” was generated based on the measurements excluding the drought days; and the curve of “selected days” was derived from the mea-surements excluding the cloudy and drought days, and which was used to determine theTb(the transition temperature from ecosys-tem carbon source to sink) andTo(the optimal temperature for net carbon uptake).
curves in evergreen needleleaf forests from the overall mean of all sites, with a lowerTbin evergreen needleleaf forests (Fig. 3a).Tofor carbon uptake was strongly correlated with mean air temperatures during the carbon uptake period across the broad spatial scale examined (Fig. 3b).
We compared the temperature curves of NEE among ad-jacent ecosystems to investigate the impacts of stand age on temperature thresholds of NEE. Comparison of seven adja-cent boreal forest sites showed a constantTbandToamong ecosystems comprising stand ages between 30 and 160 yr (Fig. 4). Significantly higherTbandTo were found at 20-and 12-yr st20-ands (i.e. CA-NS6 20-and CA-NS7).
4 Discussion
Fig. 3. The relationship between annual mean air temperature vs.Tb (a)and mean temperature of carbon uptake period vs.To(b) in
deciduous broadleaf forests (DBF), evergreen needleleaf forests (ENF), grasslands (GRS), mixed forests (MIX) and Shurblands (SHR) as well as all ecosystems. Tb: the transition temperature from ecosystem carbon source to sink;To: the optimal temperature for net carbon uptake. In panel(a), the regression lines are:y=1.15x+1.41,R2=0.81,P <0.01 (DBF);y=0.92x+1.57,R2=0.73,P <0.01 (All); y=0.73x+1.59,R2=0.77,P <0.01 (ENF). At(b),y=0.69x+7.02,R2=0.32,P <0.05 (DBF);y=1.02x+1.76,R2=0.64,P <0.01 (All);y=1.09x+1.09,R2=0.71,P <0.01 (ENF).
Fig. 4.Temperature response curves of NEE at seven adjacent
ev-ergreen needleleaf forests in Canada shown at Table 1. Negative values at y-axes indicate that carbon is absorbed by the ecosystem, while positive values indicate that carbon is released by the ecosys-tem to the atmosphere.
sunny days (Price and Black, 1990; Hollinger et al., 1994). Several mechanisms have been postulated to explain such observations. They include increases in diffuse radiation (Price and Black, 1990; Hollinger et al., 1994; Fan et al., 1998), decreases in the respiration of sunlit leaves (Baldoc-chi, 1997), and stomatal dynamics associated with light fluc-tuations (Sakai et al., 1996). Gu et al. (1999) examined the influences of clouds on forest carbon uptake at a boreal as-pen forest and a temperate mixed deciduous forest in Canada, and found that both forests can tolerate exceedingly large re-ductions of solar radiation (CI of 0.53 for the aspen forest and 0.46 for the mixed forest) caused by increases in
cloudi-ness without lowering their capacities of carbon uptake. We examined the threshold of CI when NEE significantly de-creased over other study sites, and found the threshold val-ues were close to 0.5 (data not shown). So, in this study, we excluded the cloudy days when the ratio was less than 0.5. Figure 1a showed the significant decreases of NEE due to lower solar radiation of cloudy days at demonstrated site (i.e. DE-Tha).
It has been well known that NEE is strongly influenced by water availability in terrestrial ecosystems (Meyers, 2001; Granier et al., 2000, 2007). For example, Europe experi-enced a particularly extreme climate anomaly during 2003, with July temperatures up to 6.8◦ above long-term means, and annual precipitation deficits up to 300 mm yr−1, 50 % be-low the average (Ciais et al., 2005). The net ecosystem pro-duction decreased with increasing water stress at almost all of investigated 12 forest sites (Granier et al., 2007). There-fore, it is necessary to characterize temperature curve of NEE using the potential NEE measurements given no water or ra-diation limitation. In this analysis, a simple water stress in-dex was used to quantify the impacts of drought on NEE. The results showed that WSI can effectively ascertain the drought effects (Fig. 1b). At the DE-Tha site, decreased mea-surements of NEE resulted from water stress were excluded, and especially during 2003, more than half of measurements were excluded due to severe drought.
ture periods. The transition temperature points (i.e.Tb and To)differed among the temperature curves under the differ-ent data filting criterion. For example, at the demonstrated site, there are the differences of 5◦ between the curves de-rived from original measurements and measurements exclud-ing cloudy and drought days. Therefore, it is necessary to characterize temperature curve of NEE using the potential NEE measurements given no water or radiation limitation.
It would not otherwise be expected that ecosystem thermal optima track so closely with average temperatures by chance; significant correlations between ecosystem Tb and annual mean air temperature, as well asToand mean temperature during the carbon uptake period, suggests that ecosystem-level thermal adaptation of NEE took place. Previous studies have demonstrated strong thermal adaptation of photosynthe-sis and respiration independently at the ecosystem level (Bal-docchi, 2008), while the scientific investigations on thermal properties of NEE are examined in this study. NEE is the balance between the carbon uptake by photosynthetic car-bon uptake and plant and microbial respiratory losses, sug-gesting that the coupling of two thermally-dependent pro-cesses should be further examined to evaluate the mecha-nisms driving thermal adaptation of ecosystems. The vari-ation of soil respirvari-ation and its temperature sensitivity are both strongly correlated with GPP at diurnal, seasonal and annual scales (Janssens et al., 2001; Tang et al., 2005; Samp-son et al., 2007; Ma et al., 2007). An increasing number of studies show that this complex influence on plant growth rate also determines the microbial processing of carbon in the soil (Christopher and Lal, 2007; Fornara and Tilman, 2008; Cable et al., 2009). Chemical properties that promote high physiological activity and growth in plants and low lignin content also promote rapid decomposition (Hobbie, 1992). The quality of leaf litter, as often measured by litter C:N ra-tio and carbon quality, correlates strongly with correspond-ing plant production parameters in livcorrespond-ing leaves (Aerts and Chapin III., 2000). Furthermore, the quantity of litter in-put provides a second critical link between CO2uptake and decomposition because plant growth governs the quantity of organic matter inputs to decomposers (DeForest et al., 2009). At a given mean annual temperature, Tb of evergreen needleleaf forests is lower than that in deciduous broadleaf forests (Fig. 4). Rapid induction of spring photosynthesis and the low soil respiration compared to assimilation due to low spring temperature, and the evergreen habit of these forests, likely resulted in earlier transition from ecosystem carbon source to uptake in evergreen needleleaf forests (Black et al., 2000; Falge et al., 2002; Welp et al., 2007). Our observa-tion of delayedTbin deciduous broadleaf forests was consis-tent with a previous study by Baldocchi et al. (2005), which showed that net carbon uptake occurs at the period when the mean daily soil temperature equals the mean annual air tem-perature. We found thatTbwas often delayed past the day when soil temperature equaled mean annual air temperature,
nual temperature compared with air temperature in the deciduous broadleaf ecosystems (Table 1).
Site Lat Period1 Avg.2 Std.3
CA-Oas 53.63 1997–2006 5.56 3.35 DE-Hai 51.08 2000–2007 3.64 2.31 IT-Co1 41.85 1996–2003 5.78 1.57 IT-Non 44.69 2001–2003 3.89 2.01 IT-Ro1 42.41 2000–2006 2.65 1.68 IT-Ro2 42.39 2002–2006 3.89 2.36 Toledo 41.55 2004–2005 6.21 3.56 UK-Ham 51.12 2004–2005 5.87 2.37 US-Ha1 43.54 1992–2006 4.61 1.68 US-Moz 38.74 2004–2007 5.26 2.75 US-Oho 41.55 2004–2007 3.10 1.80 US-Bar 44.06 2004–2006 7.33 2.08 US-Wbw 35.96 1995–2004 5.75 3.65 US-WCr 45.81 2000–2005 2.57 2.07 FR-Hes 48.67 1997–1999 4.00 2.65 DK-Sor 55.48 1996–1999 4.67 0.58 US-DK2 35.97 2001–2005 2.20 1.90 US-MMS 39.32 1999–2006 7.20 4.80
1Available years.
2Averaged delayed days when soil temperature equals to the mean annual temperature
compared with air temperature.
3Standard deviation.
with 18 deciduous broadleaf forests showing an average de-lays of 4.67 days (Table 2).
We investigated the impacts of stand age on the ther-mal response of NEE within seven adjacent forest stands comprising a fire chronosequence to ascertain whether cli-mate or stand characteristics were responsible for the tim-ing of Tb and To (Fig. 4). Our results did not show dif-ferences ofTb andTo among 30 to 160 yr-old stands, sug-gesting that the thermal environment may be more impor-tant than successional stage in determining thermal optima. The two youngest sites showed higherTbandTo partly be-cause the vegetation was dominated by deciduous broadleaf seedlings and grasses, which have slightly different tem-perature/thermal optima relationships than evergreen needle-leaf forests (Fig. 3). Previous studies have shown that for-est development following stand-replacing disturbance influ-ences a variety of ecosystem processes including carbon ex-change with the atmosphere (Law et al., 2003). The mag-nitude of NEE differed dramatically among stands of differ-ent ages (Fig. 4a, b, c), suggesting, along with the spatially-distributed results (Fig. 3), that thermal adaptation is inde-pendent of flux magnitude.
al., 1993; Woodward et al., 1995; Foley et al., 1996). How-ever, no study has been conducted to evaluate the accuracy of these independent temperature functions across models. Temperature functions of GPP andRe in these models are often poorly constrained because the thermal adaptation of GPP and Re, and its aggregate flux, NEE, are poorly un-derstood, posing limitations in simulation certainty. In this study, the thermal adaptation of ecosystem on NEE across latitudes suggests the intrinsic physiological connections be-tween thermal responses of GPP andRe, which will be very useful to constrain ecosystem models.
5 Conclusions
Investigating the thermal adaptation of ecosystems on NEE will improve our ability to model regional and global car-bon balance both in the present and in the future. This study adds to an existing empirical basis of thermal adaptation of NEE that we anticipate will form a foundation for mechanis-tic, process-based studies on the response of GPP andRe to temperature. In this study,TbandToshowed significantly de-creasing trends with latitude and adapted to the mean temper-ature during the whole year and growing season separately across 72 study sites with a wide geographic distribution. Thermal response ofTbandToprovides a promising phys-iological rule that can be implemented in regional carbon balance models constraining presently separated temperature functions of GPP andRe.
Acknowledgements. This research was financially supported by
National Key Basic Research and Development Plan of China (2010CB833504), the Fundamental Research Funds for the Central Universities, US National Science Foundation (NSF) under DEB 0444518, and the Terrestrial Carbon Program at the Office of Science, US Department of Energy, Grants No.: DE-FG02-006ER64317. Research at the University of Antwerp was financially supported by the Research Center of Excellence ECO. We acknowledge the work of principal investigators and collaborators in EC sites, who provided the eddy covariance flux measurements.
Edited by: J. Kesselmeier
References
Aerts, R. and Chapin III., F. S. : The mineral nutrition of wild plants revisited: a re-evaluation of processes and patterns, Adv. Ecol. Res., 30, 1–67, 2000.
Angiletta, M. J.: Thermal Adaptation: a Theoretical and Empirical Analysis, Oxford University Press, New York, 2009.
Atkin, O. K. and Tjoelker, M. G.: Thermal acclimation and the dy-namic response of plant respiration to temperature, Trends Plant Sci., 8, 343–351, 2003.
Aubinet, M., Chermanne, B., Vandenhaute, M., Longdoz, B., Yer-naux, M., and Laitat, E.: Long term carbon dioxide exchange
above a mixed forest in the Belgian Ardennes, Agr. Forest Mete-orol., 108, 293–315, 2001.
Baldocchi, D. D: Measuring and modelling carbon dioxide and wa-ter vapour exchange over a temperate broad-leaved forest during the 1995 summer drought, Plant Cell Environ., 20, 1108–1122, 1997.
Baldocchi, D. D.: “Breathing” of the Terrestrial Biosphere: Lessons Learned from a Global Network of Carbon Dioxide Flux Mea-surement Systems, Aust. J. Bot., 56, 1–26, 2008.
Baldocchi, D. D., Falge, Eva., Gu, L., Olson, R., Hollinger, D., Running, S., Anthoni, P., Bernhofer, C., Davis, K., Evans, R., Fuentes, J., Goldstein, A., Katul, G., Law, B., Lee, X., Malhi, Y., Meyers, T., Munger, W., Oechel, W., Paw, K. T., Pilegaard, K., Schmid, H. P., Valentini, R., Verma, S., Vesala, T., Wilson, K., and Wofsy, S.: FLUXNET: a new tool to study the temporal and spatial variability of ecosystem scale carbon dioxide, wa-ter vapor, and energy flux densities, B. Am. Meteorol. Soc., 82, 2415–2434, 2001.
Baldocchi, D. D., Black, T. A., Curtis, P. S., Falge, E., Fuentes, J. D., Granier, A., Gu, L., Knohl, A., Pilegaard, K., Schmid, H. P., Valentini, R., Wilson, K., Wofsy, S., Xu, L., and Yamanoto, S.: Predicting the onset of net carbon uptake by deciduous forests with soil temperature and climate data: a synthesis of FLUXNET data, Int. J. Biometeorol., 49, 377–387, 2005.
Berbigier, P., Bonnefond, J. M., and Mellmann, P.: CO2and water vapour fluxes for 2 years above Euroflux forest site, Agr. Forest Meteorol., 108, 183–197, 2001.
Black, T. A., Chen, W. J., Barr, A. G., Arain, M. A., Chen, Z., Nesic, Z., Hogg, E. H., Neumann, H. H., and Yang, P. C.: Increased carbon sequestration by a boreal deciduous forest in years with a warm spring, Geophys. Res. Lett., 27, 1271–1274, 2000. Bradford, M. A., Watts, B. W., and Davies, C. A.: Thermal
adap-tation of heterotrophic soil respiration in laboratory microcosms, Glob. Change Biol., 16, 1576–1588, 2009.
Cable, J. M., Ogle, K., Tyler, A. P., Pavao-Zuckerman, M. A., and Huxman, T. E.: Woody plant encroachment impacts on soil carbon and microbial processes: results from a hierarchical Bayesian analysis of soil incubation data, Plant Soil, 320, 153– 167, 2009.
Chiesi, M., Maselli, F., Bindi, M., Fibb, L., Cherubini, P., Arlotta E., Tirone, G., Matteucci, G., and Seufert, G.: Modelling carbon budget of Mediterranean forests using ground and remote sens-ing measurements, Agr. Forest Meteorol., 135, 22–34, 2005 Christopher, S. F. and Lal, R.: Nitrogen management affects carbon
sequestration in North American cropland soils, CRC Cr. Rev. Plant Sci., 26, 45–64, 2007.
Churkina, G., Tenhunen, J., Thornton, P. E., Falge, E. M., Elbers, J. A., Erhard, M., Grünwald, T., Kowalski, A. S., Rannik, ü, and Sprinz, D.: Analyzing the ecosystem carbon dynamics of four European coniferous forest using a biogeochemistry model, Ecosystems, 6, 168–184, 2003.
Cook, B. D., Davis, K. J., Wang, W., Desai, A. R., Berger, B. W., Teclaw, R. M., Martin, J. G., Bolstad, P. V., Bakwin, P. S., Yi, C., and Heilman, W.: Carbon exchange and venting anomalies in an upland deciduous forest in northern Wisconsin, USA, Agr. Forest Meteorol., 126, 271–295, 2004.
Curtis, P. S., Vogel, C. S., Gough, C. M., Schmid, H. P., Su, H. B., and Bovard, B. D.: Respiratory carbon losses and the carbon use efficiency of a northern hardwood forest, 1999–2003, New Phytol., 167, 437–456, 2005.
DeForest, J. L., Noormets, A., McNulty, S. G., Sun, G., Teeney, G., and Chen, J.: Phenophases alter the soil respiration-temperature relationship in an oak-dominated forest, Int. J. Biometeorol., 51, 135–144, 2006.
DeForest, J. L., Chen, J., and McNulty, S. G.: Leaf litter is an im-portant mediator of soil respiration in an oak-dominated forest, Int. J. Biometeorol., 53, 127–134, 2009.
Desai, A. R., Bolstad, P. V., Cook, B. D., Davis, K. J., and Carey, E. V.: Comparing net ecosystem exchange of carbon dioxide be-tween an old-growth and mature forest in the upper Midwest, USA, Ecol. Appl., 14, S22–S32, 2005.
Dolman, A. J., Moors, E. J., and Elbers, J. A.: The carbon uptake of a mid latitude pine forest growing on sandy soil, Agr. Forest Meteorol., 111, 157–170, 2002.
Dunn, A. L., Barford, C. C., Wofsy, S. C., Goulden, M. L., and Daube, B. C.: A long-term record of carbon exchange in a boreal black spruce forest: means, responses to interannual variability and decadal trends, Glob. Change Biol., 13, 577–590, 2007. Ekblad, A. and Hogberg, P.: Natural abundance of 13C reveals
speed of link between tree photosynthesis and root respiration, Oecologia, 127, 305–308, 2001.
Eliasson, P. E., McMurtrie, R. E., Pepper, D. A., Strömgren, M., Linder, S., and Ågren, G. I.: The response of heterotrophic CO2 -flux to soil warming, Glob. Change Biol., 11, 167–181, 2005. Falge, E., Tenhunen, J., Baldocchi, D., Aubinet, M., Bakwin, P.,
Berbigier, P., Bernhofer, C., Bonnefound, J. M., Clement, R., Davis, K. J., Elbers, J. A., Falk, M., Goldstein, A. H., Grelle, A., Granier, A., Grünwald, T., Guðmundsson, J., Hollinger, D., Janssens, I. A., Keronen, P., Kowalskim, A. S., Katul, G., Lawo, B. E., Malhi, Y., Meyers, T., Monson, R. K., Moors, E., Mungert, J. W., Oechel, W., Paw, K. T. U., Pilegaard, K., Ran-nikw, Ü., Rebmannx, C., Suyker, A., Thorgeirsson, H., Tirone, G., Turnipseed, A., Wilson, K., and Wofsy, S.: Phase and ampli-tude of ecosystem carbon release and uptake potentials as derived from FLUXNET measurements, Agr. Forest Meteorol., 113, 75– 95, 2002.
Fan, S., Gloor, M., Mahlman, J., Pacala, S., Sarminento, J., Taka-hashi, T., and Tans, P.: A large terrestrial carbon sink in North America implied by atmospheric and oceanic carbon dioxide data and models, Science, 282, 442–446, 1998.
Flanagan, L. B. and Johnson, B. G.: Interacting effects of temper-ature, soil moisture and plant biomass production on ecosystem respiration in a northern temperate grassland, Agr. Forest Mete-orol., 130, 237–253, 2005.
Foley, J. A., Prentice, I. C., Ramankutty, N., Levis, S., Pollard, D., Sitch, S., and Haxeltine, A.: An integrated biosphere model of land surface processes, terrestrial carbon balance, and vegetation dynamics, Global Biogeochem. Cy., 10, 603–628, 1996. Fornara, D. A. and Tilman, D.: Plant functional composition
influ-96, 314–322, 2008.
Galmés, J., Flexas, J., Keys, A. J., Cifre, J., Mitchell, R. A. C., Madgwick, P. J., Haslam, R. P., Medrano, H., and Parry, M. A. J.: Rubisco specificity factor tends to be larger in plant species from drier habitats and in species with persistent leaves, Plant Cell environ., 28, 571–579, 2005.
Gielen, B., Verbeeck, H., Neirynck, J., Sampson, D. A., Vermeiren, F., and Janssens, I. A.: Decadal water balance of a temperate Scots pine forest (Pinus sylvestrisL.) based on measurements
and modelling, Biogeosciences, 7, 1247–1261, doi:10.5194/bg-7-1247-2010, 2010.
Goulden, M. L., Winston, G. C., McMillan, A. M. S., Litvak, M. E., Read, E. L., Rocha, A. V., and Elliot, J. R.: An eddy covariance mesonet to measure the effect of forest age on land-atmosphere exchange, Glob. Change Biol., 12, 2146–2162, 2006.
Granier, A., Bréda, N., and Loustau, D.: A generic model of forest canopy conductance dependent on climate, soil water availability and leaf area index, Ann. For. Sci., 57, 755–765, 2000.
Granier, A., Reichstein, M., and Breda, N.: Evidence for soil water control on carbon and water dynamics in european forests during the extremely dry year: 2003, Agr. Forest Meteorol., 143, 123– 145, 2007.
Griffis, T. J., Black, T. A., Morgenstern, K., Barr, A. G., Nesic, Z., Drewitt, G. B., Gaumont-Guay, G., and McCaughey, J. H.: Eco-physiological controls on the carbon balances of three southern boreal forests, Agr. Forest Meteorol., 117, 53–71, 2003. Grünwald, T. and Berhofer, C.: A decade of carbon, water and
en-ergy flux measurements of an old spruce forest at the Anchor Station Tharandt, Tellus, 59B, 387–396, 2007.
Gu, L. H., Fuentes, J. D., Shugart, H. H., Staebler, R. M., and Black, T. A.: Responses of net ecosystem exchanges of carbon dioxide to changes in cloudiness: Results from two North American de-ciduous forests, J. Geophys. Res., 104, 31421–31434, 1999. Gu, L. H., Baldocchi, D. D., Wofsy, S. C., Munger, J. W.,
Michal-sky, J. J., Urbanski, S. P., and Boden, T. A.: Response of a de-ciduous forest to the Mount Pinatubo eruption: Enhanced photo-synthesis, Science, 299, 2035–2038, 2003.
Gu, L. H., Meyers, T., Pallardy, S. G., Hanson, P. J., Yang, B., Heuer, M., Hosman, K. P., Riggs, J. S., Sluss, D., and Wullschleger, S. D.: Direct and indirect effects of atmospheric conditions and soil moisture on surface energy partitioning re-vealed by a prolonged drought at a temperate forest site, J. Geo-phys. Res., 111, D16102, doi:10.1029/2006JD007161, 2006. Hobbie, S. E.: Effects of plant species on nutrient cycling, Trends
Ecol. Evol., 7, 336–339, 1992.
Högberg, P., Nordgren, A., Buchmann, N., Taylor, A. F. S., Ekblad, A., Högberg, M. N., Nyberg, G., Ottosson-Löfvenius, M., and Read, D. J.: Large-scale forest girdling shows that current pho-tosynthesis drives soil respiration, Nature, 411, 789–792, 2001. Hollinger, D. Y., Kelliher, F. M., Byers, J. N., Hunt, J. E.,
McSev-eny, T. M., and Weir, P. L.: Carbon dioxide exchange between an undisturbed old-growth temperate forest and the atmosphere, Ecology, 75, 134–150, 1994.
Hui, D. F., Luo, Y. Q., and Katul, G.: Partitioning interannual vari-ability in net ecosystem exchange into climatic varivari-ability and functional change, Tree Physiol., 23, 433–442, 2003.
Humphreys, E. R., Black, T. A., Morgenstern, K., Cai, T., Drewitt, G. B., Nesic, Z., and Trofymow, J. A.: Carbon dioxide fluxes in coastal Douglas-fir stands at different stages of development after clearcut harvesting, Agr. Forest Meteorol. 140, 6–22, 2006. Huxman, T. E., Turnipseed, A. A., Sparks, J. P., Harley, P. C., and Monson, R. K.: Temperature as a control over ecosystem CO2 fluxes in a high-elevation, subalpine forest, Oecologia, 134, 537– 546, 2003.
Janssens, I. A., Lankreijer, H., Matteucci, G., Kowalski, A. S., Buchmann, N., Epron, D., Pilegaard, K., Kutsch, W., Long-doz, B., Grünwald, T., Montagnani, L., Dore, S., Rebmann, C., Moors, E. J., Grelle, A., Rannik, Ü., Morgenstern, K., Oltchev, S., Clement, R., Guðmundsson, J., Minerbi, S., Berbigier, P., Ibrom, A., Moncrieff, J., Aubinet, M., Bernhofer, C., Jensen, N. O., Vesala, T., Granier, A., Schulze, E. D, Lindroth, A., Dolman, A. J., Jarvis, P. G., Ceulemans, R., and Valentini, R.: Productiv-ity overshadows temperature in determining soil and ecosystem respiration across European forests, Glob. Change Biol., 7, 269– 278, 2001.
Johnson, F. H., Eyring, H., and Stover, B. J.: The Theory of Rate Processes in Biology and Medicine, John Wiley and Sons, New York, NY, 1974.
Kim, J., Guo, Q., Baldocchi, D. D., Leclerc, M. Y., Xu, L., and Schmid, H. P.: Upscaling fluxes from tower to landscape: over-laying flux footprints on high-resolution (IKONOS) images of vegetation cover, Agr. Forest Meteorol., 136, 132–146, 2006. Klazura, G. E., Cook, D. R., Coulter, R. L., Hart, R. L., Holdridge,
D. J., Lesht, B. M., Lucas, J. D., Martin, T. J., Pekour, M. S., and Wesely, M. L.: Atmospheric Boundary Layer Measurements in South-Central Kansas 1997–2004, B. Am. Meteorol. Soc., 87, 1319–1324, 2006.
Law, B. E., Sun, O., Campbell, J., Van, T. J., and Thornton, P.: Changes in carbon storage and fluxes in a chronosequence of ponderosa pine, Glob. Change Biol., 9, 510–524, 2003. Lindroth, A., Grelle, A., and Morén, A. S.: Long-term
measure-ments of boreal forest carbon balance reveal large temperature sensitivity, Glob. Change Biol., 4, 443–450, 1998.
Liu, H. P., Randerson, J. T., Lindfors, J., and Chapin III., F. S.: Changes in the surface energy budget after fire in boreal ecosys-tems of interior Alaska: an annual perspective, J. Geophys. Res., 110, D13101, doi:10.1029/2004JD005158, 2005.
Lloyd, J. and Taylor, J. A.: On the temperature dependence of soil respiration, Funct. Ecol., 8, 315–323, 1994.
Lund, M., Lindroth, A., Christensen, T. R., and Ström, L.: Annual CO2balance of a temperate bog, Tellus, 59B, 812–825, 2007. Ma, S. Y., Baldocchi, D. D., Xu, L. K., and Hehn, T.: Interannual
variability in carbon exchange of an oak/grass savanna and an annual grassland in California, Agr. Forest Meteorol., 147, 157– 171, 2007.
Melillo, J. M., Steudler, P. A., Aber, J. D., Newkirk, K., Lux, H., Bowles, F. P., Catricala, C., Maglill, A., Ahrens, T., and Morris-seau, S.: Soil warming and carbon-cycle feedbacks to the climate system, Science, 298, 2173–2175, 2002.
Meyers, T. P.: A comparison of summertime water and CO2fluxes over rangeland for well watered and drought conditions, Agr. Forest Meteorol., 106, 205–214, 2001.
Mkhabela, M. S., Amiro, B. D., Barr, A. G., Black, T. A., Hawthorne, I., Kidston, J., McCaughey, J. H., Orchansky, A. L., Nesic, Z., Sass, A., Shashkov A., and Zha, T.: Comparison of carbon dynamics and water use efficiency following fire and har-vesting in Canadian boreal forests, Agr. Forest Meteorol., 149, 783–794, 2009.
Monson, R. K., Sparks, J. P., Rosenstiel, T. N., Scott-Denton, L. E., Huxman, T. E., Harley, P. C., Turnipseed, A. A., Burns, S. P., Backlund, B., and Hu, J.: Climatic influences on net ecosys-tem CO2exchange during the transition from wintertime carbon source to springtime carbon sink in a high-elevation, subalpine forest, Oecologia, 146, 130–147, 2005.
Papale, D., Reichstein, M., Aubinet, M., Canfora, E., Bernhofer, C., Kutsch, W., Longdoz, B., Rambal, S., Valentini, R., Vesala, T., and Yakir, D.: Towards a standardized processing of Net Ecosys-tem Exchange measured with eddy covariance technique: algo-rithms and uncertainty estimation, Biogeosciences, 3, 571–583, doi:10.5194/bg-3-571-2006, 2006.
Pataki, D. E. and Oren, R.: Species differences in stomatal control of water loss at the canopy scale in a mature bottomland decidu-ous forest, Adv. Water Resour., 26, 1267–1278, 2003.
Peichl, M. and Arain, M. A.: Allometry and partitioning of above-and below-ground tree biomass in an age sequence of white pine forests, Forest Ecol. Manag., 253, 68–80, 2007.
Pilegaard, K., Hummelshoj, P., Jensen, N. O., and Chen, Z.: Two years of continuous CO2eddy-flux measurements over a Danish beech forest, Agr. Forest Meteorol., 107, 29–41, 2001.
Potter, C. B., Randerson, J. T., Field, C. B., Matson, P. A., Vitousek, P. M., Mooney, H. A., and Klooster, S. A.: Terrestrial ecosystem production: a process model based on global satellite and surface data, Global Biogeochem. Cy., 7, 811–841, 1993.
Reichstein, M., Falge, E., Baldocchi, D., Papale, D., Aubinet, M., Berbigier, P., Bernhofer, C., Buchmann, N., Gilmanov, T., Granier, A., Grünwald, T., Havránková, K., Ilvesniemi, H., Janous, D., Knohl, A., Laurila, T., Lohila, A., Loustau, D., Mat-teucci, G., Meyers, T., Miglietta, F., Ourcival, J. M., Pumpanen, J., Rambal, S., Rotenberg, E., Sanz, M., Tenhunen, J., Seufert, G., Vaccari, F., Vesala, T., Yakir, D., and Valentini, R.: On the separation of net ecosystem exchange into assimilation and ecosystem respiration: review and improved algorithm, Glob. Change Biol., 11, 1424–1439, 2005.
Richardson, A. D., Hollinger, D. Y., Aber, J. D., Ollinger, S. V., and Braswell, B. H.: Environmental variation is directly responsible for short- but not long-term variation in forest-atmosphere carbon exchange, Glob. Change Biol., 13, 1–16, 2007.
Running, S. W. and Coughlan, J. C.: A general model of forest ecosystem processes for regional applications, I. Hydrologic bal-ance, canopy gas exchange and primary production processes. Ecol. Model., 42, 125–154, 1988.
Running, S. W. and Gower, S. T.: FOREST-BGC, a general model of forest ecosystem processes for regional applications, II. Dy-namic carbon allocation and nitrogen budgets, Tree Physiol., 9, 147–160, 1991.
Sakai, R. K., Fitzjarrald, D. R., Moore, K. E., and Freedman, J. M.: How do forest surface fluxes depend on fluctuating light level?, in: Preprints of 22nd Conference on Agricultural and Forest Me-teorology, Atlanta, Georgia, USA, 28 January–2 February, 90– 93, 1996.
thesis in a mixed temperate forest, Glob. Change Biol., 13, 2008– 2017, 2007.
Scartazza, A., Mata, C., Matteucci, G., Yakir, D., Moscatello, S., and Brugnoli, E.: Comparisons of d13C of photosynthetic prod-ucts and ecosystem respiratory CO2and their responses to sea-sonal climate variability, Oecologia, 140, 340–351, 2004. Schmid, H. P., Grimmond, C. S. B., Cropley, F., Offerle, B., and
Su, H. B.: Measurements of CO2and energy fluxes over a mixed hardwood forest in the mid-western United States, Agr. Forest Meteorol., 103, 357–374, 2000.
Singh, B., Nordgren, A., Löfvenius, M. O., Högberg, M. N., Mel-lander, P. E., and Högberg, P.: Tree root and soil heterotrophic respiration as revealed by girdling of boreal Scots pine forest: extending observations beyond the first year, Plant Cell Environ., 26, 1287–1296, 2003.
Song, J., Liao, K., Coulter, R. L., and Lesht, B. M.: Climatology of the low-level jet at the southern Great Plains atmospheric Bound-ary Layer Experiments site, J. Appl. Meteorol., 44, 1593–1606, 2005.
Sulman, B. N., Desai, A. R., Cook, B. D., Saliendra, N., and Mackay, D. S.: Contrasting carbon dioxide fluxes between a drying shrub wetland in Northern Wisconsin, USA, and nearby forests, Biogeosciences, 6, 1115–1126, doi:10.5194/bg-6-1115-2009, 2009.
Sun, O. J., Campbell, J., Law, B. E., and Wolf, V.: Dynamics of carbon stocks in soils and detritus across chronosequences of dif-ferent forest types in the Pacific Northwest, USA, Glob. Change Biol., 10, 1470–1481, 2004.
Suni, T., Rinne, J., Reissel, A., Altimir, N., Keronen, P., Rannik, Ü., Dal Maso, M., Kulmala, M., and Vesala, T.: Long-term mea-surements of surface fluxes above a Scots pine forest in Hyytiälä, southern Finland, 1996–2001, Boreal Environ. Res., 4, 287–301, 2003.
Tang, J., Baldocchi, D. D., and Xu, L.: Tree photosynthesis modu-lates soil respiration on a diurnal time scale, Glob. Change Biol., 11, 1298–1304, 2005.
Tedeschi, V., Rey, A., Manca, G., Valentini, R., Jarvis, P. G., and Borghetti, M.: Soil respiration in a Mediterranean oak forest at different developmental stages after coppicing, Glob. Change Biol., 12, 110–121, 2006.
ney, J., McKain, K., Fitzjarrald, D., Czikowsky, M., and Munger, J. W.: Factors controlling CO2 exchange on timescales from hourly to decadal at Harvard Forest, J. Geophys. Res.-Biogeo., 112, G02020, doi:10.1029/2006JG000293, 2007.
Valentini, R., Matteucci, G., Dolman, A. J., Schulze, E. D., Reb-mann, C., Moors, E. J., Granier, A., Gross, P., Jensen, N. O., Pile-gaard, K., Lindroth, A., Grelle, A., Bernhofer, C., Grünwald, T., Aubinet, T. M., Ceulemans, R., Kowalski, A. S., Vesala, T., Ran-nik, ü., Berbigier, P., Loustau, D., Guðmundsson, J., Thorgeirs-son, H., Ibrom, A., Morgenstern, K., Clement, R., Moncrieff, J., Montagnani, L., Minerbi, S., and Jarvis, P. G.: Respiration as the main determinant of carbon balance in European forests, Nature, 404, 861–865, 2000.
Wang, W. L., Dungan, J., Hashimoto, H., Michaelis, A. R., Milesi, C. A., Ichii, K., and Nemani, R. R: Diagnosing and assessing un-certainties of terrestrial ecosystem models in a multi-model en-semble experiment: 1. Primary production, Glob. Change Biol., 17, 1350–1366, 2011.
Way, D. A. and Sage, R. F.: Elevated growth temperatures reduce the carbon gain of black spruce [Picea mariana (Mill.) B.S.P], Glob. Change Biol., 14, 624–636, 2008.
Welp, L. R., Randerson, J. T., and Liu, H. P.: The sensitivity of carbon fluxes to spring warming and summer drought depends on plant functional type in boreal forest ecosystems, Agr. Forest Meteorol., 147, 172–185, 2007.
Wilson, K. B. and Baldocchi, D. D.: Seasonal and interannual vari-ability of energy fluxes over a broadleaved temperate decidu-ous forest in North American, Agr. Forest Meteorol., 100, 1–18, 2000.
Woodward, F. I., Smith, T. M., and Emanuel, W. R.: A global land primary productivity and phytogeography model, Global Bio-geochem. Cy., 9, 471–490, 1995.