AMTD
5, 6493–6517, 2012Accurate measurements of CO in humid air using the
CRDS technique
H. Chen et al.
Title Page
Abstract Introduction
Conclusions References
Tables Figures
◭ ◮
◭ ◮
Back Close
Full Screen / Esc
Printer-friendly Version
Interactive Discussion
Discussion
P
a
per
|
Dis
cussion
P
a
per
|
Discussion
P
a
per
|
Discussio
n
P
a
per
|
Atmos. Meas. Tech. Discuss., 5, 6493–6517, 2012 www.atmos-meas-tech-discuss.net/5/6493/2012/ doi:10.5194/amtd-5-6493-2012
© Author(s) 2012. CC Attribution 3.0 License.
Atmospheric Measurement Techniques Discussions
This discussion paper is/has been under review for the journal Atmospheric Measurement Techniques (AMT). Please refer to the corresponding final paper in AMT if available.
Accurate measurements of carbon
monoxide in humid air using the cavity
ring-down spectroscopy (CRDS)
technique
H. Chen1, A. Karion1,2, C. W. Rella3, J. Winderlich4,5, C. Gerbig5, A. Filges5, T. Newberger1,2, C. Sweeney1,2, and P. P. Tans1
1
NOAA Earth System Research Laboratory, Boulder, CO 80305, USA
2
Cooperative Institute for Research in Environmental Sciences, University of Colorado, Boulder, CO, USA
3
Picarro, Inc., Santa Clara, CA, USA
4
Max Planck Institute for Chemistry, Mainz, Germany
5
Max Planck Institute for Biogeochemistry, Jena, Germany
Received: 17 August 2012 – Accepted: 28 August 2012 – Published: 7 September 2012 Correspondence to: H. Chen (huilin.chen@noaa.gov)
AMTD
5, 6493–6517, 2012Accurate measurements of CO in humid air using the
CRDS technique
H. Chen et al.
Title Page
Abstract Introduction
Conclusions References
Tables Figures
◭ ◮
◭ ◮
Back Close
Full Screen / Esc
Printer-friendly Version
Interactive Discussion
Discussion
P
a
per
|
Dis
cussion
P
a
per
|
Discussion
P
a
per
|
Discussio
n
P
a
per
|
Abstract
Accurate measurements of carbon monoxide (CO) in humid air have been made using the cavity ring-down spectroscopy (CRDS) technique. The measurements of CO mole fractions are determined from the strength of its spectral absorption in the near infrared region (∼1.57 µm) after removing interferences from adjacent carbon dioxide (CO2) 5
and water vapor (H2O) absorption lines. Water correction functions that account for
the dilution and pressure-broadening effects as well as absorption line interferences from adjacent CO2 and H2O lines have been derived for CO2mole fractions between
360–390 ppm. The line interference corrections are independent of CO mole fractions. The dependence of the line interference correction on CO2abundance is estimated to
10
be approximately−0.3 ppb/100 ppm CO2for dry mole fractions of CO. Comparisons of
water correction functions from different analyzers of the same type show significant differences, making it necessary to perform instrument-specific water tests for each individual analyzer. The CRDS analyzer was flown on an aircraft in Alaska from April to November in 2011, and the accuracy of the CO measurements by the CRDS analyzer
15
has been validated against discrete NOAA/ESRL flask sample measurements made on board the same aircraft, with a mean difference between integrated in situ and flask measurements of −0.6 ppb and a standard deviation of 2.8 ppb. Preliminary testing
of CRDS instrumentation that employs new spectroscopic analysis (available since the beginning of 2012) indicates a smaller water vapor dependence than the models
20
discussed here, but more work is necessary to fully validate the performance. The CRDS technique provides an accurate and low-maintenance method of monitoring the atmospheric dry mole fractions of CO in humid air streams.
1 Introduction
Atmospheric carbon monoxide (CO) plays an important role in tropospheric chemistry
25
AMTD
5, 6493–6517, 2012Accurate measurements of CO in humid air using the
CRDS technique
H. Chen et al.
Title Page
Abstract Introduction
Conclusions References
Tables Figures
◭ ◮
◭ ◮
Back Close
Full Screen / Esc
Printer-friendly Version
Interactive Discussion
Discussion
P
a
per
|
Dis
cussion
P
a
per
|
Discussion
P
a
per
|
Discussio
n
P
a
per
|
biomass and fossil fuel burning (Andreae and Merlet, 2001; Levin and Karstens, 2007; Ehhalt and Rohrer, 2009; Turnbull et al., 2009). A considerable number of techniques have been employed to perform atmospheric measurements of CO, such as nondisper-sive infrared spectroscopy (NDIR) (Dickerson and Delany, 1988), vacuum ultra-violet resonance fluorescence (VURF) (Gerbig et al., 1999), tunable diode laser absorption
5
spectroscopy (TDLAS) (Sachse et al., 1987), closed path Fourier Transform Infrared (FTIR) absorption (Griffith et al., 2012), gas chromatography combined with a mercuric oxide detector or a flame ionization detector (GC/HgO or GC/FID) (Novelli, 1999), and more recently, quantum cascade laser (QCL) (McManus et al., 2008), integrated cav-ity output spectroscopy (ICOS) (O’Keefe, 1998), and cavcav-ity ring-down spectroscopy
10
(CRDS) (Crosson, 2008).
Comprehensive comparisons of measurements made using these techniques are given by Zellweger et al. (2009, 2012). Because variations of water vapor in the at-mosphere modify the mole fractions of CO (known as the dilution effect), sample air has always been dried in previous techniques to obtain dry air mole fractions. A
ma-15
jor advantage of some recently available techniques (QCL/ICOS/CRDS) is that water vapor mole fractions are simultaneously measured. This makes measurements of CO in humid air feasible as the H2O values can be used to correct for dilution and
po-tential spectroscopic effects. Zellweger et al. (2012) have derived water corrections for the QCL and ICOS analyzers, but not for the CRDS analyzer due to the fact that
20
the more complicated nature of the spectral interference requires more complicated interference testing and analysis procedures. Carbon monoxide is detected by QCL or ICOS in the mid-infrared region where the CO absorption is well separated from other absorption features; in contrast, the CRDS technique measures CO in the near infrared region (∼1.57 µm) where there are significant interferences from adjacent absorption
25
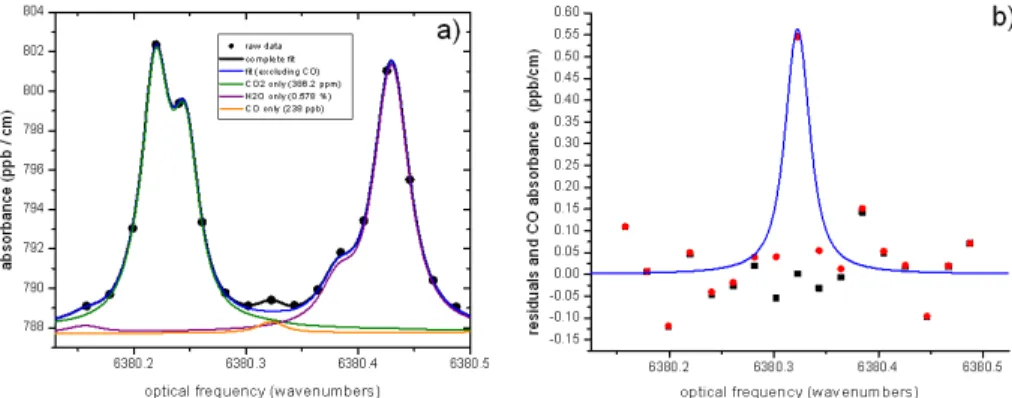
lines of CO2 and H2O at ambient mole fractions of CO, CO2, and H2O. An example of the spectral absorptions for typical ambient mole fractions of CO (238 ppb), CO2
(386.2 ppm), and H2O (0.578 %) is given in Fig. 1a. In the scanned spectral region of
AMTD
5, 6493–6517, 2012Accurate measurements of CO in humid air using the
CRDS technique
H. Chen et al.
Title Page
Abstract Introduction
Conclusions References
Tables Figures
◭ ◮
◭ ◮
Back Close
Full Screen / Esc
Printer-friendly Version
Interactive Discussion
Discussion
P
a
per
|
Dis
cussion
P
a
per
|
Discussion
P
a
per
|
Discussio
n
P
a
per
|
lines. The ratios of the largest line for each species in the scanned spectral region are 1 : 23 : 22 for CO : CO2: H2O. For each raw spectrum (collected every few seconds), the absorption lines of CO, CO2, and H2O are fit using a Levenberg-Marquardt
op-timization algorithm with a Galatry profile for CO (Varghese and Hanson, 1984) and a composite, empirically-derived spectral profile for CO2and H2O. The mole fraction of
5
CO is determined from the peak height of the CO spectral component (see Fig. 1b). Al-though it is challenging to get precise measurements of CO in the near infrared region using the CRDS technique, a big advantage is that this technique employs reliable, cheap, and stable infrared lasers rather than expensive quantum cascade lasers, and the same apparatus can also be employed to measure both CO2 and CH4 precisely. 10
In fact, CRDS analyzers that measure CO2/CH4/CO/H2O or CO2/CO/H2O (Picarro, Inc., Santa Clara, CA, USA, the G2401 or G2302 series) in one unit are commercially available. Extensive efforts have been carried out to make accurate measurements of CO2 and CH4 possible without drying the sample air (Chen et al., 2010; Winderlich et al., 2010; Nara et al., 2012; Rella et al., 2012). It is therefore beneficial to be able to
15
accurately measure CO in humid air with the same analyzer as well.
In this paper, we derive water correction functions for the CO measurements by the CRDS technique to account for the dilution and spectroscopic effects. In Sect. 2, we present the results from a series of laboratory experiments that are then used to derive the water correction functions. The comparison of water correction functions for CO
20
from different CRDS analyzers is given in Sect. 3. The field comparison between in situ and flask measurements on board an aircraft is shown in Sect. 4. In the final section, we present the discussion and conclusion.
2 Water correction functions for CO measurements
Mole fractions of CO and other trace gases are influenced significantly by variations
25
AMTD
5, 6493–6517, 2012Accurate measurements of CO in humid air using the
CRDS technique
H. Chen et al.
Title Page
Abstract Introduction
Conclusions References
Tables Figures
◭ ◮
◭ ◮
Back Close
Full Screen / Esc
Printer-friendly Version
Interactive Discussion
Discussion
P
a
per
|
Dis
cussion
P
a
per
|
Discussion
P
a
per
|
Discussio
n
P
a
per
|
relationship between the CO mole fraction in wet air (COwet) and in dry air (COdry):
COwet/COdry=1−H2O (1)
where H2O is the water vapor mole fraction.
In the case of CO measurements by the CRDS technique, there are a number of factors that complicate the correlation between COwet and COdry: (1) the slope is not 5
equal to−1 if water vapor is not accurately determined; (2) a nonlinear term exists as
a result of pressure broadening (the mole fraction of CO is determined from the peak height of the absorption profile instead of the integrated spectral absorption area which would not be sensitive to pressure broadening); (3) residual line interference remains due to imperfect quantifications of adjacent absorption lines of CO2 and H2O. These 10
effects can be compensated for by the following equation:
(COwet−∆CO)/COdry=
1+a′×H
2Opct+b′×H2Opct 2
(2)
Where COwet is the mole fraction of CO in humid air. For comparability between
dif-ferent analyzers of the same type, we consistently calculate COwet in ppb from the re-ported raw analyzer signal “peak84 raw” or “P84 RAW” as “peak84 raw”×0.427×1000
15
or “p84 RAW”×0.427×1000 (0.427 is the default factory calibration factor). COdry is
the mole fraction of CO in dry air;∆CO is the line interference adjustment to account for the residuals in the line fits of adjacent absorption lines of CO2and H2O, and is a
func-tion of CO2and H2O mole fractions, not of CO mole fraction;a′andb′are coefficients
in the quadratic function to correct for the dilution and pressure-broadening effects and
20
have units of %−1; H2Opct is determined from the detection of the absorption lines of
H2O that are adjacent to the absorption line of CO, and has a unit of %. Since H2Opct
directly affects the CO absorption line, it is appropriate to use measurements of these water vapor lines to correct all water vapor effects for CO measurements.
The CRDS analyzers mentioned above use the same spectroscopic fitting algorithms
25
to derive the mole fractions of CO and CO2, and therefore the dilution and
AMTD
5, 6493–6517, 2012Accurate measurements of CO in humid air using the
CRDS technique
H. Chen et al.
Title Page
Abstract Introduction
Conclusions References
Tables Figures
◭ ◮
◭ ◮
Back Close
Full Screen / Esc
Printer-friendly Version
Interactive Discussion
Discussion
P
a
per
|
Dis
cussion
P
a
per
|
Discussion
P
a
per
|
Discussio
n
P
a
per
|
for these effects are a function of water vapor mole fractions, and are proportional to the mole fractions of CO. On the other hand, the line interferences caused by the residuals in the quantifications of adjacent CO2 and H2O absorption lines are independent of
the mole fractions of CO as they only affect the baseline of the CO absorption. Since the parameters associated with dilution and pressure broadening (a′, andb′) and line 5
interference (∆CO) in Eq. (2) cannot be directly fit using measurements of COwet and
known COdry, we solve for these two effects separately based on water test data from
laboratory experiments.
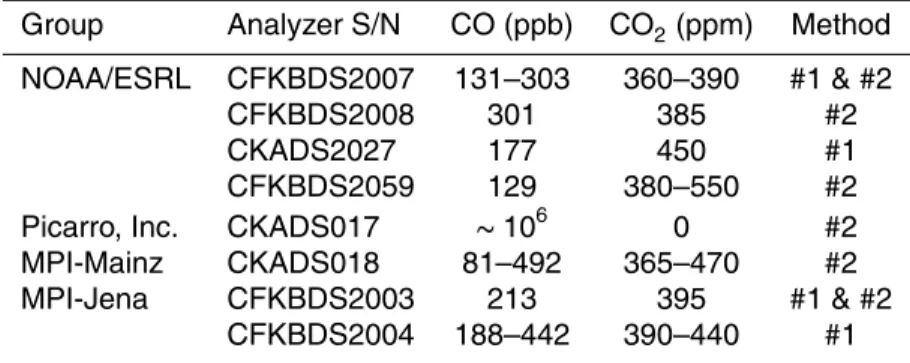
The water test data presented in this paper were obtained based on two different methods described in Rella et al. (2012). Method#1 employs a dew point generator
10
(LI-COR model 610) or a micromodule (http://www.liqui-cel.com/product-information/ micromodule.cfm) to humidify a gas stream from a tank. The advantage of this method is that mole fractions of CO in humidified gas are determined when the system has reached some equilibrium state at each humidity level. Method#2 can be described as a water droplet test. In this method, a small amount (0.2–0.8 ml) of distilled (or
15
deionized) water (can be slightly acidified) is injected into the inlet of the CRDS analyzer to humidify air from a tank. The water droplet added to the inlet line is held at the hydrophobic particulate filter of the analyzer, through which water can only pass in the form of water vapor. This method is easy to perform, and provides water vapor ranging from 0 to 6 %, but the vapor amount changes rapidly. To obtain slowly changing water
20
vapor mole fraction, a small amount of silica gel soaked with deionized or acidified water and housed inside a small flow through chamber has been used at NOAA/ESRL to humidify the gas stream. Water test data from a list of experiments are summarized in Table 1.
2.1 Corrections for dilution and pressure-broadening effects
25
AMTD
5, 6493–6517, 2012Accurate measurements of CO in humid air using the
CRDS technique
H. Chen et al.
Title Page
Abstract Introduction
Conclusions References
Tables Figures
◭ ◮
◭ ◮
Back Close
Full Screen / Esc
Printer-friendly Version
Interactive Discussion
Discussion
P
a
per
|
Dis
cussion
P
a
per
|
Discussion
P
a
per
|
Discussio
n
P
a
per
|
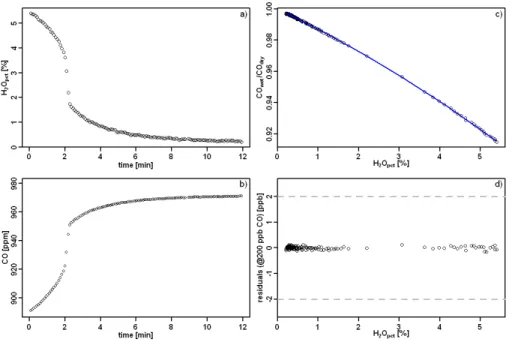
with ambient levels of CO. To minimize the effect of line interferences from CO2 and H2O, a water test was performed at Picarro Inc. in August 2010 on a CO2/CO/H2O
analyzer (S/N: CKADS017) using tank air with an extremely high mole fraction of CO (∼106ppb) and no CO2. The experiment was carried out under a fume hood, using
the simple water droplet test (Method#2, with a heated filter) and water vapor mole
5
fractions ranging from 0 to 6 %. In this case, the line interferences are negligible when compared to the influences by dilution and pressure broadening. The experimental data and analysis results are shown in Fig. 2. Both dilution and pressure-broadening effects can be accounted for using the quadratic function in Eq. 2 (∆CO≈0), and the derived
coefficientsa′
=−1.24×10⁻²%−1, andb′=−6.0×10⁻⁴%−2. These two coefficients are
10
very close to those for CO2a=−1.20×10⁻²%−1,b=−2.67×10⁻⁴%−2(Chen et al.,
2010). The residuals of the quadratic fit applied to 200 ppb dry mole fraction of CO are much smaller than the WMO recommended accuracy of±2 ppb for atmospheric CO
measurements, with a standard deviation of 0.06 ppb (Fig. 2d). Transferring the water correction coefficients for CO2from one CRDS analyzer to another causes uncertainty 15
on the order of 0.1 ppm out of 400 ppm for CO2 (Chen et al., 2010; Rella et al., 2012),
which is at least one order of magnitude more accurate than needed for the transfer-ability of CO water corrections for dilution and pressure broadening among different analyzers (with a goal of 2 ppb out of 200 ppb ambient mole fraction). Therefore, these coefficients can be applied to all CO measurements made by the same type of CRDS
20
analyzer to account for dilution and pressure-broadening effects.
2.2 Corrections for line interferences
An additional correction to the derivation of COdryinvolves the line interferences caused
by the residuals in the quantification of adjacent absorption lines of CO2 and H2O; these are functions of CO2 and H2O mole fractions. To simplify the problem, we de-25
AMTD
5, 6493–6517, 2012Accurate measurements of CO in humid air using the
CRDS technique
H. Chen et al.
Title Page
Abstract Introduction
Conclusions References
Tables Figures
◭ ◮
◭ ◮
Back Close
Full Screen / Esc
Printer-friendly Version
Interactive Discussion
Discussion
P
a
per
|
Dis
cussion
P
a
per
|
Discussion
P
a
per
|
Discussio
n
P
a
per
|
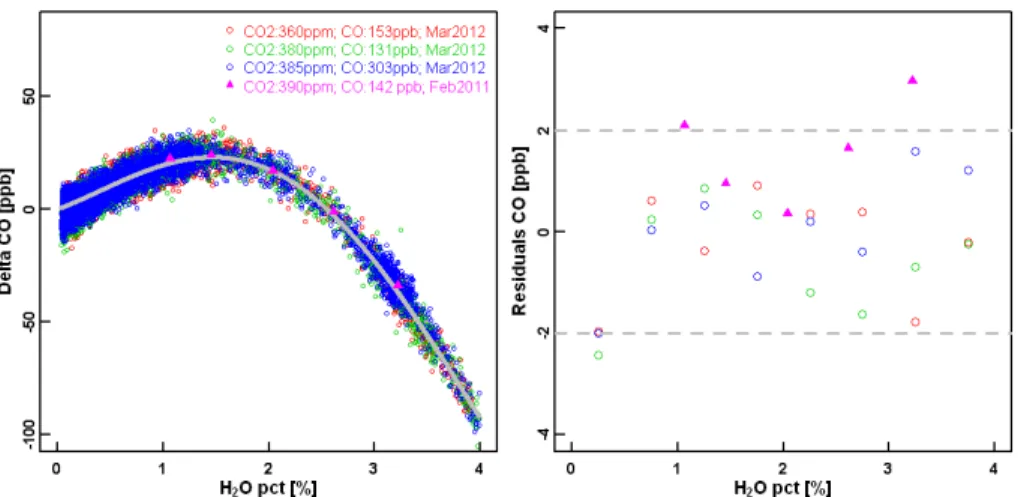
mole fractions, a more complete analysis is required. Five water tests have been per-formed on one CO2/CH4/CO/H2O analyzer (S/N CFKBDS2007) at the laboratory of NOAA ERSL (see Table 1): one was made in February 2011 using a micromodule (Method#1), and four were completed in March 2012 using water droplets with diff er-ent mole fractions of CO2and CO (silica gel soaked with deionized water, Method#2).
5
We fit a fourth-order polynomial function (Eq. 3) to the data from three droplet tests with 360–390 ppm CO2in air using a weighted least squares method, and the weights
in the curve fit were calculated based on the density of the measurements in the water vapor domain so that equal water vapor range contributed equally to the curve fit:
∆CO=A×H2Opct+B×H2Opct2+C×H2Opct3+D×H2Opct4 (3) 10
A, B, C, D are coefficients of the polynomial fit, and ∆CO is calculated as COwet−COdry×(1+a′×H2O+b′×H2O
2
), witha′
=−1.24×10⁻²%−1, andb′=−6.0×
10−4%−2from Sect. 2.1.
The fourth-order function was empirically chosen. We tried to fit these data with a series of polynomial functions from the second order to the fifth order, and found the
15
residuals of those fits below the fourth-order exhibited a clear dependence on water vapor (now shown). Besides this, the standard deviations of the residuals of the fits were 3.3 ppb, 2.3 ppb, 1.1 ppb, and 1.1 ppb, respectively. It is important to note that the coefficientsA–Drepresent the water vapor bias in the CO measurement after the basic spectral model for water vapor has been removed from the raw spectral data.
20
In other words, if the spectral model describing this spectral region was perfect, then these coefficients would be zero. The experimentally derived∆CO and the fourth-order polynomial fit are given in Fig. 3. The February 2011 test was not fit due to the lack of data below 1 % H2O.
The derived coefficients of the weighted fourth-order polynomial fit are
25
A=16.628 %−1,B=12.460 %−2,C=−10.692 %−3, D=1.275 %−4. The ∆CO values
AMTD
5, 6493–6517, 2012Accurate measurements of CO in humid air using the
CRDS technique
H. Chen et al.
Title Page
Abstract Introduction
Conclusions References
Tables Figures
◭ ◮
◭ ◮
Back Close
Full Screen / Esc
Printer-friendly Version
Interactive Discussion
Discussion
P
a
per
|
Dis
cussion
P
a
per
|
Discussion
P
a
per
|
Discussio
n
P
a
per
|
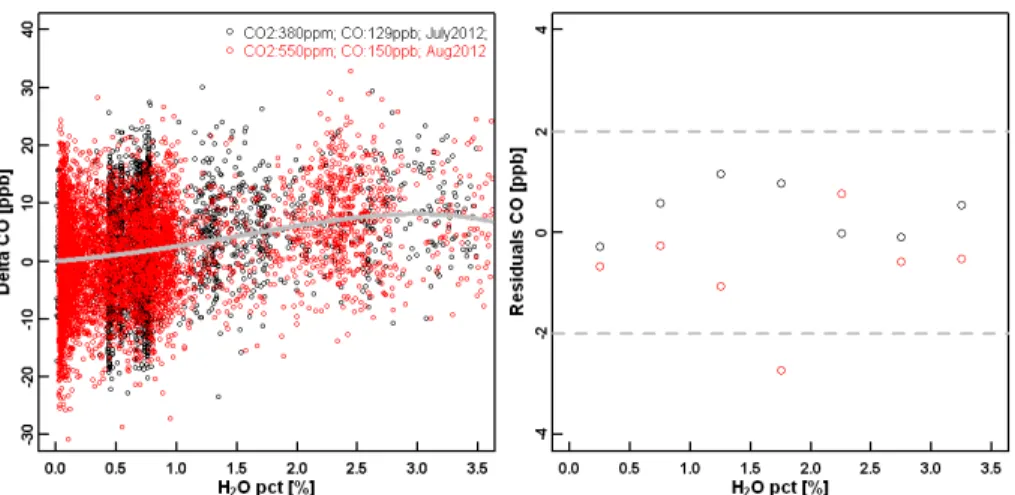
greater than 2 ppb for the four tests with CO2ranging from 360–390 ppm. There is no evidence of drift in the water correction functions from February 2011 to March 2012.
The tests cover CO mole fractions ranging from 131 ppb to 303 ppb, CO2mole
frac-tions ranging from 360 ppm to 390 ppm, and H2O mole fractions ranging from 0 to 4 %. The fact that all these data can be fit to one single function with small residuals
demon-5
strates that this correction applies to different CO mole fractions for the range of CO2
from 360 ppm to 390 ppm. An extensive characterization of the dependence of CO wa-ter corrections on CO2 abundance requires determination of a liner term in CO2 and
a term that is linear in the product of CO2and H2O. We do not have enough test data
to quantify these two terms from the water tests. However, we made a water test using
10
550 ppm CO2for a different CRDS analyzer and did not observe significant differences (see Sect. 2.3, Fig. 4). The dependence of CO measurements in dry air on CO2 is
presented in Sect. 2.4. Note that the size of the third and fourth order terms are large at high water concentrations, and the correction factors can only be used for the tested water vapor range of 0–4 %. Extrapolating the polynomial curve to higher water vapor
15
values will cause a large uncertainty.
2.3 Corrections for line interferences for analyzers with a new fitting algorithm
Since the beginning of 2012, a new line fitting algorithm has been applied by Picarro Inc. to the CO analyzers, which reduces the line interferences from water vapor on the CO measurements. We performed two water droplet tests (Method #2, 380 ppm
20
and 550 ppm CO2) at NOAA/ESRL on a CO2/CH4/CO/H2O analyzer (CFKBDS2059) that uses the new fitting algorithm. The same fourth-order polynomial function was used to fit the data from the water test (see Fig. 4), and the derived coefficients are:
A=2.032 %−1
,B=1.821 %−2
,C=−0.671 %−3,D=0.048 %−4
. Compared to the cor-rections shown in Fig. 3, the magnitude of the correction has been significantly
re-25
AMTD
5, 6493–6517, 2012Accurate measurements of CO in humid air using the
CRDS technique
H. Chen et al.
Title Page
Abstract Introduction
Conclusions References
Tables Figures
◭ ◮
◭ ◮
Back Close
Full Screen / Esc
Printer-friendly Version
Interactive Discussion
Discussion
P
a
per
|
Dis
cussion
P
a
per
|
Discussion
P
a
per
|
Discussio
n
P
a
per
|
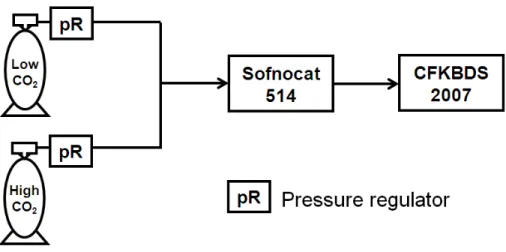
2.4 Dependence of CO measurements on CO2mole fractions
A dependence of CO measurements on CO2 mole fractions is expected due to line
interferences. To characterize the dependence, one experiment was performed on one CO2/CH4/CO/H2O analyzer (S/N CFKBDS2007) at Picarro Inc. in January 2011, and
the apparatus is shown in Fig. 5.
5
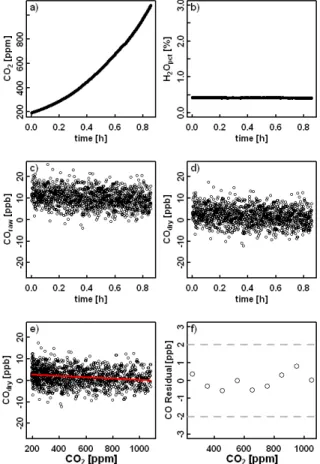
To start with, air from a low CO2 tank was provided to the CRDS analyzer after passing through a CO scrubber (Sofnocat 514), and then switched to air from a high CO2tank. The Sofnocat responds very slowly to changes in CO2 (it was adsorbed on
the sofnocat substrate) so that a slow change in CO2was obtained (Fig. 6a). The water level was about 0.4 %, and was stable throughout the measurement (Fig. 6b). The
10
reading of raw CO was not close to zero due to the presence of water vapor (Fig. 6c). Water corrections were then applied based on Eq. (5) and the coefficients in Sects. 2.1 and 2.2 to derive dry CO, which was indeed around zero (Fig. 6d). From a linear fit of dry CO to CO2, we derive a dependence of CO measurements of −0.3 ppb/100 ppm
CO2, and the 100 ppm bin averaged residuals of the linear fit are smaller than ±1 ppb 15
(Fig. 6e, f).
Alternatively, the CO2 dependence can be derived from measurements of a series
of CO standards with different CO2mole fractions by fitting the following equation:
COtank=A′+B′×COraw+C′×CO2 (4)
Here COtank is the known CO mole fraction, COraw is the measured mole fraction by 20
a CRDS analyzer (“peak84 raw”×0.427×1000), and CO2 is the CO2 mole fraction.
To be able to determine the parameters A′,B′,C′ accurately, a large span of CO 2 is
AMTD
5, 6493–6517, 2012Accurate measurements of CO in humid air using the
CRDS technique
H. Chen et al.
Title Page
Abstract Introduction
Conclusions References
Tables Figures
◭ ◮
◭ ◮
Back Close
Full Screen / Esc
Printer-friendly Version
Interactive Discussion
Discussion
P
a
per
|
Dis
cussion
P
a
per
|
Discussion
P
a
per
|
Discussio
n
P
a
per
|
2.5 Application of corrections for CO measurements
Combining the corrections for dilution and pressure broadening and for line interfer-ences, Eqs. (2)–(3), the corrected CO values can be expressed as
COcorrected=
COwet−(A×H2Opct+B×H2Opct 2
+C×H2Opct 3
+D×H2Opct 4
)
1+a′×H2Opct+b′×H2O pct
2 (5)
The coefficientsa′
=−1.24×10⁻²%−1, andb′=−6.0×10⁻⁴%−2can be used for diff
er-5
ent analyzers, whereas coefficientsA,B,C,Dneed to be determined from instrument-specific water tests (see Sect. 3). Note that we do not include any CO2 dependence in the correction function because it is determined to be small for CO2 mole fractions
ranging from 360–550 ppm.
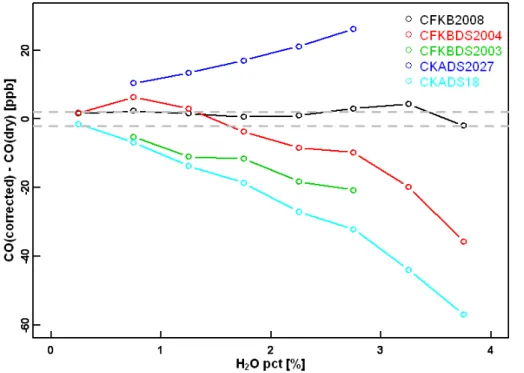
3 Transferability of water corrections across different analyzers
10
When using the water corrections given in Eq. (4), it is important to understand how consistent they are from one instrument to the other. In total, water tests have been performed on five analyzers with the old fitting algorithm in groups from NOAA/ESRL (CFKBDS2008 and CKADS2027), MPI-Jena (CFKBDS2003 and CKADS2004), and MPI-Mainz (CKADS018) using Method#1 and/or Method#2 (see Table 1). The diff
er-15
ences between the corrected CO values based on the coefficients derived in Sects. 2.1 and 2.2 and the measured dry mole fraction of CO for each test and analyzer are shown in Fig. 7. Note that several test results may have been averaged for each individual an-alyzer. The results clearly show that each analyzer requires instrument-specific water corrections (i.e. coefficientsA,B,C,D) to meet the WMO recommended accuracy of
20
±2 ppb. The variations in the CO correction function between analyzers captures the
AMTD
5, 6493–6517, 2012Accurate measurements of CO in humid air using the
CRDS technique
H. Chen et al.
Title Page
Abstract Introduction
Conclusions References
Tables Figures
◭ ◮
◭ ◮
Back Close
Full Screen / Esc
Printer-friendly Version
Interactive Discussion
Discussion
P
a
per
|
Dis
cussion
P
a
per
|
Discussion
P
a
per
|
Discussio
n
P
a
per
|
4 Field validation
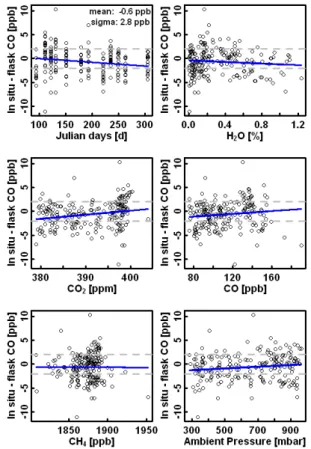
The CRDS analyzer tested in Sect. 2 (CFKBDS2007) was flown without a drying sys-tem on board an aircraft in Alaska from April to November 2011, and from April 2012 until the present. A detailed description of the field deployment is given by Karion et al. (2012). A total of 12 flights have been made in 2011, and each flight took∼8 h,
dur-5
ing which 24 flasks were sampled. In-flight calibrations were made by providing air from three tanks to the CRDS analyzer every 30 min. The flasks were analyzed at NOAA/ESRL, with an accuracy of 2 ppb (Novelli et al., 2003). The in situ CO measure-ments were integrated using weighting functions that accounted for observed atmo-spheric variability during the flask sampling period (Chen et al., 2012). To accurately
10
represent the weighting functions, knowing the times when the pressurizing process started and ended is critical. Since only the times when the pressurizing process ended were recorded, the times when the pressurizing process started were estimated based on the ambient pressure and the time it takes to fill a flask on the ground. The com-parison of integrated in situ measurements with flask measurements of CO during all
15
flights shows a mean bias of−0.6 ppb and a standard deviation of the differences of
2.8 ppb, which is better than the WMO recommended Inter-Laboratory comparability or accuracy of±2 ppb. Further, no significant dependence of the differences between
in situ and flask measurements on any of the variables (day, H2Opct, CO2, CO, CH4, and ambient pressure) has been found, partially due to the relative large scatter in the
20
differences between in situ and flask measurements (Fig. 8).
5 Discussion and conclusion
Accurate measurements of carbon monoxide (CO) in humid air have been made us-ing the cavity rus-ing-down spectroscopy (CRDS) technique. The measurements of CO mole fractions are determined from the strength of its spectral absorption in the near
25
AMTD
5, 6493–6517, 2012Accurate measurements of CO in humid air using the
CRDS technique
H. Chen et al.
Title Page
Abstract Introduction
Conclusions References
Tables Figures
◭ ◮
◭ ◮
Back Close
Full Screen / Esc
Printer-friendly Version
Interactive Discussion
Discussion
P
a
per
|
Dis
cussion
P
a
per
|
Discussion
P
a
per
|
Discussio
n
P
a
per
|
(CO2) and water vapor (H2O) absorption lines. To measure humid ambient air with-out drying the air, laboratory experiments have been carried with-out to derive the water correction functions for CO. These water correction functions account for the dilution and pressure-broadening effects as well as line interferences from adjacent CO2 and H2O absorption lines for CO2 mole fractions ranging from 360–390 ppm, and are in-5
dependent of CO mole fractions. We determined a dependence of CO measurements on CO2 mole fractions of −0.3 ppb/100 ppm CO2. This result quantifies the potential
errors of CO measurements under varying CO2 mole fractions. For measurements of
CO on aircraft or at a background observational site, the dependence seems to be rather small, since variations of CO2larger than 100 ppm CO2 are rarely seen
(corre-10
sponding to a bias of CO±0.3 ppb). For the cases when significant CO2variations are
possible, e.g. exhaust measurements, soil chamber experiments, the dependence of CO measurements on mole fractions of CO2needs to be better characterized.
Unlike the good transferability of the water correction coefficients for CO2 and CH4 among different CRDS analyzers (Rella et al., 2012), comparisons of water
correc-15
tion functions for CO from five different analyzers of the same type show significant differences, making it necessary to perform instrument-specific water tests for each individual analyzer. The magnitude of the water corrections has been significantly re-duced by employing a new fitting algorithm (in Picarro CRDS CO analyzers newer than early 2012). Further tests need to be done to determine if the transferability of the water
20
corrections for analyzers using the new fitting algorithm have been improved. From our limited experience, significant drift has not been observed in the water corrections for one CRDS analyzer (CFKBDS2007) over a period of one year. Based on these labora-tory studies showing the sensitivity of the water correction to CO2mole fraction and the
analyzer to analyzer variability it is recommended that fits be made to each analyzer
25
periodically (3–6 months) with standard gas concentrations that closely resemble both the span of CO2and CO that will be observed.
AMTD
5, 6493–6517, 2012Accurate measurements of CO in humid air using the
CRDS technique
H. Chen et al.
Title Page
Abstract Introduction
Conclusions References
Tables Figures
◭ ◮
◭ ◮
Back Close
Full Screen / Esc
Printer-friendly Version
Interactive Discussion
Discussion
P
a
per
|
Dis
cussion
P
a
per
|
Discussion
P
a
per
|
Discussio
n
P
a
per
|
against discrete NOAA/ESRL flask sample measurements made on board the same aircraft, with a mean difference between integrated in situ and flask measurements of
−0.6 ppb and a standard deviation of 2.8 ppb. No significant dependence of the diff
er-ences between in situ and flask measurements could be detected, partly because the noise in the differences is relative large. Direct comparisons of in situ measurements of
5
CO by two or more side-by-side analyzers, as already investigated by Zellweger et al. (2012), could potentially discover or exclude issues that influence the accuracy of the CO measurements by the CRDS technique.
Although the precision of the CO measurements by the CRDS technique on a short-time period is not as high as other available techniques, such as QCL and ICOS, it is
10
possible to make accurate measurements of CO using this technique without drying the air if measurements over a sufficiently long period can be integrated and calibrated against standards. The CRDS analyzer does not need frequent calibration (Winderlich et al., 2010; Karion et al., 2012; Richardson et al., 2012) or a drying system, and could be an accurate and low-maintenance instrument useful for monitoring the atmospheric
15
mole fractions of CO.
Acknowledgement. We would like to thank Pat Lang, Paul Novelli, Andrew Crotwell, Doug Guenther, Sonja Wolter, Jack Higgs, Duane Kitzis, John Kofler, and Arlyn Andrews at NOAA/ESRL Global Monitoring Division for supporting our work. This work was in part sup-ported by the German Max Planck Society.
20
References
Andreae, M. O. and Merlet, P.: Emission of trace gases and aerosols from biomass burning, Global Biogeochem. Cy., 15, 955–966, doi:10.1029/2000gb001382, 2001.
Chen, H., Winderlich, J., Gerbig, C., Hoefer, A., Rella, C. W., Crosson, E. R., Van Pelt, A. D., Steinbach, J., Kolle, O., Beck, V., Daube, B. C., Gottlieb, E. W., Chow, V. Y., Santoni, G. W., 25
AMTD
5, 6493–6517, 2012Accurate measurements of CO in humid air using the
CRDS technique
H. Chen et al.
Title Page
Abstract Introduction
Conclusions References
Tables Figures
◭ ◮
◭ ◮
Back Close
Full Screen / Esc
Printer-friendly Version
Interactive Discussion
Discussion
P
a
per
|
Dis
cussion
P
a
per
|
Discussion
P
a
per
|
Discussio
n
P
a
per
|
Chen, H., Winderlich, J., Gerbig, C., Katrynski, K., Jordan, A., and Heimann, M.: Validation of routine continuous airborne CO2 observations near the Bialystok Tall Tower, Atmos. Meas. Tech., 5, 873–889, doi:10.5194/amt-5-873-2012, 2012.
Crosson, E. R.: A cavity ring-down analyzer for measuring atmospheric levels of methane, carbon dioxide, and water vapor, Appl. Phys. B, 92, 403–408, 2008.
5
Dickerson, R. R. and Delany, A. C.: Modification of a commercial gas filter correlation CO detector for enhanced sensitivity, J. Atmos. Ocean. Technol., 5, 424–431, 1988.
Ehhalt, D. H. and Rohrer, F.: The tropospheric cycle of H(2): a critical review, Tellus B, 61, 500–535, doi:10.1111/j.1600-0889.2009.00416.x, 2009.
Gerbig, C., Schmitgen, S., Kley, D., Volz-Thomas, A., Dewey, K., and Haaks, D.: An improved 10
fast-response vacuum-UV resonance fluorescence CO instrument, J. Geophys. Res.-Atmos., 104, 1699–1704, 1999.
Griffith, D. W. T., Deutscher, N. M., Caldow, C. G. R., Kettlewell, G., Riggenbach, M., and Ham-mer, S.: A Fourier transform infrared trace gas analyser for atmospheric applications, Atmos. Meas. Tech. Discuss., 5, 3717–3769, doi:10.5194/amtd-5-3717-2012, 2012.
15
Karion, A., Sweeney, C., Wolter, S., Newberger, T., Chen, H., and Tans, P.: Long-term green-house gas measurements from aircraft, Atmos. Meas. Tech. Discuss., accepted, 2012. Levin, I. and Karstens, U.: Inferring high-resolution fossil fuel CO2 records at continental sites
from combined (CO2)-C-14 and CO observations, Tellus B, 59, 245–250, 2007.
Logan, J. A., Prather, M. J., Wofsy, S. C., and McElroy, M. B.: Tropospheric chem-20
istry – a global perspective, J. Geophys. Res.-Oceans Atmos., 86, 7210–7254, doi:10.1029/JC086iC08p07210, 1981.
McManus, J. B., Shorter, J. H., Nelson, D. D., Zahniser, M. S., Glenn, D. E., and McGov-ern, R. M.: Pulsed quantum cascade laser instrument with compact design for rapid, high sensitivity measurements of trace gases in air, Appl. Phys. B, 92, 387–392, 2008.
25
Nara, H., Tanimoto, H., Tohjima, Y., Mukai, H., Nojiri, Y., Katsumata, K., and Rella, C.: Evaluation of factors affecting accurate measurements of atmospheric CO2 and CH4 by wavelength-scanned cavity ring-down spectroscopy, Atmos. Meas. Tech. Discuss., 5, 5009– 5041, doi:10.5194/amtd-5-5009-2012, 2012.
Novelli, P. C.: CO in the atmosphere: measurement techniques and related issues, Chemo-30
AMTD
5, 6493–6517, 2012Accurate measurements of CO in humid air using the
CRDS technique
H. Chen et al.
Title Page
Abstract Introduction
Conclusions References
Tables Figures
◭ ◮
◭ ◮
Back Close
Full Screen / Esc
Printer-friendly Version
Interactive Discussion
Discussion
P
a
per
|
Dis
cussion
P
a
per
|
Discussion
P
a
per
|
Discussio
n
P
a
per
|
Novelli, P. C., Masarie, K. A., Lang, P. M., Hall, B. D., Myers, R. C., and Elkins, J. W.: Reanalysis of tropospheric CO trends: effects of the 1997–1998 wildfires, J. Geophys. Res.-Atmos., 108, 446, doi:10.1029/2002jd003031, 2003.
O’Keefe, A.: Integrated cavity output analysis of ultra-weak absorption, Chem. Phys. Lett., 293, 331–336, doi:10.1016/S0009-2614(98)00785-4, 1998.
5
Rella, C. W., Chen, H., Andrews, A. E., Filges, A., Gerbig, C., Hatakka, J., Karion, A., Miles, N. L., Richardson, S. J., Steinbacher, M., Sweeney, C., Wastine, B., and Zellweger, C.: High accuracy measurements of dry mole fractions of carbon dioxide and methane in humid air, Atmos. Meas. Tech. Discuss., 5, 5823–5888, doi:10.5194/amtd-5-5823-2012, 2012.
Richardson, S. J., Miles, N. L., Davis, K. J., Crosson, E. R., Rella, C. W., and Andrews, A. E.: 10
Field testing of cavity ring-down spectroscopy analyzers measuring carbon dioxide and water vapor, J. Atmos. Ocean. Technol., 29, 397–406, doi:10.1175/jtech-d-11-00063.1, 2012. Sachse, G. W., Hill, G. F., Wade, L. O., and Perry, M. G.: Fast-response, high-precision
carbon-monoxide sensor using a tunable diode-laser absorption technique, J. Geophys. Res.-Atmos., 92, 2071–2081, doi:10.1029/JD092iD02p02071, 1987.
15
Turnbull, J., Rayner, P., Miller, J., Naegler, T., Ciais, P., and Cozic, A.: On the use of (CO2 )-C-14 as a tracer for fossil fuel CO2: quantifying uncertainties using an atmospheric transport model, J. Geophys. Res.-Atmos., 114, D22302, doi:10.1029/2009JD012308, 2009.
Varghese, P. L. and Hanson, R. K.: Collisional narrowing effects on spectral-line shapes mea-sured at high-resolution, Appl. Opt., 23, 2376–2385, 1984.
20
Winderlich, J., Chen, H., Gerbig, C., Seifert, T., Kolle, O., Lavri´c, J. V., Kaiser, C., H ¨ofer, A., and Heimann, M.: Continuous low-maintenance CO2/CH4/H2O measurements at the Zotino Tall Tower Observatory (ZOTTO) in Central Siberia, Atmos. Meas. Tech., 3, 1113–1128, doi:10.5194/amt-3-1113-2010, 2010.
Zellweger, C., H ¨uglin, C., Klausen, J., Steinbacher, M., Vollmer, M., and Buchmann, B.: Inter-25
comparison of four different carbon monoxide measurement techniques and evaluation of the long-term carbon monoxide time series of Jungfraujoch, Atmos. Chem. Phys., 9, 3491–3503, doi:10.5194/acp-9-3491-2009, 2009.
Zellweger, C., Steinbacher, M., and Buchmann, B.: Evaluation of three new laser spectrome-ter techniques for in-situ carbon monoxide measurements, Atmos. Meas. Tech. Discuss., 5, 30
AMTD
5, 6493–6517, 2012Accurate measurements of CO in humid air using the
CRDS technique
H. Chen et al.
Title Page
Abstract Introduction
Conclusions References
Tables Figures
◭ ◮
◭ ◮
Back Close
Full Screen / Esc
Printer-friendly Version
Interactive Discussion
Discussion
P
a
per
|
Dis
cussion
P
a
per
|
Discussion
P
a
per
|
Discussio
n
P
a
per
|
Table 1.Summary of water tests for CO on a series of CRDS analyzers.
Group Analyzer S/N CO (ppb) CO2(ppm) Method NOAA/ESRL CFKBDS2007 131–303 360–390 #1 & #2
CFKBDS2008 301 385 #2
CKADS2027 177 450 #1
CFKBDS2059 129 380–550 #2
Picarro, Inc. CKADS017 ∼106 0 #2
MPI-Mainz CKADS018 81–492 365–470 #2
MPI-Jena CFKBDS2003 213 395 #1 & #2
AMTD
5, 6493–6517, 2012Accurate measurements of CO in humid air using the
CRDS technique
H. Chen et al.
Title Page
Abstract Introduction
Conclusions References
Tables Figures
◭ ◮
◭ ◮
Back Close
Full Screen / Esc
Printer-friendly Version
Interactive Discussion
Discussion
P
a
per
|
Dis
cussion
P
a
per
|
Discussion
P
a
per
|
Discussio
n
P
a
per
|
> CE8E?D
B C?8HE@ C@8ET? G C8?FU
Fig. 7.Differences of corrected wet measurements using the coefficients (A=16.628 %−1
,B= 12.460 %−2
, C=−10.692 %−3, D=1.275 %−4) derived in Sect. 2 for CFKBDS2007 and dry
AMTD
5, 6493–6517, 2012Accurate measurements of CO in humid air using the
CRDS technique
H. Chen et al.
Title Page
Abstract Introduction
Conclusions References
Tables Figures
◭ ◮
◭ ◮
Back Close
Full Screen / Esc
Printer-friendly Version
Interactive Discussion
Discussion
P
a
per
|
Dis
cussion
P
a
per
|
Discussion
P
a
per
|
Discussio
n
P
a
per
|