ACPD
12, 10461–10492, 2012Merging aerosol optical depth data from multiple satellite
missions
Y. Xue et al.
Title Page
Abstract Introduction
Conclusions References
Tables Figures
◭ ◮
◭ ◮
Back Close
Full Screen / Esc
Printer-friendly Version
Interactive Discussion
Discussion
P
a
per
|
Dis
cussion
P
a
per
|
Discussion
P
a
per
|
Discussio
n
P
a
per
|
Atmos. Chem. Phys. Discuss., 12, 10461–10492, 2012 www.atmos-chem-phys-discuss.net/12/10461/2012/ doi:10.5194/acpd-12-10461-2012
© Author(s) 2012. CC Attribution 3.0 License.
Atmospheric Chemistry and Physics Discussions
This discussion paper is/has been under review for the journal Atmospheric Chemistry and Physics (ACP). Please refer to the corresponding final paper in ACP if available.
Merging aerosol optical depth data from
multiple satellite missions to view
agricultural biomass burning in Central
and East China
Y. Xue1,3, H. Xu2,6, L. Mei2,6, J. Guang2, J. Guo4, Y. Li2,6, T. Hou1,6, C. Li1,6, L. Yang5, and X. He2,6
1
Laboratory of Digital Earth Sciences, Center for Earth Observation and Digital Earth, Chinese Academy of Sciences, No. 9 Dengzhuang South Road, Haidian District, Beijing 100094, China
2
State Key Laboratory of Remote Sensing Science, Jointly Sponsored by the Institute of Remote Sensing Applications of the Chinese Academy of Sciences and Beijing Normal University, Institute of Remote Sensing Applications, Chinese Academy of Sciences, Beijing 100101, China
3
Faculty of Computing, London Metropolitan University, 166–220 Holloway Road, London N7 8DB, UK
4
Centre for Atmosphere Watch and Services, Chinese Academy of Meteorological Sciences, China Meteorological Administration, Beijing 100081, China
5
School of Geography, Beijing Normal University, Beijing 100875, China
6
Graduate University of the Chinese Academy of Sciences, Beijing 100049, China
ACPD
12, 10461–10492, 2012Merging aerosol optical depth data from multiple satellite
missions
Y. Xue et al.
Title Page
Abstract Introduction
Conclusions References
Tables Figures
◭ ◮
◭ ◮
Back Close
Full Screen / Esc
Printer-friendly Version
Interactive Discussion
Discussion
P
a
per
|
Dis
cussion
P
a
per
|
Discussion
P
a
per
|
Discussio
n
P
a
per
|
Received: 23 January 2012 – Accepted: 16 April 2012 – Published: 24 April 2012 Correspondence to: Y. Xue ([email protected])
ACPD
12, 10461–10492, 2012Merging aerosol optical depth data from multiple satellite
missions
Y. Xue et al.
Title Page
Abstract Introduction
Conclusions References
Tables Figures
◭ ◮
◭ ◮
Back Close
Full Screen / Esc
Printer-friendly Version
Interactive Discussion
Discussion
P
a
per
|
Dis
cussion
P
a
per
|
Discussion
P
a
per
|
Discussio
n
P
a
per
|
Abstract
Agricultural biomass burning (ABB) in Central and East China occurs every year from May to October and peaks in June. The biomass burning event in June 2007 was very strong. During the period from 26 May to 16 June 2007, ABB occurred mainly in An-hui, Henan, Jiangsu and Shandong provinces. A comprehensive set of aerosol optical
5
depth (AOD) data, produced by a merger of AOD product data from the Moderate Resolution Imaging Spectroradiometer (MODIS) and the Multiangle Imaging Spectro-radiometer (MIRS), is used to study the spatial and temporal distribution of agricultural biomass aerosols in Central and East China combining with ground observations from both AErosol RObotic NETwork (AERONET) and China Aerosol Remote Sensing
NET-10
work (CARSNET) measurements. We compared merged AOD data with single-sensor single-algorithm AOD data (MODIS Dark Target AOD data, MODIS Deep Blue AOD data, SRAP-MODIS AOD data and MISR AOD data). In this comparison, we found merged AOD products can improve the quality of AOD products from single-sensor single-algorithm data sets by expanding the spatial coverage of the study area and
15
keeping the statistical confidence in AOD parameters. There existed high correlation (0.8479) between the merged AOD data and AERONET measurements. Our merged AOD data make use of synergetic information conveyed in all of the available satel-lite data. The merged AOD data were used for the analysis of the biomass burning event from 26 May to 16 June 2007 together with meteorological data. The merged
20
AOD products and the ground observations from China suggest that biomass burning in Central and East China has had great impact on AOD over China. Influenced by this ABB, the highest AOD value in Beijing on 12 June 2007 reached 5.71.
1 Introduction
Agricultural biomass burning (ABB) is a global phenomenon that releases large
quan-25
tities of gases and aerosol particles into the atmosphere, which affect the environment,
ACPD
12, 10461–10492, 2012Merging aerosol optical depth data from multiple satellite
missions
Y. Xue et al.
Title Page
Abstract Introduction
Conclusions References
Tables Figures
◭ ◮
◭ ◮
Back Close
Full Screen / Esc
Printer-friendly Version
Interactive Discussion
Discussion
P
a
per
|
Dis
cussion
P
a
per
|
Discussion
P
a
per
|
Discussio
n
P
a
per
|
ocean water quality, biogeochemical cycles, human health, radiative balance and cli-mate. As a large agricultural country, China leads the world in the yield of straw and crop residues (He et al., 2007). However, rapid economic development has increased the consumption of commercial energy in rural areas of China. As a result, agricultural residues are being used less for heating energy and are being directly burned in fields
5
more regularly, especially in graproducing regions with low population densities, in-dustrially developed regions, and fossil-producing regions (Cao et al., 2006). Aerosol particles from ABB in Central and East China have a significant impact on air quality and climate at local, regional and global scales.
To evaluate the effects of agricultural biomass aerosols on air quality and climate, it
10
is necessary to estimate the aerosols’ spatial and temporal distributions. An important metric in the characterisation of aerosol distribution is the aerosol optical depth (AOD) (Adhikary et al., 2008). Ramanathan et al. (2001) defined that “The AOD is the vertical integral of the aerosol concentration weighted with the effective cross-sectional area of the particles intercepting (by scattering and absorption) the solar radiation at the
15
wavelength of interest”. Because of its spatial and temporal coverage, satellite-based AOD is the most practical measurement of aerosol amount for regional as well as global assessments (Anderson et al., 2005).
In order to appraise the overall influence on environment from biomass burning, the transport of biomass burning discharged main pollutants is an important aspect. Many
20
research works on this aspect have been done. Through studies with a global model simulation (Goddard Institute for Space Studies – GISS GCM BC simulation) and Hy-brid Single-Particle Lagrangian Integrated Trajectory (HYSPLIT) model, Evangelism et al. (2007) showed that the apportionment of about half of the aerosol BC at the South-West Atlantic may derive from South American biomass burning. From Regional
25
ACPD
12, 10461–10492, 2012Merging aerosol optical depth data from multiple satellite
missions
Y. Xue et al.
Title Page
Abstract Introduction
Conclusions References
Tables Figures
◭ ◮
◭ ◮
Back Close
Full Screen / Esc
Printer-friendly Version
Interactive Discussion
Discussion
P
a
per
|
Dis
cussion
P
a
per
|
Discussion
P
a
per
|
Discussio
n
P
a
per
|
Andreae et al. (2001) found 80 %–95 % of the enhanced CO, CO2, acetonitrile, methy chloride, hydrocarbons, NO, O3in atmospheric layers with aged biomass smoke at al-titudes>10 km over Suriname came from biomass burning near the ground. Qin et al. (2006) studied the spatial and temporal distributions of biomass burning activities in Eurasia and the transport character of low tropospheric air over major biomass burning
5
regions during the seasons of strong emission, based on the fire counts from ATSR satellite, forward trajectories and residence time analysis. Ainslie and Jackson (2009) simulated a means of determining air emission source regions adversely influencing the city of Prince George, British Columbia, Canada from potential burning of isolated piles of mountain pine beetle-killed lodge pole pine using the CALPUFF atmospheric
10
dispersion model and presented safe burning regions based on atmospheric stability and wind direction. Choi and Femando (2007) used the CALPUFF modelling system simulating PM10 dispersion from agricultural fires in the Yuma/San Luis area along the US/Mexico border and pointed out that the impacts could have been greater if the for-mation of secondary particles is considered. Jain et al. (2007) described a numerical
15
smoke dispersion forecast system (ClearSky) which utilizes Mesoscale Meteorolog-ical Model version 5 (MM5v3) forecasts from the University of Washington and the Lagrangian CALPUFF dispersion model and pointed out the forecasting result of me-teorological field and the efficiency of fire point monitoring have great influence on the simulation result.
20
As a result of an increasing focus on aerosols in climate studies, numerous satellite sensors and algorithms have been generated to study aerosols. Reliable retrievals of AOD over land were made using the dual view algorithm of the Along-Track Scanning Radiometer-ATSR-2 (Veefkind et al., 1998; Xue et al., 2009), POLarization and Direc-tionality of the Earth’s Reflectance instrument-POLDER (Deuze et al., 2001), Moderate
25
Resolution Imaging Spectroradiometer-MODIS (Kaufman et al., 1997), and Multiangle Imaging Spectroradiometer-MISR (Martonchik et al., 1998); these instruments were designed for aerosol retrievals (Kokhanovsky and de Leeuw, 2009). Additionally, In-formation about the Sea-viewing Wide Field-of-view Sensor (SeaWiFS) and MEdium
ACPD
12, 10461–10492, 2012Merging aerosol optical depth data from multiple satellite
missions
Y. Xue et al.
Title Page
Abstract Introduction
Conclusions References
Tables Figures
◭ ◮
◭ ◮
Back Close
Full Screen / Esc
Printer-friendly Version
Interactive Discussion
Discussion
P
a
per
|
Dis
cussion
P
a
per
|
Discussion
P
a
per
|
Discussio
n
P
a
per
|
Resolution Imaging Spectrometer (MERIS) have been used for this purpose (von Hoyningen-Huene et al., 2003; von Hoyningen-Huene et al., 2006). Currently, satellite-based AOD retrieval techniques are being developed by numerous research teams. A range of algorithms has been designed because the satellite sensors have different temporal, spatial, polarisation, angular and spectral information content characteristics.
5
However, different satellite instruments and algorithms do not always give consistent values of aerosol properties during the ABB period for a given ground scene. These differences occur because the satellites use various viewing angles, spectral chan-nels, spatial and temporal resolutions, and polarisations to gather atmospheric data (Kokhanovsky et al., 2007). Moreover, the application of different simplifying
assump-10
tions and algorithms to the same data source can also result in different estimates of agricultural biomass aerosol properties.
There is an increasing need to produce consistent aerosol products using combi-nations of data sets, taking advantage of the strengths of individual sensors and con-straining the weaknesses of others. Gupta et al. (2008) proposed that combined data
15
sets could provide value-added information that would not be possible from only one sensor and provided a simple framework for merging data. Their work raised aware-ness about fusing data from sensors on a single satellite to create a multi-sensor data set. NASA proposed to produce new product that provides AOD at the L2 nominal 10 km spatial scale derived from both Dark Target over land and Deep Blue algorithms
20
in the collection 006 (Remer, 2011).
The most obvious benefit of merging data is improvement in spatial and temporal coverage. Single-sensor daily coverage is severely limited by gaps between consecu-tive swaths and gaps caused by clouds, sun glint and other phenomena that disable the extraction of satellite parameters (Gregg et al., 1998). Fusion of data from multiple
25
ACPD
12, 10461–10492, 2012Merging aerosol optical depth data from multiple satellite
missions
Y. Xue et al.
Title Page
Abstract Introduction
Conclusions References
Tables Figures
◭ ◮
◭ ◮
Back Close
Full Screen / Esc
Printer-friendly Version
Interactive Discussion
Discussion
P
a
per
|
Dis
cussion
P
a
per
|
Discussion
P
a
per
|
Discussio
n
P
a
per
|
characteristics because they enable a broadening of the scope of ocean colour ap-plications (Kwiatkowska et al., 2002).
In this paper, we expanded the spatial coverage of agricultural biomass aerosol dis-tributions and reduced uncertainties in their measurements (by using an optimal in-terpolation technique) in the study region of China during the ABB period. For this
5
purpose, we used data from multiple satellites including MODIS and MISR and multi-ple algorithms including the synergetic retrieval of aerosol properties (SRAP-MODIS; Xue and Cracknell, 1995; Tang et al., 2005), Deep Blue (DB; Hsu et al., 2004) and the Dark Target (DT; Remer et al., 2006) for MODIS-retrieved AOD for the production of the merged AOD using optimal interpolation algorithm. A nearly one-month study
10
period was chosen so that a whole ABB season could be analysed. We studied the spatial and temporal evolution of CO2products that were emitted from these ABB fires. In addition, the MODIS Fire Mapper product (http://rapidfire.sci.gsfc.nasa.gov/) and tra-jectory analyses were used to better understand the variability of the fires in the source region of the ABB aerosol plume.
15
2 Study area and data
2.1 Study area
Large areas of cropland are present in Central and East China, in particular in densely populated areas such as the Anhui, Henan, Jiangsu and Shandong provinces. Cities in these provinces with more than one million in population include Nanjing, Jinan, and
20
Hefei. In order to study the influence of ABB, we chose the study region with a latitude range from 86◦N to 136◦N and a longitude range from 15◦E to 60◦E, which is shown in Fig. 1a. Figure 1b gives the location of the ground-based observation sites, includ-ing AErosol RObotic NETwork (AERONET) sites and China Aerosol Remote Sensinclud-ing NETwork (CARSNET) sites. Every year most of the agriculture residues from the area
25
are burned between May and October, with a peak in June. Within the month of June,
ACPD
12, 10461–10492, 2012Merging aerosol optical depth data from multiple satellite
missions
Y. Xue et al.
Title Page
Abstract Introduction
Conclusions References
Tables Figures
◭ ◮
◭ ◮
Back Close
Full Screen / Esc
Printer-friendly Version
Interactive Discussion
Discussion
P
a
per
|
Dis
cussion
P
a
per
|
Discussion
P
a
per
|
Discussio
n
P
a
per
|
straw burning has occurred mainly in the first half of the month, accounting for 87.3 % of the total straw burning events (Li et al., 2009). We chose to study the time period from 26 May to 16 June 2007 because it is one of the worst ABB events in China.
2.2 Multiple satellite data sets
In this study, we used AOD values at 0.55 µm that were retrieved from MODIS and
5
MISR data during ABB, the detailed description of these data sets are as follows:
2.2.1 MODIS AOD data
MODIS is a new generation of imaging spectroradiometer that has moderate spectral resolution with 36 spectral bands covering wavelengths from 0.4 to 14 µm. In addition, it has three spatial resolutions (250 m, 500 m and 1000 m) and a swath of 2330 km.
10
MODIS AODs are retrieved using multiple channels from the MODIS sensors aboard the Terra and Aqua satellites, which began observations in 2000 and 2002, respec-tively.
Three AOD retrieval techniques from MODIS data (SRAP-MODIS, DB and DT) are analysed in this work. Currently, DT and DB are two mainstream algorithms for AOD
15
retrievals over land and have been evaluated and periodically updated (Remer et al., 2005; Levy et al., 2007a, b; Remer et al., 2008). The DT algorithm is applicable to dark surfaces and has been adopted for MODIS aerosol products, Collection 051. The DB method expands MODIS AOD coverage to bright desert surfaces. SRAP-MODIS algorithm can be used for various ground surfaces, including for high reflective surface
20
(Xue et al. 2011).
For DB and DT algorithm, we used MOD04 L2 C051, at the spatial resolution of 10 km×10 km, for the spatial range of 86◦–136◦E and 15◦–60◦N. For the SRAP method,
we used Terra MODIS data, including L1B calibrated data MOD/MYD02, geolocation data MOD/MYD03 and cloud mask product MOD/MYD35, with a resolution of 1 km×
25
ACPD
12, 10461–10492, 2012Merging aerosol optical depth data from multiple satellite
missions
Y. Xue et al.
Title Page
Abstract Introduction
Conclusions References
Tables Figures
◭ ◮
◭ ◮
Back Close
Full Screen / Esc
Printer-friendly Version
Interactive Discussion
Discussion
P
a
per
|
Dis
cussion
P
a
per
|
Discussion
P
a
per
|
Discussio
n
P
a
per
|
2.2.2 MISR AOD data
MISR is another important specialised instrument on the Terra satellite that provides AOD data over land (Martonchik et al., 1998; Diner et al., 2005). In this paper, we used the MISR Level 2 aerosol product data set (MIL2ASAE). The MISR Level 2 Aerosol/Surface Products are geophysical measurements derived from the Level 1B2
5
data. These measurements include a range of parameters such as tropospheric AOD, aerosol composition and size, surface directional reflectance factors, bi-hemispherical reflectance and many others.
The Level 2 products are in swaths, each derived from a single MISR orbit, where the imagery is 360 km wide and approximately 20 000 km long. Due to the narrow swath
10
width (360 km), near-global coverage is obtained only over nine days at the equator and two days near the poles. There are 233 distinct repeating orbits called paths, which are repeated every 16 days and are labelled according to the Landsat Worldwide Reference System. To simplify the processing and storing of these data over a large geographical area, each MISR path is divided into a series of predefined,
uniform-15
sized boxes along the ground track. Each path is divided into 180 blocks, measuring 563.2 km (cross-track) by 140.8 km (along-track). For a given path, a numbered block always contains the same geographic location. The MISR Ancillary Geographic Prod-uct contains geographical information presented on a Space Oblique Mercator map projection. For each fixed MISR orbit, the latitude and longitude of every MISR pixel
20
are stored in a separate data file on a 1.1-km2 grid resolution. These 233 files corre-sponding to 233 distinct MISR orbits provided as separate parameters can be used to geolocate the level 2 data products (Gupta et al., 2008).
2.3 Ground observation data
The AERONET is a federation of ground-based remote sensing aerosol networks
25
providing a long-term, continuous and readily accessible public domain database of globally distributed observations of spectral AOD, inversion products, and precipitable
ACPD
12, 10461–10492, 2012Merging aerosol optical depth data from multiple satellite
missions
Y. Xue et al.
Title Page
Abstract Introduction
Conclusions References
Tables Figures
◭ ◮
◭ ◮
Back Close
Full Screen / Esc
Printer-friendly Version
Interactive Discussion
Discussion
P
a
per
|
Dis
cussion
P
a
per
|
Discussion
P
a
per
|
Discussio
n
P
a
per
|
water in diverse aerosol regimes. AOD data are computed for three data quality levels: Level 1.0 (unscreened), Level 1.5 (cloud-screened), and Level 2.0 (cloud-screened and quality-assured). Typically, the sun photometers that are currently installed take mea-surements of the direct sun radiance at eight spectral channels (340, 380, 440, 500, 670, 870, 940 and 1020 nm) with triplet observations per wavelength and diffuse sky
5
radiances at four spectral channels (440, 670, 870 and 1020 nm).
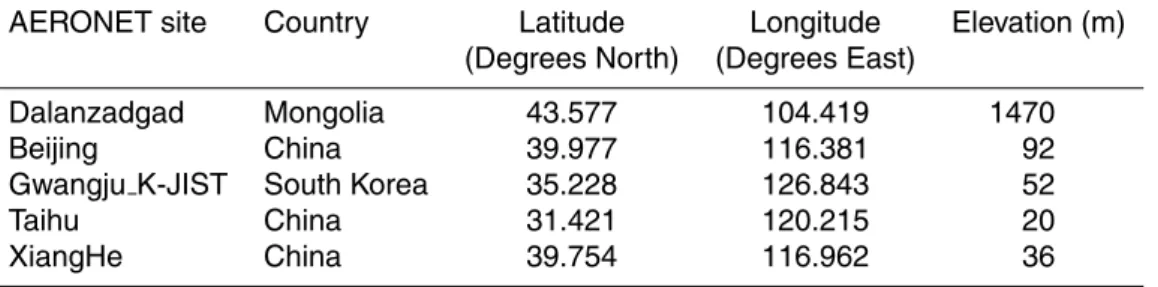
To validate our merged AOD results and study the variation of AOD during the ABB, version 1.5 AERONET data from five sites in the study area (Beijing, Dalanzadgad, Gwangju K-JIST, Taihu, and XiangHe) were collected. The time interval between an AERONET measurement and a satellite passing overhead is less than 30 min. Table 1
10
shows information about the latitude, longitude and elevation of the selected AERONET sites. To investigate particle size, the ˚Angstr ¨om exponent, which is related to the size distribution of the aerosols, was calculated using spectral AOD data.
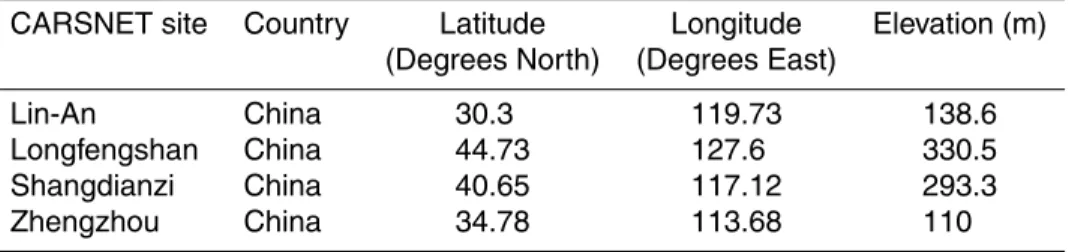
The CARSNET is a ground-based aerosol monitoring network that uses the same CE-318 sun photometers as AERONET. CARSNET was established by the China
Me-15
teorological Administration for a dust aerosol optical property study in 2002. To study the variation of AOD during the ABB, data from four CARSNET sites in the study area (Lin-An, Longfengshan, Shangdianzi, and Zhengzhou) were collected for validation of our results. Table 2 shows information about the latitude, longitude and elevation of the selected CARSNET sites.
20
2.4 MODIS fire point data
The MODIS Rapid Response System was developed to provide daily satellite images of the Earth’s landmasses in near real time. The Fire Information for Resource Man-agement System (FIRMS; http://maps.geog.umd.edu/) at the University of Maryland integrates remote sensing and GIS technologies to deliver global MODIS hotspot/fire
25
ACPD
12, 10461–10492, 2012Merging aerosol optical depth data from multiple satellite
missions
Y. Xue et al.
Title Page
Abstract Introduction
Conclusions References
Tables Figures
◭ ◮
◭ ◮
Back Close
Full Screen / Esc
Printer-friendly Version
Interactive Discussion
Discussion
P
a
per
|
Dis
cussion
P
a
per
|
Discussion
P
a
per
|
Discussio
n
P
a
per
|
3 Model and methods
3.1 Model
In this paper, we suggest that assimilation of one aerosol observation to another aerosol observation may provide a new mechanism for improving the skill of satellite aerosol retrieval. Our study is motivated by the success of recent efforts to assimilate
5
tropospheric- and satellite-based observations into chemical transport models (Collins et al., 2001). We implemented an optimal interpolation technique similar to the method-ology described by Collins et al. (2001) for INDOEX aerosols using the MATCH model. The mathematical relationship between the posterior AOD distributions and the two satellite-based AOD distributions is
10
τ′
SRAP-MODIS=τSRAP-MODIS+K(τDT−τSRAP-MODIS) (1)
whereτ′
SRAP-MODIS is the posterior AOD; τDT and τSRAP-MODIS are satellite-based
ob-served AODs derived by the MODIS DT and SRAP-MODIS algorithms, respectively.
Kis the Kalman gain matrix, and H is a linear interpolator from satellite observation space to observation space. Because the DT and SRAP-MODIS have the same
reso-15
lution, theHmatrix is simply the identity matrixI. TheKmatrix is calculated using the two observation error covariance matrices and is defined by Eq. (2).
K=OSRAP-MODISHT(HOSRAP-MODISHT+ODT)−1 (2)
OSRAP-MODIS and ODT are the error covariance matrices of the SRAP-MODIS and DT algorithms, respectively. The two observational error matrices,OSRAP-MODIS and ODT,
20
are diagonal.
ODT=(fDTτDT+εDT)2I (3)
OSRAP-MODIS=(fSRAP-MODISτSRAP-MODIS+εSRAP-MODIS)2I (4)
εDT and εSRAP-MODIS are the minimum RMS error of the observation, and fDT and
25
ACPD
12, 10461–10492, 2012Merging aerosol optical depth data from multiple satellite
missions
Y. Xue et al.
Title Page
Abstract Introduction
Conclusions References
Tables Figures
◭ ◮
◭ ◮
Back Close
Full Screen / Esc
Printer-friendly Version
Interactive Discussion
Discussion
P
a
per
|
Dis
cussion
P
a
per
|
Discussion
P
a
per
|
Discussio
n
P
a
per
|
3.2 Method
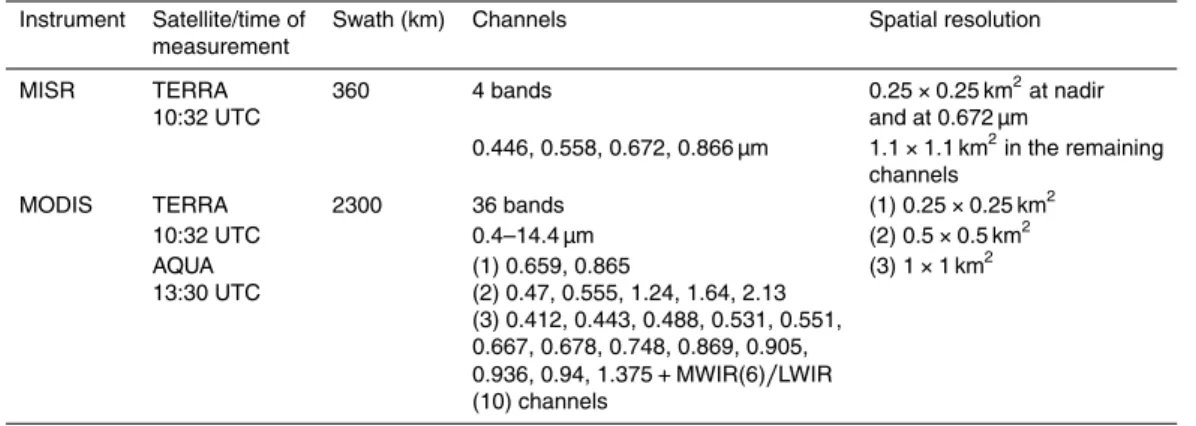
There are many difficulties associated with the AOD data merger process. The sen-sors have varying designs and characteristics, and there are differences “associated with radiometric calibration, assumption of aerosol properties, cloud contamination, and correction of the surface effect” (Li et al., 2009). One problem arises from the
dif-5
fering spatial resolutions of the instruments (see Table 3). MODIS aerosol products are derived at the spatial resolution of 10 km×10 km at 0.55 µm, while the resolution of
MISR aerosol products is 17.6 km×17.6 km. To facilitate comparisons between MISR
and MODIS observations, we define a common geographic grid with a uniform, 10 km spacing that over samples the regions of both products. With the underlying
assump-10
tion that the retrieved values represent the entire 17.6-km retrieval region for MISR, sta-tistical comparisons made at the grid points amount to symmetric equal-area weighting of the MISR and MODIS results.
4 Results and discussion
4.1 Comparison between merged AOD and single-sensor single-algorithm AOD
15
data
In order to compare the merged AOD data with single-sensor and single algorithm AOD data, two methods are used. One is to compare the spatial coverage; another is to compare with the AERONET data.
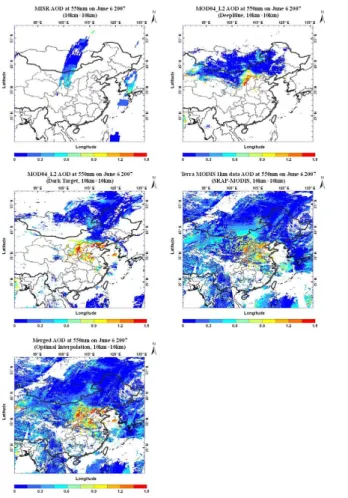
Figure 2 shows the comparison of the spatial coverage between merged AOD data
20
and single-sensor and single algorithm AOD data. Obviously, the merged AOD data had great improvement in spatial and temporal aerosol optical depth coverage.
In the comparison with AERONET AOD data between merged AOD data and single-sensor and single algorithm AOD data, we required that the time difference between satellite overpass and the AERONET AOD measurement within half an hour. Figure 3a
ACPD
12, 10461–10492, 2012Merging aerosol optical depth data from multiple satellite
missions
Y. Xue et al.
Title Page
Abstract Introduction
Conclusions References
Tables Figures
◭ ◮
◭ ◮
Back Close
Full Screen / Esc
Printer-friendly Version
Interactive Discussion
Discussion
P
a
per
|
Dis
cussion
P
a
per
|
Discussion
P
a
per
|
Discussio
n
P
a
per
|
shows the comparison between MISR AOD and AERONET measurements at 0.55 µm. The data period covered is from 26 May to 16 June 2007. The correspondence is with a linear correlation coefficient of 0.7006. Figure 3b shows the comparison between MODIS DT AOD and AERONET measurements at 0.55 µm. The correspondence is with a linear correlation coefficient of 0.9174. Figure 3c shows the comparison
be-5
tween MODIS Deep Blue AOD and AERONET measurements at 0.55 µm. The corre-spondence is with a linear correlation coefficient of 0.955. Figure 3d shows the com-parison between SRAP-MODIS AOD and AERONET measurements at 0.55 µm. The correspondence is with a linear correlation coefficient of 0.9083. Figure 3e shows the comparison between merged AOD and AERONET measurements at 0.55 µm. The
cor-10
respondence is with a linear correlation coefficient of 0.8479.
We want to emphasize that the period in our study is rather short to make any com-prehensive comparison against previous validation studies. However, further validation is on-going.
4.2 Satellite and ground-based observation
15
In this section, we analyse the data of active fires detected by the MODIS Rapid Response System, merged AOD dataset from satellite data, MODIS cloud dataset (MOD35) and air pollution indexes (API). Table 4 shows the air quality classifications corresponding to the APIs, air quality management recommendations, and pollutant concentrations in China (Qu et al., 2010). Figure 4 shows the locations of 37 in situ
20
measurement sites in China.
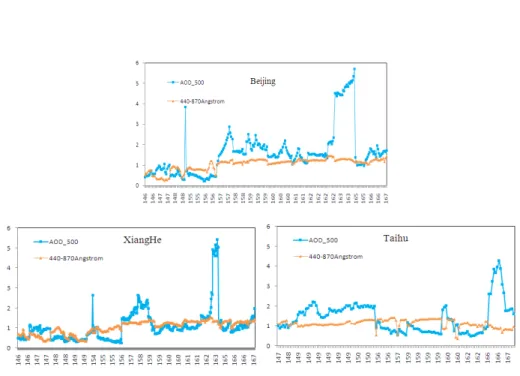
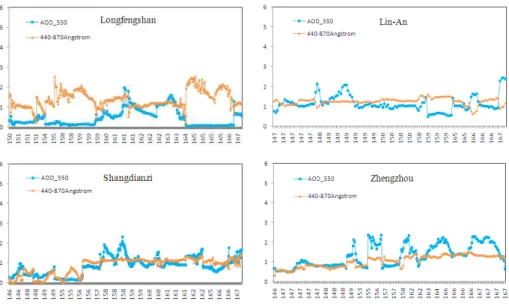
From 22 May to 20 June 2007, there was a very serious biomass burning event in China. Three AERONET sites (Beijing, Taihu, and XiangHe) and four CARSNET sites (Lin-An, Longfengshan, Shangdianzi, and Zhengzhou) were chosen for further analysis. Figures 5 and 6 show continuous measurements for the merged AOD values
25
and the ˚Angstr ¨om exponents (440–870 nm) from 26 May to 16 June 2007. Figure 5 shows that in both Beijing and Xianghe sites, the AOD values reach up to 3.84 and 2.6, respectively, on 3 June 2007. This is because of the thin cirrus which can be seen on
ACPD
12, 10461–10492, 2012Merging aerosol optical depth data from multiple satellite
missions
Y. Xue et al.
Title Page
Abstract Introduction
Conclusions References
Tables Figures
◭ ◮
◭ ◮
Back Close
Full Screen / Esc
Printer-friendly Version
Interactive Discussion
Discussion
P
a
per
|
Dis
cussion
P
a
per
|
Discussion
P
a
per
|
Discussio
n
P
a
per
|
MOD35 cloud map. On 6 June 2007, the AOD values measured in Beijing and Xianghe are over 1.0 because of the heavy pollution of biomass burning. For Taihu site, AOD values are high over 1.0 to 2.22 between 28 and 29 May 2007. Between 11 and 15 June, the AOD values for Beijing, Taihu and Xianghe are very high over 5.0 because of the heavy aerosol from biomass burning.
5
For CARSNET Zhengzhou site in Fig. 6, AOD values are always over 1.0 from 27 May 2007 because of the biomass burning. Lin-An site is at the south of biomass burning area and Longfenshan and Shangdianzi are far away from the middle of China. They are not affected by the biomass burning.
Merged AOD values, API and the active fires detected by the MODIS Rapid
Re-10
sponse System over Central and Eastern China from 28 to 29 May 2007 are shown in Fig. 7. It can be clearly seen that the spatial and temporal variation of AOD is very large during the ABB procedure. The merged AOD maps are consistent with MOD35 data in terms of heavy aerosol as well as the APIs around Henan province.
Based on the merged AOD images in Fig. 8, the high AOD values were found in
15
Central and East China from 13 and 15 June 2007. Although the biomass burning happened around Shandong in east China, the aerosols move westwards because of the northeast (NE) and southeast winds (SE) on 13 and 14 June 2007. On 14 June 2007, the NE and NW wind dominates and aerosol from the biomass burning move to south of China. This is consistent with both retrieved AOD results and MOD35 cloud
20
map.
5 Conclusions
Each year during the dry season in Central and Eastern China, agricultural activities result in several tera-grams of smoke aerosols being released into the atmosphere. These aerosols significantly affect the regional environment and global climate. From
25
ACPD
12, 10461–10492, 2012Merging aerosol optical depth data from multiple satellite
missions
Y. Xue et al.
Title Page
Abstract Introduction
Conclusions References
Tables Figures
◭ ◮
◭ ◮
Back Close
Full Screen / Esc
Printer-friendly Version
Interactive Discussion
Discussion
P
a
per
|
Dis
cussion
P
a
per
|
Discussion
P
a
per
|
Discussio
n
P
a
per
|
Until recently, MODIS DT aerosol products were not derived over bright targets such as deserts, while the MODIS Deep Blue algorithm now provides aerosol retrievals over bright surfaces. In contrast, MISR data have been validated over bright surfaces. MISR provides better retrievals than MODIS in bright areas but is limited in its horizontal swath compared to MODIS AOD products. Our paper describes one strong ABB
pro-5
cedure during 26 May to 16 June 2007 using merged AOD data from SRAP-MODIS, NASA MODIS and MISR AOD products and in site data (including AERONET data and CARSNET data). The results indicate that merged AOD products improve the quality of AOD products from single-mission data sets by expanding the spatial coverage of the study area and increasing the statistical confidence in the generated parameters.
10
Acknowledgement. This work was supported in part by the Major International
Coopera-tion and Exchange Project of NaCoopera-tional Natural Science FoundaCoopera-tion of China (Grant No. 41120114001), the Ministry of Science and Technology (MOST), China under grant Nos. 2009CB723906, 2010CB950803 and 2010CB950802 and by the Chinese Academy of Sci-ences under grant no. XDA05100200. MODIS data were made available by NASA MODIS
15
LAADS. Fire data came from http://maps.geog.umd.edu/, while MLS data were accessed at http://mirador.gsfc.nasa.gov/. The data for validation came from three AERONET sites (Bei-jing, Taihu, and XiangHe) and CARSNET sites (Lin-An, Longfengshan, Shangdianzi, and Zhengzhou). We thank the PI, investigators and their staff for establishing and maintaining the in situ measurement sites used in this investigation.
20
References
Adhikary, B., Kulkarni, S., Dallura A., Tang, Y., Chai, T., Leung, L. R., Qian, Y., Chung, C. E., Ra-manathan, V., and Carmichael, G. R.: A regional scale chemical transport modeling of Asian aerosols with data assimilation of AOD observations using optimal interpolation technique, Atmos. Environ., 42, 8600–8615, 2008.
25
Ainslie, B. and Jackson, P. L.: The use of an atmospheric dispersion model to determine influ-ence regions in the Prince George, BC airshed from the burning of open wood waste piles, J. Environ. Manage., 90(8), 2393–2401, 2009.
ACPD
12, 10461–10492, 2012Merging aerosol optical depth data from multiple satellite
missions
Y. Xue et al.
Title Page
Abstract Introduction
Conclusions References
Tables Figures
◭ ◮
◭ ◮
Back Close
Full Screen / Esc
Printer-friendly Version
Interactive Discussion
Discussion
P
a
per
|
Dis
cussion
P
a
per
|
Discussion
P
a
per
|
Discussio
n
P
a
per
|
Anderson, T. L., Charlson, R. J., Bellouin, N., Boucher, O., Chin, M., Christopher, S. A., Hay-wood, J., Kaufman, Y. J., Kinne, S., Ogren, J. A., Remer, L. A., Takemura, T., Tanre, D., Torres, O., Trepte, C. R., Wielicki, B. A., Winker, D. M., and Yu, H.: An “A-Train” strategy for quantifying direct climate forcing by anthropogenic aerosols, B. Am. Meteorol. Soc., 86, 1795–1809, 2005.
5
Andreae, M. O., Artaxo, P., Fischer, H., Freitas, S. R., Gr ´egoire, J. M., Hansel, A., Hoor, P., Kormann, R., Krejei, R., Lange, L., Lelieveld, J., Lindinger, W., Longo, K., Peters, W., de Reus, M., Scheeren, B., Silva Dias, M. A. F., St ¨om, J., van Velthovon, P. F. J., and Williams, J.: Transport of biomass burning smoke to the upper troposphere by deep convection in the equatorial region, Geophys. Res. Lett., 28, 951–954, 2001.
10
Cao, G. L., Zhang, X. Y., and Zeng, F. C.: Inventory of black carbon and organic carbon emis-sions from China, Atmos. Environ., 40, 6516–6527, 2006.
Choi, Y. J. and Fernando, H. J. S.: Simulation of smoke plumes from agricultural bums: appli-cation to the San Luis/Rio Colorado airshed along the US/Mexico border, Sci. Total Environ., 388, 270–289, 2007.
15
Chu, D. A., Kaufman, Y. J., Ichoku, C., Remer, L. A., Tanre, D., and Holben, B. N.: Validation of MODIS aerosol retrieval over land, Geophys. Res. Lett., 29, 8007, doi:10.1029/2001GL013205, 2002.
Collins, W. D., Rasch, P. J., Eaton, B. E., Khattatov, B. V., and Lamarque, J. F.: Simulating aerosols using a chemical transport model with assimilation of satellite aerosol retrievals:
20
methodology for INDOEX, J. Geophys. Res., 106, 7313–7336, doi:10.1029/2000JD900507, 2001.
Deuz ´e, J. L., Br ´eon, F. M., Devaux, C., Goloub, Herman, M., Lafrance, B., Maignan, F., Marc-hand, A., Nadal, F., Perry, G., and Tanr ´e, D.: Remote sensing of aerosols over land sur-faces from POLDER-ADEOS-1 polarized measurements, J. Geophys. Res., 106, 4913–
25
4926, 2001.
Diner, D. J., Martonchik, J. V., Kahn, R. A., Pinty, B., Gobron, N., Nelson, D. L., and Hol-ben, B. N.: Using angular and spectral shape similarity constraints to improve MISR aerosol and surface retrievals over land, Remote Sensing Environ., 94, 155–171, 2005.
Evangelista, H., Maldonado, J., Godoi, R. H. M., Pereira, E. B., Koch, D., Tanizaki-Fonseca, K.,
30
ACPD
12, 10461–10492, 2012Merging aerosol optical depth data from multiple satellite
missions
Y. Xue et al.
Title Page
Abstract Introduction
Conclusions References
Tables Figures
◭ ◮
◭ ◮
Back Close
Full Screen / Esc
Printer-friendly Version
Interactive Discussion
Discussion
P
a
per
|
Dis
cussion
P
a
per
|
Discussion
P
a
per
|
Discussio
n
P
a
per
|
Fargion, G. S., Kwiatkowska, E. J., and Bailey, S.: An Overview of SIMBIOS Project Contri-butions in Support of MODIS, MODIS Science Team Meeting presentation, Greenbelt, MD, USA, available at: http://modisocean.gsfc.nasa.gov/refs.html, July 2002.
Freitas, S. R., Longo, K. M., Dias, M. A. E. S., Dias, P. L. S., Chatfield, R., Prins, E., Artaxo, P., Grell, G. A., and Recuero, F. S.: Monitoring the transport of biomass burning emissions in
5
South America, Environ. Fluid Mech., 5, 135–167, 2005.
Gregg, W. W., Esaias, W. E., Feldman, G. C., Frouin, R., Hooker, S. B., McClain, C. R., and Woodward, R. H.: Coverage opportunities for global ocean color in a multimission era, IEEE T. Geosci. Remote, 36, 1620–1627, 1998.
Gupta, P., Patadia, F., and Christopher, S. A.: Multisensor data product fusion for aerosol
re-10
search, IEEE T. Geosci. Remote, 46, 1407–1415, 2008.
He, L. M., Wang, W. J., Wang, Q., Wei, B., Li, Q., Wang, C. Z., and Liu, X. X. M.: Evaluation of the agriculture residues burning reduction in China using MODIS fire product, Environ. Monit. China, 23, 42–50, 2007.
Hsu, N. C., Tsay, S. C., King, M. D., and Herman, J. R.: Aerosol properties over bright-reflecting
15
source regions, IEEE T. Geosci. Remote, 42, 557–569, 2004.
Jain, R., Vaughan, J., Kyle, H., Ramosa, C., Clalborn, C., Maarten, S., Schaaf, M., and Lamb, B.: Development of the ClearSky smoke dispersion forecast system for agricultural field burning in the Pacific Northwest, Atmos. Environ., 41, 6745–6761, 2007.
Kaufman, Y. J., Tanr ´e, D., Remer, L. A., Vermote, E. F., Chu, A., and Holben, B. N.: Operational
20
remote sensing of tropospheric aerosol over land from EOS moderate resolution imaging spectroradiometer, J. Geophys. Res., 102, 17051–17067, 1997.
Kilpatrick, K., Kearns, E., Kwiatkowska-Ainsworth, E. J., and Evans, R. L.: Time Series of Cali-brated Ocean Products from NASA’s Moderate Resolution Scanning Spectrometer (MODIS), Proceedings of the Ocean Sciences Meeting, Honolulu, Hawaii, USA, 2002.
25
Kokhanovsky, A. A. and De Leeuw, G.: Satellite Aerosol Remote Sensing Over Land, Chich-ester, UK: Springer-Praxis, 2009.
Kokhanovsky, A. A., Breon, F. M., Cacciari, A., Carboni, E., Diner, D., Nicolantonio, W. D., Grainger, R. G., Grey, W. M. F., H ¨oller, R., Lee, K. H., Li, Z., North, P. R. J., Sayer, A. M., Thomas, G. E., and Von Hoyningen-Huene, W.: Aerosol remote sensing over land: a
com-30
parison of satellite retrievals using different algorithms and instruments, Atmos. Res., 85, 372–394, 2007.
ACPD
12, 10461–10492, 2012Merging aerosol optical depth data from multiple satellite
missions
Y. Xue et al.
Title Page
Abstract Introduction
Conclusions References
Tables Figures
◭ ◮
◭ ◮
Back Close
Full Screen / Esc
Printer-friendly Version
Interactive Discussion
Discussion
P
a
per
|
Dis
cussion
P
a
per
|
Discussion
P
a
per
|
Discussio
n
P
a
per
|
Kwiatkowska, E. J. and Fargion, G. S.: Merger of Ocean Color Information from Multiple Satel-lite Missions under the NASA SIMBIOS Project Office: Proceedings of the Fifth International Conference on Information Fusion, Annapolis, MD, USA, vol. 1, 291–298, 2002.
Levy, R. C., Remer, L. A., and Dubovik, O.: Global aerosol optical properties and application to MODIS aerosol retrieval over land, J. Geophys. Res., 112, D13210,
5
doi:10.1029/2006JD007815, 2007.
Li, Q., Zhang, L. J., Wu, C. Q., Sun, Z. P., and Liu, X. M.: Satellite remote sensing based monitoring of straw burning and analysis of its impact on air, J. Ecol. Rural Environ., 25, 32–37, 2009.
Li, Z., Niu, F., Lee, K. H., Xin, J., Hao, W. M., Nordgren, B., Wang, Y., and Wang, P.:
Valida-10
tion and understanding of Moderate Resolution Imaging Spectroradiometer aerosol prod-ucts (C5) using ground-based measurements from the handheld Sun photometer network in China, J. Geophys. Res., 112, D22S07, doi:10.1029/2007JD008479, 2007.
Li, Z., Zhao, X., Kahn, R., Mishchenko, M., Remer, L., Lee, K. H., Wang, M., Laszlo, I., Naka-jima, T., and Maring, H.: Uncertainties in satellite remote sensing of aerosols and impact
15
on monitoring its long-term trend: a review and perspective, Ann. Geophys.-Germany, 27, 2755–2770, 2009.
Martonchik, J. V., Diner, D. J., Kahn, R., Ackerman, T. P., Verstraete, M. M., Pinty, B., and Gordon, H. R.: Techniques for the retrieval of aerosol properties over land and ocean using multiangle imaging, IEEE T. Geosci. Remote, 36, 1212–1227, 1998.
20
Mi, W., Li, Z., Xia, X., Holben, B., Levy, R., Zhao, F., Chen, H., and Cribb, M.: Evaluation of the Moderate Resolution Imaging Spectroradiometer aerosol products at two Aerosol Robotic Network stations in China, J. Geophys. Res., 112, D22S08, doi:10.1029/2007JD008474, 2007.
Qin, S. G., Ding, A. J., and Wang, T.: Transport pattern of biomass burnings air masses in
25
Eurasia and the impacts on China, China Environ. Sci., 26, 641–645, 2006.
Qu, W. J., Arimoto, R., Zhang, X. Y., Zhao, C. H., Wang, Y. Q., Sheng, L. F., and Fu, G.: Spatial distribution and interannual variation of surface PM10concentrations over eighty-six Chinese
cities, Atmos. Chem. Phys., 10, 5641–5662, doi:10.5194/acp-10-5641-2010, 2010.
Ramanathan, V., Crutzen, P. J., Kiehl, J. T., and Rosenfeld, D.: Aerosols, climate, and the
hy-30
ACPD
12, 10461–10492, 2012Merging aerosol optical depth data from multiple satellite
missions
Y. Xue et al.
Title Page
Abstract Introduction
Conclusions References
Tables Figures
◭ ◮
◭ ◮
Back Close
Full Screen / Esc
Printer-friendly Version
Interactive Discussion
Discussion
P
a
per
|
Dis
cussion
P
a
per
|
Discussion
P
a
per
|
Discussio
n
P
a
per
|
Remer, L.: Dark Target/Deep Blue Merge, Proposed Collection 006 Change Document L2 Aerosol Version 28 (4 August 2011), available at: http://modis.gsfc.nasa.gov/data/atbd/ atmos atbd.php, 2011.
Remer, L. A., Kaufman, Y. J., Tanre, D., Mattoo, S., Chu, D. A., Martins, J. V., Li, R. R., Ichoku, C., Levy, R. C., Kleidman, R. G., Eck, T. F., Vermote, E., and Holben, B. N.: The
5
MODIS aerosol algorithm, products and validation, J. Atmos. Sci., 62, 947–973, 2005. Remer, L. A., Tanr ´e, D., and Kaufman, Y. J.: Algorithm for Remote Sensing of Tropospheric
Aerosol from MODIS: Collection 5, atbd mod 02.pdf, available at: http://modis.gsfc.nasa.gov/ data/atbd/atmos atbd.php, 2006.
Remer, L. A., Kleidman, R. G., Levy, R. C., Kaufman, Y. J., Tanr ´e, D., Mattoo, S., Martins, J. V.,
10
Ichoku, C., Koren, I., Yu, H., and Holben, B. N.: Global aerosol climatology from the MODIS satellite sensors, J. Geophys. Res., 113, D14S07, doi:10.1029/2007JD009661, 2008. Streets, D. G., Yarber, K. F., Woo, J. H., and Carmichael, G. R.: Biomass burning in Asia:
annual and seasonal estimates and atmospheric emissions, Global Biogeochem. Cy., 17, 1099, doi:10.1029/2003GB002040, 2003.
15
Tang, J., Xue, Y., Yu, T., and Guan, Y.: Aerosol optical thickness determination by exploiting the synergy of TERRA and AQUA MODIS, R. Sens. Environ., 94, 327–334, 2005.
Thiebaux, H. J. and Pedder, M. A.: Spatial Objective Analysis with Applications in Atmospheric Sciences, Academic Press, 129–204, 1987.
Veefkind, J. P., de Leeuw, G., and Durkee, P. A.: Retrieval of aerosol optical depth over land
20
using two-angle view satellite radiometry during TARFOX, Geophys. Res. Lett., 25, 3135– 3138, 1998.
Von Hoyningen-Huene, W., Freitag, M., and Burrows, J. B.: Retrieval of aerosol optical thick-ness over land surfaces from top-of-atmosphere radiance, J. Geophys. Res., 108, 4260, doi:10.1029/2001JD002018, 2003.
25
Von Hoyningen-Huene, W., Kokhanovsky, A. A., Burrows, J. B., Bruniquel-Pinel, V., Regner, P., Baret, F.: Simultaneous determination of aerosol and surface characteristics from top-of-atmosphere reflectance using MERIS on board ENVISAT, Adv. Space Res., 37, 2172–2177, 2006.
Xue, Y. and Cracknell, A. P.: Operational bi-angle approach to retrieve the Earth surface albedo
30
from AVHRR data in the visible band, Int. J. Remote Sens., 16, 417–429, 1995.
ACPD
12, 10461–10492, 2012Merging aerosol optical depth data from multiple satellite
missions
Y. Xue et al.
Title Page
Abstract Introduction
Conclusions References
Tables Figures
◭ ◮
◭ ◮
Back Close
Full Screen / Esc
Printer-friendly Version
Interactive Discussion
Discussion
P
a
per
|
Dis
cussion
P
a
per
|
Discussion
P
a
per
|
Discussio
n
P
a
per
|
Xue, Y., Guo, J. P., and Zhang, X. Y.: Aerosol optical thickness retrieval over non-Lambertian land surface with synergistic use of AATSR radiance measurements and MODIS derived Albedo Model Parameters, Atmos. Res., 93, 736–746, 2009.
Xue, Y., Xu, H., Li, Y., Yang, L., Mei, L., Guang, J., Hou, T., He, X., Dong, J., Chen, Z., and Qi, Y.: Long-term aerosol optical depth datasets over China retrieved from satellite data,
5
Atmos. Meas. Tech. Discuss., 4, 6643–6678, doi:10.5194/amtd-4-6643-2011, 2011.
ACPD
12, 10461–10492, 2012Merging aerosol optical depth data from multiple satellite
missions
Y. Xue et al.
Title Page
Abstract Introduction
Conclusions References
Tables Figures
◭ ◮
◭ ◮
Back Close
Full Screen / Esc
Printer-friendly Version
Interactive Discussion
Discussion
P
a
per
|
Dis
cussion
P
a
per
|
Discussion
P
a
per
|
Discussio
n
P
a
per
|
Table 1.AERONET sites selected for analysis.
AERONET site Country Latitude Longitude Elevation (m) (Degrees North) (Degrees East)
Dalanzadgad Mongolia 43.577 104.419 1470 Beijing China 39.977 116.381 92 Gwangju K-JIST South Korea 35.228 126.843 52 Taihu China 31.421 120.215 20 XiangHe China 39.754 116.962 36
ACPD
12, 10461–10492, 2012Merging aerosol optical depth data from multiple satellite
missions
Y. Xue et al.
Title Page
Abstract Introduction
Conclusions References
Tables Figures
◭ ◮
◭ ◮
Back Close
Full Screen / Esc
Printer-friendly Version
Interactive Discussion
Discussion
P
a
per
|
Dis
cussion
P
a
per
|
Discussion
P
a
per
|
Discussio
n
P
a
per
|
Table 2.CARSNET sites selected for analysis.
CARSNET site Country Latitude Longitude Elevation (m) (Degrees North) (Degrees East)
ACPD
12, 10461–10492, 2012Merging aerosol optical depth data from multiple satellite
missions
Y. Xue et al.
Title Page
Abstract Introduction
Conclusions References
Tables Figures
◭ ◮
◭ ◮
Back Close
Full Screen / Esc
Printer-friendly Version
Interactive Discussion
Discussion
P
a
per
|
Dis
cussion
P
a
per
|
Discussion
P
a
per
|
Discussio
n
P
a
per
|
Table 3.The characteristics of selected satellite instruments.
Instrument Satellite/time of Swath (km) Channels Spatial resolution measurement
MISR TERRA 360 4 bands 0.25×0.25 km2at nadir 10:32 UTC and at 0.672 µm
0.446, 0.558, 0.672, 0.866 µm 1.1×1.1 km2in the remaining channels
MODIS TERRA 2300 36 bands (1) 0.25×0.25 km2 10:32 UTC 0.4–14.4 µm (2) 0.5×0.5 km2 AQUA (1) 0.659, 0.865 (3) 1×1 km2 13:30 UTC (2) 0.47, 0.555, 1.24, 1.64, 2.13
(3) 0.412, 0.443, 0.488, 0.531, 0.551, 0.667, 0.678, 0.748, 0.869, 0.905, 0.936, 0.94, 1.375+MWIR(6)/LWIR (10) channels
ACPD
12, 10461–10492, 2012Merging aerosol optical depth data from multiple satellite
missions
Y. Xue et al.
Title Page
Abstract Introduction
Conclusions References
Tables Figures
◭ ◮
◭ ◮
Back Close
Full Screen / Esc
Printer-friendly Version
Interactive Discussion
Discussion
P
a
per
|
Dis
cussion
P
a
per
|
Discussion
P
a
per
|
Discussio
n
P
a
per
|
Table 4.Air quality classifications corresponding to the air pollution indexes (APIs), air quality management recommendations, and pollutant concentrations in China (Qu et al., 2010).
Air pollution index (API) Air quality classification Corresponding daily average pollutant concentration, µgm−3
PM10 SO2 NO2
API≤50 I Clean PM10≤50 SO2≤50 NO2≤80 50<API≤100 II Good 50<PM10≤150 50<SO2≤150 80<NO2≤120
100<API≤150 III1 Low-level pollution 150<PM10≤250 150<SO2≤475 120<NO2≤190 150<API≤200 III2 250<PM10≤350 475<SO2≤800 190<NO2≤280
200<API≤250 IV1 Mid-level pollution 350<PM10≤385 800<SO2≤1200 280<NO2≤422.5
250<API≤300 IV2 385<PM10≤420 1200<SO2≤1600 422.5<NO2≤565
ACPD
12, 10461–10492, 2012Merging aerosol optical depth data from multiple satellite
missions
Y. Xue et al.
Title Page
Abstract Introduction
Conclusions References
Tables Figures
◭ ◮
◭ ◮
Back Close
Full Screen / Esc
Printer-friendly Version
Interactive Discussion
Discussion
P
a
per
|
Dis
cussion
P
a
per
|
Discussion
P
a
per
|
Discussio
n
P
a
per
|
Fig. 1.AERONET and CARSNET sites used in this study (see Tables 1 and 2 for coordinates and elevation). Blue represents AERONET sites and purple represents CARSNET sites.
ACPD
12, 10461–10492, 2012Merging aerosol optical depth data from multiple satellite
missions
Y. Xue et al.
Title Page
Abstract Introduction
Conclusions References
Tables Figures
◭ ◮
◭ ◮
Back Close
Full Screen / Esc
Printer-friendly Version
Interactive Discussion
Discussion
P
a
per
|
Dis
cussion
P
a
per
|
Discussion
P
a
per
|
Discussio
n
P
a
per
|
Fig. 3.Relationships between satellite AOD and AERONET AOD of different sensor and diff er-ent algorithm with resolution of 10 km in the study area:(a)MISR AOD(b)MODIS Dark Target AOD(c)MODIS Deep Blue AOD(d)SRAP-MODIS AOD data (e)Merged AOD data from 26 May to 16 June 2007.
ACPD
12, 10461–10492, 2012Merging aerosol optical depth data from multiple satellite
missions
Y. Xue et al.
Title Page
Abstract Introduction
Conclusions References
Tables Figures
◭ ◮
◭ ◮
Back Close
Full Screen / Esc
Printer-friendly Version
Interactive Discussion
Discussion
P
a
per
|
Dis
cussion
P
a
per
|
Discussion
P
a
per
|
Discussio
n
P
a
per
|
Fig. 4.The API in-situ measurement sites in 37 cities in China.
ACPD
12, 10461–10492, 2012Merging aerosol optical depth data from multiple satellite
missions
Y. Xue et al.
Title Page
Abstract Introduction
Conclusions References
Tables Figures
◭ ◮
◭ ◮
Back Close
Full Screen / Esc
Printer-friendly Version
Interactive Discussion
Discussion
P
a
per
|
Dis
cussion
P
a
per
|
Discussion
P
a
per
|
Discussio
n
P
a
per
|
Fig. 5.Time series of AOD at 500 nm and the ˚Angstr ¨om exponent (400–870 nm) at different AERONET sites during 21 days in 2007.
ACPD
12, 10461–10492, 2012Merging aerosol optical depth data from multiple satellite
missions
Y. Xue et al.
Title Page
Abstract Introduction
Conclusions References
Tables Figures
◭ ◮
◭ ◮
Back Close
Full Screen / Esc
Printer-friendly Version
Interactive Discussion
Discussion
P
a
per
|
Dis
cussion
P
a
per
|
Discussion
P
a
per
|
Discussio
n
P
a
per
|
μ
Fig. 7. AOD (at 0.55 µm) distribution over the study area for the period from 28 to 29 May 2007. The AOD was obtained from the merger of retrieved AODs from four different methods, as described in the text.
ACPD
12, 10461–10492, 2012Merging aerosol optical depth data from multiple satellite
missions
Y. Xue et al.
Title Page
Abstract Introduction
Conclusions References
Tables Figures
◭ ◮
◭ ◮
Back Close
Full Screen / Esc
Printer-friendly Version
Interactive Discussion
Discussion
P
a
per
|
Dis
cussion
P
a
per
|
Discussion
P
a
per
|
Discussio
n
P
a
per
|