AMTD
8, 5769–5808, 2015Complex experiment on stydying the
microphysical propertires of aerosol
particles
G. G. Matvienko et al.
Title Page
Abstract Introduction
Conclusions References
Tables Figures
◭ ◮
◭ ◮
Back Close
Full Screen / Esc
Printer-friendly Version
Interactive Discussion
Discussion
P
a
per
|
Discussion
P
a
per
|
Discussion
P
a
per
|
Discussion
P
a
per
|
Atmos. Meas. Tech. Discuss., 8, 5769–5808, 2015 www.atmos-meas-tech-discuss.net/8/5769/2015/ doi:10.5194/amtd-8-5769-2015
© Author(s) 2015. CC Attribution 3.0 License.
This discussion paper is/has been under review for the journal Atmospheric Measurement Techniques (AMT). Please refer to the corresponding final paper in AMT if available.
Complex experiment on stydying the
microphysical, chemical, and optical
propertires of aerosol particles and
estimating the contribution of
atmospheric aerosol to Earth radiation
budget
G. G. Matvienko1, B. D. Belan1, M. V. Panchenko1, O. A. Romanovskii1,2, S. M. Sakerin1, D. M. Kabanov1, S. A. Turchinovich1, Y. S. Turchinovich1, T. A. Eremina1, V. S. Kozlov1, S. A. Terpugova1, V. V. Pol’kin1, E. P. Yausheva1, D. G. Chernov1, T. B. Zhuravleva1, T. V. Bedareva1, S. L. Odintsov1,
V. D. Burlakov1, A. V. Nevzorov1, M. Yu. Arshinov1, G. A. Ivlev1, D. E. Savkin1, A. V. Fofonov1, V. A. Gladkikh1, A. P. Kamardin1, Yu. S. Balin1,
AMTD
8, 5769–5808, 2015Complex experiment on stydying the
microphysical propertires of aerosol
particles
G. G. Matvienko et al.
Title Page
Abstract Introduction
Conclusions References
Tables Figures
◭ ◮
◭ ◮
Back Close
Full Screen / Esc
Printer-friendly Version
Interactive Discussion
Discussion
P
a
per
|
Discussion
P
a
per
|
Discussion
P
a
per
|
Discussion
P
a
per
T. M. Rasskazchikova1, D. V. Simonenkov1, T. K. Sklyadneva1, G. N. Tolmachev1, S. B. Belan1, V. P. Shmargunov1, A. S. Kozlov3, and S. B. Malyshkin3
1
V. E. Zuev Institute of Atmospheric Optics SB RAS, 1 Academician Zuev sq., 634021 Tomsk, Russia
2
National Research Tomsk State University, 36 Lenina Ave., 634050 Tomsk, Russia
3
Voevodsky Institute of Chemical Kinetics and Combustion SB RAS, 3 Institutskaya Ave., 630090 Novosibirsk, Russia
Received: 14 April 2015 – Accepted: 18 May 2015 – Published: 12 June 2015 Correspondence to: O. A. Romanovskii ([email protected])
AMTD
8, 5769–5808, 2015Complex experiment on stydying the
microphysical propertires of aerosol
particles
G. G. Matvienko et al.
Title Page
Abstract Introduction
Conclusions References
Tables Figures
◭ ◮
◭ ◮
Back Close
Full Screen / Esc
Printer-friendly Version
Interactive Discussion
Discussion
P
a
per
|
Discussion
P
a
per
|
Discussion
P
a
per
|
Discussion
P
a
per
|
Abstract
The primary objective of the Complex Aerosol Experiment was measurement of micro-physical, chemical, and optical properties of aerosol particles in the surface air layer and free atmosphere. The measurement data were used to retrieve the whole set of aerosol optical parameters, necessary for radiation calculations. Three measurement
5
cycles were performed within the Experiment during 2013: in spring, when the aerosol generation is maximal; in summer (July), when atmospheric boundary layer altitude and, hence, mixing layer altitude are maximal; and in late summer – early autumn, during the period of nucleation of secondary particles. Numerical calculations were compared with measurements of downward solar fluxes on the Earth’s surface,
per-10
formed in the clear-sky atmosphere in summer periods in 2010–2012 in a background region of the boreal zone of Siberia. It has been shown that, taking into account the
instrumental errors and errors of atmospheric parameters, the relative differences
be-tween model and experimental values of direct and global solar radiation fluxes do not exceed, on the average, 1 and 3 %, respectively. Thus, independently obtained data
15
on the optical, meteorological, and microphysical parameters of the atmosphere allows intercalibration and inter-complement of the data and, thereby, provide for qualitatively new information which explains the physical nature of the processes that form the ver-tical structure of the aerosol field.
1 Introduction
20
The climate change observed for already more than one decade is recognized by the whole global community. Numerous national and international programs are devoted to investigation of possible causes and prediction of further climatic tendencies. Despite the common recognition of this problem, there is no consensus on the role of human ac-tivity in the global climate change. Thus, the studies of Antarctic ice cores have shown
25
AMTD
8, 5769–5808, 2015Complex experiment on stydying the
microphysical propertires of aerosol
particles
G. G. Matvienko et al.
Title Page
Abstract Introduction
Conclusions References
Tables Figures
◭ ◮
◭ ◮
Back Close
Full Screen / Esc
Printer-friendly Version
Interactive Discussion
Discussion
P
a
per
|
Discussion
P
a
per
|
Discussion
P
a
per
|
Discussion
P
a
per
et al., 2007) accompanied by an increase in the concentration of major greenhouse gases (CO2, CH4, and N2O). It was found that the increase in the temperature in the
Antarctic region started several centuries before the increase in the CO2concentration
(Monnin et al., 2001).
Although an important role of aerosols in climate changes is well established, the
5
level of understanding of the indirect effect of aerosols in radiative changes remains
very low. This fact complicates significantly the prediction of global changes in the Earth’s climate.
The permanent development and improvement of climatic models requires a
signif-icantly greater amount of field measurement data from different regions of the world.
10
The territory of Siberia occupying about 10 % of the world’s land is practically not cov-ered by the modern observation network. Meanwhile, Siberia lies in several climatic
zones, its ecosystems are very different, and therefore the intensity of sources and
sinks of atmospheric admixtures should vary significantly.
Taking into account the fact that every of methods for investigation of aerosol
param-15
eters is informative only in a certain wavelength range, only the combined analysis of all available experimental data can provide the correct reconstruction of the complete optical pattern of tropospheric aerosol in a particular region.
The objective of this study was simultaneous measurements of microphysical, chem-ical, and optical properties of aerosol particles in the surface air layer and free
atmo-20
sphere with a unique set of ground-based, airborne, and spaceborne instruments in order to draw a complete pattern of the composition and state of the atmosphere over the territory of Western Siberia.
In this connection, the following tasks were formulated:
– modernization and intercalibration of developed measurement tools;
25
– carrying out of measurement cycles;
– retrieval of the whole set of microphysical, chemical, and optical parameters of
AMTD
8, 5769–5808, 2015Complex experiment on stydying the
microphysical propertires of aerosol
particles
G. G. Matvienko et al.
Title Page
Abstract Introduction
Conclusions References
Tables Figures
◭ ◮
◭ ◮
Back Close
Full Screen / Esc
Printer-friendly Version
Interactive Discussion
Discussion
P
a
per
|
Discussion
P
a
per
|
Discussion
P
a
per
|
Discussion
P
a
per
|
– study and analysis of the influence of vertical variability of optical parameters of
tropospheric aerosol on radiative effects of aerosol under typical conditions of
Western Siberia.
2 Measurement system
The measurement system developed provides sun-photometric measurements of the
5
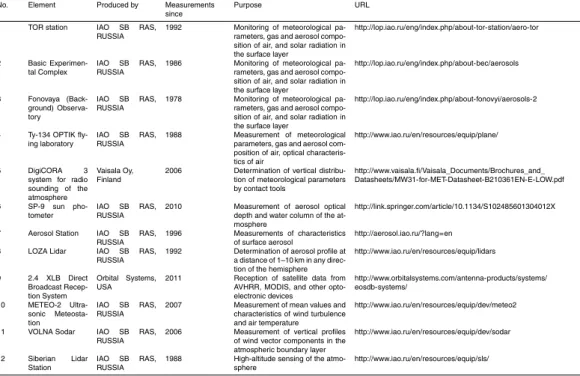
aerosol optical depth (AOD) of the atmosphere, acoustic sounding of the boundary layer, laser sensing of the aerosol content in the troposphere and stratosphere, mea-surement of the gas composition of the atmosphere (including greenhouse gases), measurement of meteorological parameters of air, in particular, with weather balloons. The composition and purpose of individual elements of the measurement system are
10
summarized in Table 1.
Let us first consider the systems used for measurements in the surface air and then describe the devices for measuring of the integral content of the sought parameters and their vertical distributions. Continuous measurements of the concentrations of mi-nor gas constituents (MGCs) were carried out at three IAO SB RAS stations for
mon-15
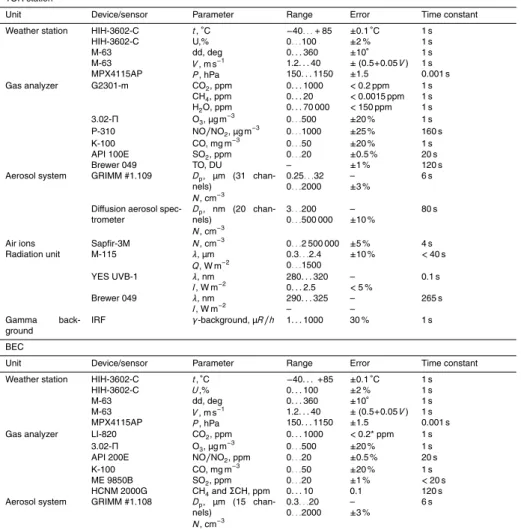
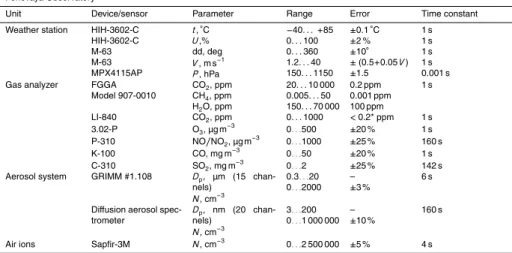
itoring the atmospheric composition: Fonovaya Observatory, TOR station, and Basic Experimental Complex (BEC). The measured parameters are summarized in Table 2; the operation of all the stations is described in detail in Arshinov et al. (2007).
For controlling the measurements and the state of the systems, all data from each station are transmitted collected to the central server every hour. As a result, the state
20
of the atmosphere is monitored in the nearly on-line mode. The graphic presentation of the monitored parameters is available on the website http://lop.iao.ru/activity/?id=mes, which is hourly updated. The interface allows selection of different options for viewing the current information both separately for each station and for a particular parameter measured at all the three stations.
AMTD
8, 5769–5808, 2015Complex experiment on stydying the
microphysical propertires of aerosol
particles
G. G. Matvienko et al.
Title Page
Abstract Introduction
Conclusions References
Tables Figures
◭ ◮
◭ ◮
Back Close
Full Screen / Esc
Printer-friendly Version
Interactive Discussion
Discussion
P
a
per
|
Discussion
P
a
per
|
Discussion
P
a
per
|
Discussion
P
a
per
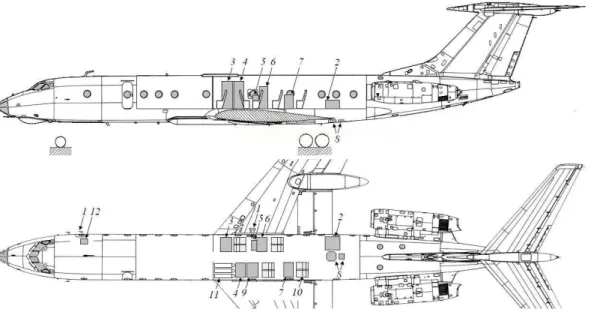
To study the vertical distribution of the climatically significant components of the tro-posphere, we used the analytical equipment (Fig. 1) installed aboard the Tu-134 OPTIK flying laboratory (Anokhin et al., 2011).
Since the primary objective of the Experiment was to study radiative characteristics of the atmosphere, below we describe the equipment used to measure atmospheric
5
admixtures being major contributors to the radiative forcing.
To study the vertical distribution of the main greenhouse gases, we used a Picarro G2301-m precision gas analyzer specially designed for in-flight measurements of car-bon dioxide, methane, and water vapor concentrations with a frequency of 1 Hz (http:// www.picarro.com/products_solutions/trace_gas_analyzers/co_co2_ch4_h2o). The
op-10
erating principle of the gas analyzer is based on the cavity ring-down spectroscopy technique, which allows determination of the spectral characteristics of gas molecules in an optical cavity. Now this device is the world best, since the precision of CO2, CH4, and H2O measurements is<200 ppb,<1.5 ppb, and<150 ppm, respectively.
The ozone concentration was measured with a Thermo Environmental Instruments
15
(TEI) Model 49C UV photometric gas analyzer modified for measurements from
air-crafts of different types (Marenco et al., 1998). The measurement precision was 1 ppb
at integration time of 4 s.
The vertical structure of the distribution of atmospheric aerosols was retrieved with the use of two types of devices. The first type is a diffusion aerosol spectrometer (DAS),
20
which allows the number distribution of nanoaerosols to be retrieved in the size range from 3 to 200 nm in 20 size intervals. The DAS consists of 8-channel mesh-type dif-fusion battery (DB) and the condensation particle counter. The principle of particle
separation by size is based on the size dependence of the diffusion coefficients of
nanoparticles. As a result, particles of different sizes passing through porous media
25
AMTD
8, 5769–5808, 2015Complex experiment on stydying the
microphysical propertires of aerosol
particles
G. G. Matvienko et al.
Title Page
Abstract Introduction
Conclusions References
Tables Figures
◭ ◮
◭ ◮
Back Close
Full Screen / Esc
Printer-friendly Version
Interactive Discussion
Discussion
P
a
per
|
Discussion
P
a
per
|
Discussion
P
a
per
|
Discussion
P
a
per
|
DB channels, the size spectrum is retrieved with the use of the algorithm developed by A. N. Ankilov and S. I. Eremenko (Eremenko and Ankilov, 1995) with regard to the
WCPC 3781 counting efficiency. Due to the use of the WCPC 3781 condensation
par-ticle counter with a response time of<2 s, the full size distribution of nanoparticles is obtained in 80 s.
5
The second type is a Grimm #1.109 laser aerosol spectrometer (Grimm Aerosol Technik GmbH and Co., Germany), which measures the aerosol particle number den-sity in 31 size intervals: 0.25, 0.28, 0.3, 0.35, 0.4, 0.45, 0.5, 0.58, 0.65, 0.7, 0.8, 1.0, 1.3, 1.6, 2, 2.5, 3, 3.5, 4, 5, 6.5, 7.5, 8.5, 10, 12.5, 15, 17.5, 20, 25, 30, and 32 µm. The operating principle of this spectrometer is based on the dependence of the scattered
10
radiation intensity on the particle size. At a known air-flow rate, the pulse repetition frequency allows the concentration of particles in air to be determined.
Thus, a combination of these two spectrometers forms an aerosol system covering the size range from 3 nm to 32 µm with a good resolution.
The temperature-wind sounding was carried out with a Vaisala DigiCORA®MW31
ra-15
diosonde (Vaisala R92SGP, http://www.vaisala.ru). The combination of this radoisonde
and a GPS correlator with DigiCORA®system provides the world highest level of
mea-surements of the atmospheric pressure (P), temperature (t), and relative air humidity
(U), as well as wind measurements.
Several types of sun photometers are used in measurements of AOD and
atmo-20
spheric column water vapor. In 2012, two devices were used:
1. SP-9 multiwave sun photometer for regular measurements of AOD in the 0.34– 2.14 µm spectral range (16 spectral channels) and atmospheric column water va-por, as well as for retrieval of aerosol microstructure parameters (Sakerin et al., 2004, 2012);
25
2. CIMEL CE 318 Sun-Sky radiometer of the AERONET global network for
mea-surements of AOD in the 0.34–1.02 µm spectral range, water vapor content W,
AMTD
8, 5769–5808, 2015Complex experiment on stydying the
microphysical propertires of aerosol
particles
G. G. Matvienko et al.
Title Page
Abstract Introduction
Conclusions References
Tables Figures
◭ ◮
◭ ◮
Back Close
Full Screen / Esc
Printer-friendly Version
Interactive Discussion
Discussion
P
a
per
|
Discussion
P
a
per
|
Discussion
P
a
per
|
Discussion
P
a
per
albedo, microstructure parameters of particles sized from 0.1 to 10 µm, and others (Holben et al., 1998; Dubovik et al., 1998, 2000; Dubovik and King, 2000).
Aerosol measurements at the stationary IAO SB RAS Aerosol Station (Kozlov et al., 1997, 2008a) are carried out with the use of a technique for studying aerosol prop-erties in local air volumes, that is, air with aerosols is pumped through optical cells
5
(flow-through measurements). The surface aerosol comes to the optical cells by ducts through air intakes installed outside the main building of IAO SB RAS at an altitude of 9 m above the surface.
The aerosol measurement system includes such devices as angle-scattering neph-elometers (Kozlov et al., 2008a; Shmargunov et al., 2008), photoelectric particle
coun-10
ters from scattered radiation (Shmargunov and Pol’kin, 2015), and aethalometers (Ko-zlov et al., 1997, 2008a), that is, devices measuring characteristics of aerosol absorp-tion. A FAN-type angular nephelometer measures the directed aerosol scattering
co-efficient at an angle of 45◦ at a wavelength of 0.51 µm, which is proportional to the
concentration of submicron aerosols (Kozlov et al., 2008b). The nephelometer allows
15
the directed scattering coefficient to be measured starting from the level of molecular
scattering ∼1 M m−1ster−1. The nephelometer has been calibrated under laboratory
conditions against the known value of molecular scattering of radiation by pure air at the pumpdown pressure in the nephelometer cell from 760 to 350 mm Hg. To measure the disperse composition of aerosol particles, a modified PKGTA photoelectric particle
20
counter (particle diameter of 0.4–10 µm) is used (Shmargunov and Pol’kin, 2015). The mass concentration of black carbon in the composition of aerosol particles is
measured with an MDA three-wave differential aethalometer developed at IAO SB
RAS (Sakerin et al., 2004). The concentration sensitivity of the aethalometer is about
10 ng m−3at 30 L of air pumped through it. The aethalometer has been calibrated
un-25
AMTD
8, 5769–5808, 2015Complex experiment on stydying the
microphysical propertires of aerosol
particles
G. G. Matvienko et al.
Title Page
Abstract Introduction
Conclusions References
Tables Figures
◭ ◮
◭ ◮
Back Close
Full Screen / Esc
Printer-friendly Version
Interactive Discussion
Discussion
P
a
per
|
Discussion
P
a
per
|
Discussion
P
a
per
|
Discussion
P
a
per
|
An aureole photometer measures the directed scattering coefficient in the angular
range 1.2–20◦and is used for estimation of the mass content of coarse particles in the
size spectrum (Shmargunov et al., 2010).
The system of active polarization nephelometry, which is also used at the Aerosol Station, includes the FAN nephelometer and devices for artificial humidification of
5
aerosol up to 90 % relative humidity of air or for heating up to 250◦C. It serves for
the measurement of aerosol hygro- and thermograms, which are used for determina-tion of the parameter of hygroscopic activity of particles and the fracdetermina-tional content of volatile compounds in aerosol. Polarization measurements with this system allow the microstructure and optical constants of submicron aerosol particles to be determined
10
through solution of the inverse problem.
Remote laser sensing of aerosol fields in the troposphere was carried out with the stationary multifrequency LOZA lidar at three laser wavelengths of 355, 532, and 1064 nm with laser pulse repetition frequency of 20 Hz and pulse length of 10 ns. The lidar system detects not only echo signals of elastic backscattering, but also signals of
15
Raman scattering by molecular nitrogen (387 and 607 nm) and water vapor (407 nm) at the same wavelengths in night time. Polarization components of backscattered radi-ation at a wavelength of 532 nm were measured in an additional channel. The multifre-quency lidar provides retrieval of high-quality information about the vertical (from the surface to the lower stratosphere) distribution of optical (scattering and extinction coeffi
-20
cients, optical depth) and microphysical (nonsphericity, phase composition, mean size spectrum of aerosol particles within the identified layer) properties of aerosol. More detailed description of the lidar and methods for optical parameters retrieve see in Samoilova et al. (2009).
For monitoring the temperature, humidity, ozone, aerosol, and clouds with a spatial
25
AMTD
8, 5769–5808, 2015Complex experiment on stydying the
microphysical propertires of aerosol
particles
G. G. Matvienko et al.
Title Page
Abstract Introduction
Conclusions References
Tables Figures
◭ ◮
◭ ◮
Back Close
Full Screen / Esc
Printer-friendly Version
Interactive Discussion
Discussion
P
a
per
|
Discussion
P
a
per
|
Discussion
P
a
per
|
Discussion
P
a
per
The sounding of MGCs from space was carried out with the MetOP-A satellite IASI (Infrared Atmospheric Sounding Interferometer) Fourier spectrometer with a spectral
resolution of 0.35–0.5 cm−1in the range 645–2760 cm−1and a spatial resolution from
25 to 100 km depending on MGC. In addition to the IASI data, the data from the
Aqua AIRS (Atmospheric Infrared Sounder) with nominal spatial resolution of∼45 km
5
and spectral resolutionλ/∆λ∼1200 in 2378 channels lying in the ranges 3.74–4.61,
6.20–8.22, and 8.80–15.40 µm were used for the same purposes. The information about satellite dish can be found on http://www.orbitalsystems.com/antenna-products/ systems/eosdb-systems.
The measurement system includes facilities for local and remote acoustic
diagnos-10
tics of the atmospheric boundary layer, namely, METEO-2 Ultrasonic Meteostations (UMSs) (Gladkikh and Makienko, 2009) and VOLNA-4 three-channel acoustic Doppler sodar, whose main operating principles and some results are described in Gladkikh et al. (1999, 2009) and Odintsov and Fedorov (2007).
Starting from January 1996, an automated spectrophotometer installed at the
15
Siberian Lidar Station (SLS) of IAO SB RAS carries out regular measurements of
atmo-spheric NO2 (nitrogen dioxide is a component of the nitrogen catalytic cycle of ozone
destruction). The spectrophotometer records the spectrum of solar radiation scattered at zenith in the wavelength range 430–450 nm in twilight periods, when the solar zenith angle varies from 83 to 96◦. The slant NO
2content along the trajectory of recorded
ra-20
diation is calculated from the deformation of the spectrum. The data on the slant NO2
content in the atmosphere are used to retrieve, through solution of the inverse problem, the vertical distribution of NO2in 10 layers each 5 km thick in the altitude range from 0 to 50 km. Then the total NO2content is calculated as a sum over all the layers.
To study fluctuation parameters of the atmosphere, a multiparameter instrument has
25
AMTD
8, 5769–5808, 2015Complex experiment on stydying the
microphysical propertires of aerosol
particles
G. G. Matvienko et al.
Title Page
Abstract Introduction
Conclusions References
Tables Figures
◭ ◮
◭ ◮
Back Close
Full Screen / Esc
Printer-friendly Version
Interactive Discussion
Discussion
P
a
per
|
Discussion
P
a
per
|
Discussion
P
a
per
|
Discussion
P
a
per
|
The instrument is a portable automatic device, comprising an acoustic meter of three wind velocity components and virtual temperature; an optical infrared meter of micro-pulsations of absolute humidity; temperature, pressure, and relative humidity sensors; and an open-type single-angle nephelometer for measuring pulsations of aerosol
scat-tering coefficient and estimating pulsations of the atmospheric aerosol concentration.
5
Measurements of dynamic and thermodynamic characteristics of turbulence are ac-companied by measurements of solar radiation; i.e. the instrument comprises sensors of incoming and outgoing solar radiation in the visible spectral range. The temperature, humidity, wind velocity, and aerosol fields are studied to different extents; the
pulsa-tions are measured by different methods and in different periods of time. Hence, the
10
data of these measurements are often incomparable. Therefore, the direct pulsation measurements are still urgent in the context of refinement of turbulence parameters. The instrument consists of three main spatially localized parts: modernized version of three-component ultrasonic anemometer-thermometer, spectroscopic meter of abso-lute humidity, and open-type nephelometer.
15
The developed measurement system allows one to retrieve the whole set of micro-physical, chemical, and optical aerosol parameters from data measured.
3 Measuring sites
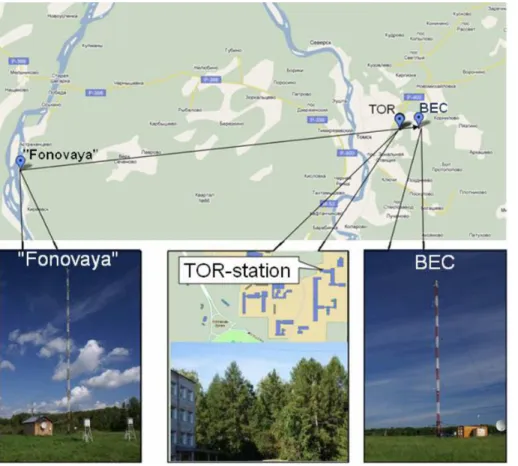
Concentrations of MGCs were routinely measured at three IAO SB RAS monitoring stations (Fig. 2): Fonovaya Observatory, TOR Station, and Basic Experimental
Com-20
plex. The Fonovaya Observatory is located 70 km to the west of Tomsk, the TOR station is situated at the northeastern end of the Tomsk Scientific Center (Akademgorodok), and BEC is located in suburbs 3 km to the east from Akademgorodok (Table 3). This arrangement of the stations (nearly in line) in the case of the west–eastern air mass transport allows us to estimate the anthropogenic contribution of Tomsk to the
forma-25
AMTD
8, 5769–5808, 2015Complex experiment on stydying the
microphysical propertires of aerosol
particles
G. G. Matvienko et al.
Title Page
Abstract Introduction
Conclusions References
Tables Figures
◭ ◮
◭ ◮
Back Close
Full Screen / Esc
Printer-friendly Version
Interactive Discussion
Discussion
P
a
per
|
Discussion
P
a
per
|
Discussion
P
a
per
|
Discussion
P
a
per
The vertical distribution of the climatically significant components of the troposphere was studied with the Tu-134 OPTIK flying laboratory.
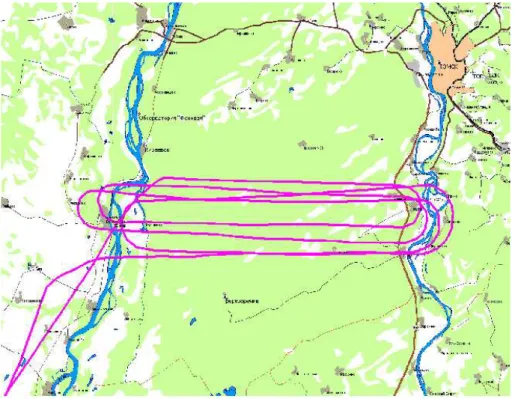
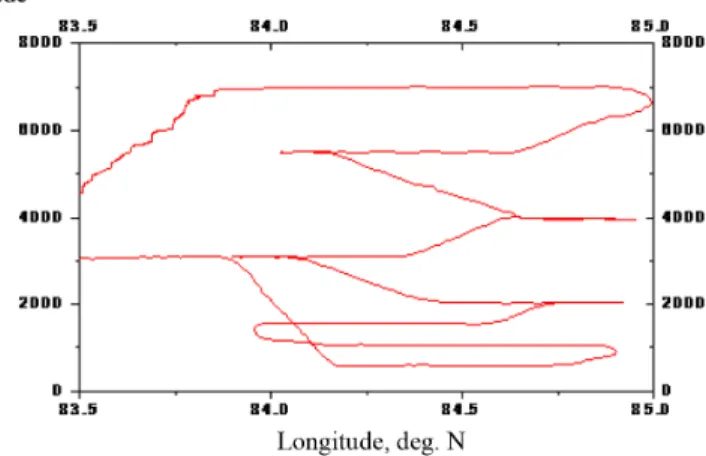
Within the Complex Aerosol Experiment, the Tu-134 OPTIK flying laboratory carried out a sounding flight over the territory of the Ob–Tom interfluve, southwest of Tomsk (on the Kozhevnikovo–Kurlek traverse), on 9 April 2013, with the use of instruments for
5
remote sounding and local control. The flight trajectory is shown in Figs. 3 and 4 below. The temperature-wind sounding was carried out with the Vaisala R92SGP ra-diosonde.
The atmospheric AOD was monitored (in particular, on 22 May 2012) at two obser-vation sites: in Tomsk (IAO SB RAS) and at the Fonovaya Observatory.
10
At the stationary Aerosol Station of IAO SB RAS located at the southeastern end of Tomsk (http://aerosol.iao.ru/?lang=en; 56.5◦N, 85.1◦E; GMT+7.00), surface aerosol parameters were monitored every hour round-the-clock. The Complex Aerosol Exper-iment on 2013 included a cycle of simultaneous two-site measurements at the IAO Aerosol Station in Tomsk and at the mobile Aerosol Station based at the Fonovaya
15
Observatory in the forest zone 70 km to the west from Tomsk. The mass concentra-tions of aerosol and black carbon were measured every hour round-the-clock at the two measuring sites.
Aerosol fields of the troposphere were sensed with the LOZA-S stationary multifre-quency lidar, continuously from 06:00 to 20:00 LT in 2013.
20
In 2013, the two-site radiative experiment was conducted in Tomsk and at the Fono-vaya Observatory. This experiment invoked the data of a MODIS multichannel spectro-radiometer installed on Terra and Aqua platforms of the EOS satellite system.
The acoustic diagnostics of the atmospheric boundary layer has been carried out with the use of local and remote facilities within the Complex Aerosol Experiment.
Lo-25
AMTD
8, 5769–5808, 2015Complex experiment on stydying the
microphysical propertires of aerosol
particles
G. G. Matvienko et al.
Title Page
Abstract Introduction
Conclusions References
Tables Figures
◭ ◮
◭ ◮
Back Close
Full Screen / Esc
Printer-friendly Version
Interactive Discussion
Discussion
P
a
per
|
Discussion
P
a
per
|
Discussion
P
a
per
|
Discussion
P
a
per
|
atmospheric pressure, and relative air humidity. The sodar operated every day from 08:00 to 21:00 LT and measured the height of the intense turbulent heat exchange layer and wind vector components in this layer (height range from 50 to 700 m).
At the IAO Siberian Lidar Station (SLS) located in Tomsk (56.5◦N, 85.0◦E), the au-tomated spectrophotometer measured the nitrogen dioxide concentration in the
atmo-5
sphere during morning and evening twilight.
Thus, the whole set of microphysical, chemical, and optical characteristics of aerosol in Southwestern Siberia was studied simultaneously during the Complex Aerosol Ex-periment (2013) with the use of the unique measurement system including ground-based, airborne, and spaceborne measurement facilities.
10
4 Results of complex aerosol experiment
The Experiment provided sun photometer measurements of AOD, acoustic sound-ing of the boundary layer, laser senssound-ing of aerosol content in the troposphere and stratosphere, measurements of the gaseous composition of the atmosphere (including greenhouse gases), and measurements of meteorological parameters of air, including
15
with the help of weather balloons.
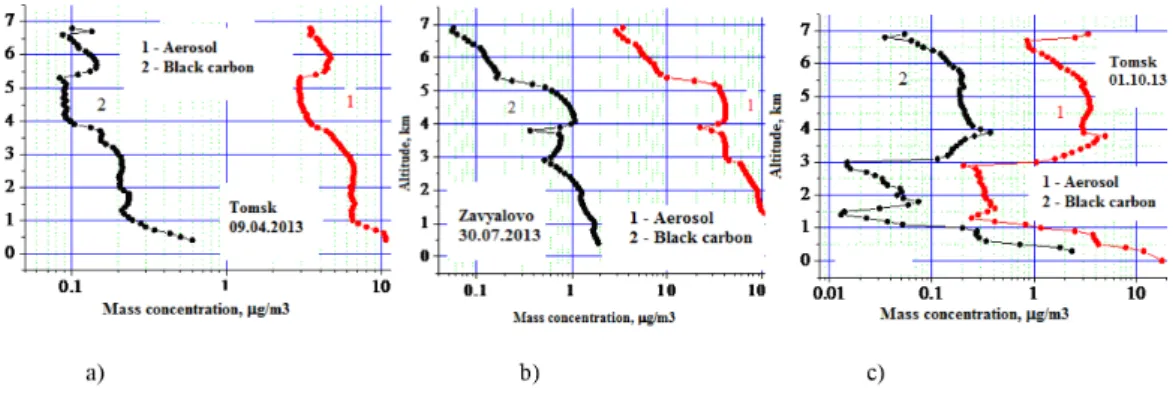
The vertical aerosol and black carbon profiles were measured onboard the aircraft on 9 April (during flights near Tomsk and Zavyalovo settlement, and in the south of Novosibirsk region), 30 July (Zavyalovo settlement), and 1 October 2013 (Tomsk and Zavyalovo settlement), as shown in Fig. 5a–c, respectively.
20
The measurement data show that aerosol and black carbon profiles are close in shape and agree with specific features of vertical variations which we have revealed earlier. Figure 5a shows the total black carbon column up to altitudes of 7 km and aerosol mass concentration at a wavelength of 0.53 µm. These results are relatively
close to springtime average values of 1.64 mg m−2 and 0.18, which we found
ear-25
mea-AMTD
8, 5769–5808, 2015Complex experiment on stydying the
microphysical propertires of aerosol
particles
G. G. Matvienko et al.
Title Page
Abstract Introduction
Conclusions References
Tables Figures
◭ ◮
◭ ◮
Back Close
Full Screen / Esc
Printer-friendly Version
Interactive Discussion
Discussion
P
a
per
|
Discussion
P
a
per
|
Discussion
P
a
per
|
Discussion
P
a
per
surements on 9 April near Tomsk were performed under the solar weather, at a cloud amount of about 3, i.e. in the low-cloud atmosphere.
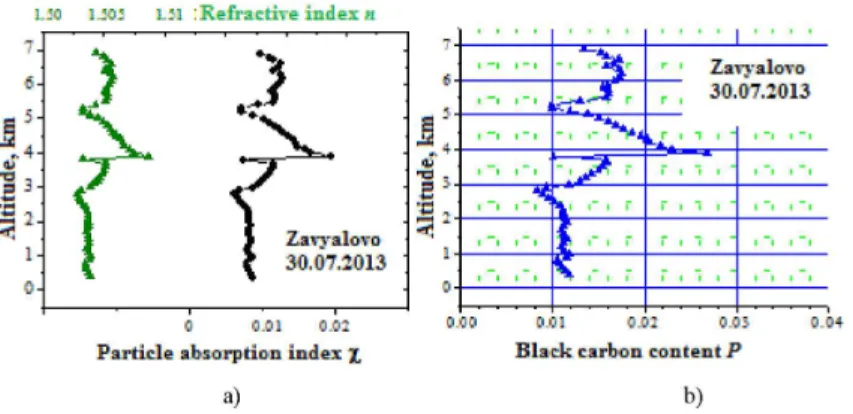
Figure 5b shows the altitude profiles of the parameters under study for the flight on 30 July 2013, in the region of Zavyalovo settlement. It is clearly seen that high aerosol and black carbon levels were observed at all altitudes in this time, primarily due to the
5
effect of forest fire smoke plumes. The aerosol concentrations in the surface air layer were higher than 100 µg m−3, and black carbon concentrations attained 2 µg m−3, a fac-tor of 3–4 higher than the mean background summertime concentrations. Thus, this flight was actually performed in the smoky atmosphere. The total black carbon column explicitly attained levels of high smoke content of the atmosphere, of about 6 mg m−2,
10
the AOD value being 1.45. Correspondingly, the smoke conditions were characterized by low particle absorption indexχ (Fig. 6a) and relative black carbon contentp <0.02 (Fig. 6b).
Figure 5c shows the altitude profiles of the aerosol parameters under study in two regions in autumn, on 1 October 2013. Analysis of meteorological conditions during
15
the flight showed that the preceding days were characterized by stable cloudy weather with rains and overcast cumulus clouds. The weather became better on the day of the
flight, sometimes the sun was seen through the gaps; however, a few layers of diffused
clouds were recorded during the flight. The presence of clouds influenced the vertical stratification of aerosol; as a consequence, the altitude profiles show the presence of
20
two-level clouds and increased altitude variations. The total black carbon column and
AOD somewhat differ from autumn average background values of 1.26 mg m−2 and
0.094, respectively.
Analysis of near-ground measurements at the LAO aerosol station showed that vari-ations in the aerosol parameters qualitatively agree with aircraft measurement results
25
anticor-AMTD
8, 5769–5808, 2015Complex experiment on stydying the
microphysical propertires of aerosol
particles
G. G. Matvienko et al.
Title Page
Abstract Introduction
Conclusions References
Tables Figures
◭ ◮
◭ ◮
Back Close
Full Screen / Esc
Printer-friendly Version
Interactive Discussion
Discussion
P
a
per
|
Discussion
P
a
per
|
Discussion
P
a
per
|
Discussion
P
a
per
|
relation with the variations in the mass concentrations of submicron aerosol and black carbon (Fig. 8).
To date, the arrays of data on aerosol number density from the TOR station and Fonovaya Observatory include over 1 900 000 and 410 000 measurements, respec-tively. The maximal concentrations, observed at both stations, were tens of thousands
5
of particles per cm3. The decade average values of the total number density ranged
from 1.3×10³to 1.2×104cm−3at the TOR station and from 1.4×10³to 5.8×103cm−3 near the Observatory. The average aerosol number density over the entire period of
observations was 4890 cm−3 (±4905 cm−3, median=3610 cm−3) at the TOR station
and 3200 cm−3(±3244 cm−3, median=2561 cm−3) at the Fonovaya Observatory.
10
The dataset accumulated allows us to classify the diurnal dynamics of aerosol num-ber density in the atmosphere of the boreal zone of Western Sinum-beria, and to obtain the statistics on frequency of nucleation surges. Nucleation per se cannot be recorded by present-day methods, because the detection limit of most condensation particle coun-ters is 2–10 nm. However, considering that formation of nucleation-mode particles is
15
associated with growth of stable clusters formed from the nucleation, surges in the nanoparticle formation henceforth will be called nucleation surges (NSs).
All days of observations were divided into three main groups: (1) nanoparticle forma-tion event; (2) uncertain type and no in situ particle formaforma-tion, i.e. when the nucleaforma-tion mode was not clearly traced throughout a day; and (3) predominately bimodal total
20
number density of particles (Aitken mode+accumulation mode).
After the particle formation events had been chosen, they were subdivided into three types. Type 1 is characterized by high concentrations of formed nucleation-mode parti-cles (Dp<16 nm) and a low concentration of coarse particles in the atmosphere. Type 1 reflects events of intense and well pronounced formation of the smallest particles,
25
accompanied by continuous growth of the particles during 7–10 h.
AMTD
8, 5769–5808, 2015Complex experiment on stydying the
microphysical propertires of aerosol
particles
G. G. Matvienko et al.
Title Page
Abstract Introduction
Conclusions References
Tables Figures
◭ ◮
◭ ◮
Back Close
Full Screen / Esc
Printer-friendly Version
Interactive Discussion
Discussion
P
a
per
|
Discussion
P
a
per
|
Discussion
P
a
per
|
Discussion
P
a
per
are rather well discernible. Despite these differences, the formation and growth rates
can be calculated for these both types at a reasonable revel of confidence.
Type 3 includes events with certain signs of new particle formation, but one of the stages is not very well discernible. These may be cases, e.g. where the process of particle formation and growth, once initiated, could then be interrupted due to effects
5
of a number of factors, such as: cloud-caused sharp decrease in the solar radiation, air mass change (frontal passage), rain, etc. Type 3 also includes cases with weak or ill-defined particle growth.
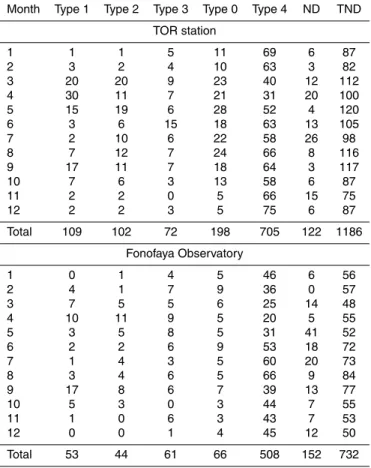
In all, 1186 days were analyzed at the TOR station from 4 March 2010 to 30 Septem-ber 2013, inclusive, and 732 days were analyzed on the territory of Fonovaya
Observa-10
tory from 13 May 2011 to 30 September 2013, thus covering 91 and 83 % of the entire period of observations, respectively. Table 4 summarizes the general information on the number of days classified at both sites. Among the total number of days (TND) when
the instrumentation operated normally, 283 events of nucleation surges (Type 1+2+3;
23.9 %), 705 days with no in situ aerosol formation (Type 4; 59.4 %), and 198 uncertain
15
cases (Type 0; 16.7 %) were identified at the TOR station.
Despite the shorter data record from the Fonovaya observatory, the total frequency of surges, per cent, is comparable with the data from the TOR station: 158 (21.6 %), 508 (69.4 %), and (9.0 %), respectively. The differences are primarily explained by dif-ferent numbers of days of the uncertain type. If they are excluded from the analysis (by
20
subtracting Type 0 days from TND), the differences between the frequencies of
non-occurrence of NS events (Type 4) decrease to 71.4 and 76.3 % at the TOR station and Fonovaya observatory, respectively. At the same time, the percentage of the NS events somewhat increases, to 28.6 % at the TOR station and 23.7 % in the region of Fonovaya observatory.
25
As an example, Fig. 9 shows some results of acoustical diagnostics of meteorological parameters of the surface air layer for each measurement cycle (10 min estimation interval):
AMTD
8, 5769–5808, 2015Complex experiment on stydying the
microphysical propertires of aerosol
particles
G. G. Matvienko et al.
Title Page
Abstract Introduction
Conclusions References
Tables Figures
◭ ◮
◭ ◮
Back Close
Full Screen / Esc
Printer-friendly Version
Interactive Discussion
Discussion
P
a
per
|
Discussion
P
a
per
|
Discussion
P
a
per
|
Discussion
P
a
per
|
– vertical turbulent heat flux;
– total turbulent kinetic energy;
– vertical turbulent momentum flux (normalized toρ);
– average wind speedVhand directionφ.
It should be noted that the database compiled contains a larger set of average
mete-5
orological parameters and turbulence characteristics than shown in Fig. 9. In addition, the available archive of raw experimental data permits us, if necessary, to calculate many other turbulence characteristics, which are absent in the database compiled.
The time variations in the spectral AOD, Ångström exponentα (which characterizes
the selectivity of spectral dependence of AOD), and water vapor total contentW of the
10
atmosphere at two measuring sites (Tomsk and Fonovaya Observatory) are shown in Fig. 10. Comparison with average annual behavior of AOD, obtained from long-term data, shows that the springtime maximum of atmospheric turbidity did no practically appear in 2013. The main turbidity peak was observed in July–August and was caused by forest fire smokes carried from northern regions (http://fires.kosmosnimki.ru/). The
15
selectivity exponentα ranged from 1 to 1.5, which is characteristic for a warm period.
The character of variations in the water vapor total content corresponds to the aver-age annual behavior, with low values in cold periods and increased values in summer months (with a maximum in August).
A series of experiments on laser sensing of the troposphere was performed from 2 to
20
11 April 2013; radiosondes were launched in some days. Figure 11 shows two exam-ples of comparison of the aerosol spatial distribution and radiosonde data. Profiles of the backscattering coefficient in units of scattering ratio, defined as the ratio of the total to molecular scattering, are shown on a color scale. The meteorological data (temper-atureT,◦C; pressure p, mm Hg, the verticalw and horizontalV wind velocity, m s−1;
25
the relative humidityr, %; and the wind directionD, degrees) were measured with the
AMTD
8, 5769–5808, 2015Complex experiment on stydying the
microphysical propertires of aerosol
particles
G. G. Matvienko et al.
Title Page
Abstract Introduction
Conclusions References
Tables Figures
◭ ◮
◭ ◮
Back Close
Full Screen / Esc
Printer-friendly Version
Interactive Discussion
Discussion
P
a
per
|
Discussion
P
a
per
|
Discussion
P
a
per
|
Discussion
P
a
per
surface. From the radiosonde data, the relative humidityr, the wind direction D, and
the equivalent-potential temperature (EPT) in degrees Kelvin are plotted.
As can be seen from Fig. 11, the meteorological situation on 3 April was character-ized by the absence of clouds and considerable surface heating at negative air temper-atures. The very dense surface air layer was involved in motion at 12:00 LT, the mixing
5
layer rapidly reached a boundary layer altitude of 1 km, the aerosol density decreases, and wavelike vertical fluxes were observed. The radiosonde profiles for 08:00 LT show a decrease in the relative humidity and a wind shift above the boundary of the boundary layer. In daytime, the relative humidity also decreased above the mixing layer, and the wind shift ceased at this same boundary. In the evening, the mixing layer descended,
10
and its boundary on the humidity profile is indiscernible.
During the project implementation in 2012–2014, we continued the lidar measure-ments of the optical parameters of stratospheric aerosol layer (SAL): the aerosol backscattering coefficient βπa, integral aerosol backscattering coefficient Bπa, and the
scattering ratioR(H), defined as the ratio of the sum of aerosol and molecular
backscat-15
tering coefficients to the latter. Figure 12 shows the integral aerosol backscattering
coefficient measured from 1986 to 2014. The arrows show the explosive eruptions
of volcanoes, after which increased aerosol content was recorded in the stratosphere over Tomsk. These data are in good agreement with data from other sites (Ridley et al., 2014).
20
The comparison of numerical calculation results and values of downward solar radi-ation fluxes on the Earth’s surface measured in the clear-sky atmosphere during sum-mer periods of 2010–2012 in a background region of boreal zone of Siberia shows that
relative differences between the model and experimental values of the direct and total
radiation, on the average, do not exceed 1 and 3 %, respectively, when instrumental
er-25
rors and uncertainties of atmospheric parameters are considered. It is also shown that the radiative cooling rates have a local maximum of about 3.5 K day−1 at an altitude of about 3 km in summer. The cooling rates are much lower in winter because of a sharp
AMTD
8, 5769–5808, 2015Complex experiment on stydying the
microphysical propertires of aerosol
particles
G. G. Matvienko et al.
Title Page
Abstract Introduction
Conclusions References
Tables Figures
◭ ◮
◭ ◮
Back Close
Full Screen / Esc
Printer-friendly Version
Interactive Discussion
Discussion
P
a
per
|
Discussion
P
a
per
|
Discussion
P
a
per
|
Discussion
P
a
per
|
observed near the Earth’s surface (0–0.5 km) and are caused by high absorptivity of aerosol particles in this altitude range.
The comparison of solar fluxes shows that their differences are mostly smaller or
comparable with the uncertainty caused by errors in input parameters and
measure-ments. The analysis also shows that the average differences between empirical data
5
and model calculations are close to results obtained by other authors in other regions (Kato et al., 1997; Henzing et al., 2004; Michalsky et al., 2006; Nowak et al., 2008; Wang et al., 2009; Halthore et al., 1998, 2004; Plakhina et al., 1998; Chubarova et al., 1999). It is important that our results were obtained under the conditions of high and moderate atmospheric transmittance, where the optical depth, scattering phase
func-10
tion, and aerosol single scattering albedo errors increase significantly. This witnesses that models and methods used for retrieve of the optical properties of aerosol provide for generally adequate description of the aerosol radiative effects with accounting for climate conditions of Western Siberia.
5 Conclusions
15
The unique measurement system developed allowed simultaneous measurements of microphysical, chemical, and optical properties of aerosol particles in the surface air
layer and free atmosphere with the use of different ground-based, airborne, and
space-borne facilities in order to draw a complete pattern of the composition and state of the atmosphere on the territory of Southwestern Siberia
20
The Complex Aerosol Experiment on measurement of different atmospheric
param-eters in the Siberian region in 2013 has become a first step on the way of joining the
efforts of different research groups aimed at obtaining the as complete as possible
information about the state of the atmosphere under conditions of changing climate. Despite the short duration of the Experiment, it has shown the potential capabilities
25
AMTD
8, 5769–5808, 2015Complex experiment on stydying the
microphysical propertires of aerosol
particles
G. G. Matvienko et al.
Title Page
Abstract Introduction
Conclusions References
Tables Figures
◭ ◮
◭ ◮
Back Close
Full Screen / Esc
Printer-friendly Version
Interactive Discussion
Discussion
P
a
per
|
Discussion
P
a
per
|
Discussion
P
a
per
|
Discussion
P
a
per
capabilities of many ground-based and spaceborne instruments for active and passive sensing of the atmosphere are strongly limited by the presence of dense clouds. Ac-cording to the long-term observations, only 38 cloudless days a year are observed on the average in Tomsk. In this respect, the air-borne sensing has an advantage, but the use of the flying laboratory remains limited due to the high cost. Thus, continuous
5
combined observations seem now to be possible only in the atmospheric boundary layer.
Nevertheless, the data obtained during the Complex Aerosol Experiment are of great value both for validation, correction, and calibration of satellite measurements and for validation and improvement of climatic models.
10
Acknowledgements. This work was supported in part the Russian Science Foundation (Agree-ment no. 14-27-00022 – support for aerosol laser sensing), the Russian Foundation for Basic Research (Grants 13-05-98074, 13-05-00096, 14-05-00526, 14-05-00590), and the President of the Russian Federation (Grant NS-4714.2014.5 in support of leading scientific schools).
References
15
Anokhin, G. G., Antokhin, P. N., Arshinov, M.Yu., Barsuk, V. E., Belan, B. D., Belan, S. B., Davy-dov, D. K., Ivlev, G. A., Kozlov, A. V., Kozlov, V. S., Morozov, M. V., Panchenko, M. V., Pen-ner, I. E., Pestunov, D. A., Sikov, G. P., Simonenkov, D. V., Sinitsyn, D. S., Tolmachev, G. N., Filipov, D. V., Fofonov, A. V., Chernov, D. G., Shamanaev, V. S., and Shmargunov, V. P.: OPTIK Tu-134 aircraft laboratory, Atmos. Ocean. Opt., 24, 805–816, 2011. 5774
20
Arshinov, M.Yu., Belan, B. D., Davydov, D. K., Ivlev, G. A., Kozlov, A. V., Pestunov, D. A., Pokrovskii, E. V., Tolmachev, G. N., and Fofonov, A. V.: Sites for monitoring of greenhouse gases and gases oxidizing the atmosphere, Atmos. Ocean. Opt., 20, 45–53, 2007. 5773 Chubarova, N. E., Rublev, A. N., Trotsenko, A. N., and Trembach, V. V.: Comparisons between
modeled and measured surface shortwave irradiances under clear sky conditions, Izv.
At-25
mos. Ocean. Phys., 35, 201–216, 1999. 5787
AMTD
8, 5769–5808, 2015Complex experiment on stydying the
microphysical propertires of aerosol
particles
G. G. Matvienko et al.
Title Page
Abstract Introduction
Conclusions References
Tables Figures
◭ ◮
◭ ◮
Back Close
Full Screen / Esc
Printer-friendly Version
Interactive Discussion
Discussion
P
a
per
|
Discussion
P
a
per
|
Discussion
P
a
per
|
Discussion
P
a
per
|
Dubovik, O., Holben, B., Kaufman, Y., Yamasoe, M., Smirnov, A., Tanre, D., and Slutsker, I.: Single-scattering albedo of smoke retrieved from the sky radiance and solar transmittance measured from ground, J. Geophys. Res., 103, 31903–31923, 1998. 5776
Dubovik, O., Smirnov, A., Holben, B., King, M., Kaufman, Y., Eck, T., and Slutsker, I.: Accu-racy assessments of aerosol optical properties retrieved from Aerosol Robostic Network
5
(AERONET) Sun and sky radiance measurements, J. Geophys. Res., 105, 9791–9806, 2000. 5776
Eremenko, S. and Ankilov, A.: Conversion of the diffusion battery data to particle size distri-bution: multiple Solutions Averaging algorithm (MSA), J. Aerosol Sci., 26, 749–750, 1995. 5775
10
Gladkikh, V. A. and Makienko, A. E.: Digital ultrasonic meteostation, Pribory, 109, 21–25, 2009. 5778
Gladkikh, V. A., Makienko, A. E., and Fedorov, V. A.: Volna-3 Doppler sodar, Atmos. Ocean. Opt., 12, 422–429, 1999. 5778
Gladkikh, V. A., Kamardin, A. P., and Nevzorova, I. V.: Determination of internal mixing layer
15
height from “Volna” sodar measurements, Atmos. Ocean. Opt., 22, 1154–1159, 2009. 5778 Halthore, R. N., Nemesure, S., Schwartz, S. E., Emre, D. G., Berk, A., Dutton, E. G., and
Bergin, M. H.: Models overestimate diffuse clear-sky irradiance: a case for excess atmo-spheric absorption, Geophys. Res. Lett., 25, 3591–3594, 1998. 5787
Halthore, R. N., Miller, M. A., Ogren, J. A., Sheridan, P. J., Slater, D. W., and Stoffel, T.:
Fur-20
ther developments in closure experiments for diffuse irradiance under cloud-free skies at a continental site, Geophys. Res. Lett., 31, L07111, doi:10.1029/2003GL019102, 2004. 5787 Henzing, J. S., Knap, W. H., Stammes, P., Apituley, A., Bergwerff, J. B., Swart, D. P. J.,
Kos, G. P. A., and ten Brink, H. M.: Effect of aerosols on the downward shortwave irradi-ances at the surface: measurements vs. calculations with MODTRAN4.1, J. Geophys. Res.,
25
109, D14204, doi:10.1029/2003JD004142, 2004. 5787
Holben, B. N., Eck, T. F., Slutsker, I., Tanre, D., Buis, J. P., Setzer, A., Vermote, E., Reagan, J. A., Kaufman, Y. J., Nakadjima, T., Lavenu, F., Jankowiak, I., and Smirnov, A.: AERONET – a federated instrument network and data archive for aerosol characterization, Remote Sens. Environ., 66, 1–16, 1998. 5776
30
AMTD
8, 5769–5808, 2015Complex experiment on stydying the
microphysical propertires of aerosol
particles
G. G. Matvienko et al.
Title Page
Abstract Introduction
Conclusions References
Tables Figures
◭ ◮
◭ ◮
Back Close
Full Screen / Esc
Printer-friendly Version
Interactive Discussion
Discussion
P
a
per
|
Discussion
P
a
per
|
Discussion
P
a
per
|
Discussion
P
a
per
Kozlov, V. S., Panchenko, M. V., Tumakov, A. G., Shmargunov, V. P., and Yausheva, E. P.: Some peculiarities of the mutual variability of the content of soot and submicron aerosol in the near-ground air layer, J. Aerosol Sci., 28, S231–S232, 1997. 5776
Kozlov, V. S., Panchenko, M. V., and Yausheva, E. P.: Mass fraction of Black Carbon in sub-micron aerosol as an indicator of influence of smokes from remote forest fires in Siberia,
5
Atmos. Environ., 42, 2611–2620, doi:10.1016/j.atmosenv.2007.07.036, 2008a. 5776 Kozlov, V. S., Shmargunov, V. P., and Pol’kin, V. V.: Spectrophotometers for investigation of
characteristics of radiation absorption by aerosol particles, Prib. Tekh. Eksp., 5, 155–157, 2008b. 5776
Marenco, A., Thouret, V., Nedelec, P., Smit, H., Helten, M., Kley, D., Karcher, F., Simon, P., Law,
10
K., Pyle, J., Poschmann, G., Von Wrede, R., Hume, C., and Cook, T.: Measurement of ozone and water vapor by Airbus in-service aircraft: the MOZAIC airborne program, an overview, J. Geophys. Res.-Atmos., 103, 25631–25642, 1998. 5774
Michalsky, J. J., Anderson, G. P., Barnard, J., Delamere, J., Gueymard, C., Kato, S., Kiedron, P., McComiskey, A., and Ricchiazzi, P.: Shortwave radiative closure studies for clear skies
dur-15
ing the Atmospheric Radiation Measurement 2003 Aerosol Intensive Observation Period, J. Geophys. Res., 111, D14S90, doi:10.1029/2005JD006341 2006. 5787
Monnin, E., Indermuhle, A., Dallenbach, A., Fluckinger, J., Stauffer, B., Stocker, T. F., Ray-naud, D., and Barnola, J.-M.: Atmospheric CO2concentrations over the last glacial
termina-tion, Science, 291, 112–114, 2001. 5772
20
Nowak, D., Vuilleumier, L., Long, C. N., and Ohmura, A.: Solar irradiance computations com-pared with observations at the Baseline Surface Radiation Network Payerne site, J. Geophys. Res., 2008, 113, D14206, doi:10.1029/2007JD009441, 2008. 5787
Odintsov, S. L. and Fedorov, V. A.: Investigation of wind velocity variations on mesometeoro-logical scale from sodar observations, Atmos. Ocean. Opt., 20, 900–906, 2007. 5778
25
Plakhina, I. N., Repina, I. A., and Gorchakova, I. A.: Comparison between measured and cal-culated radiation fluxes reaching the Earth’s surface, Izv. Atmos. Ocean. Phys., 34, 112–119, 1998. 5787
Ridley, D. A., Solomon, S., Barnes, J. E., Burlakov, V. D., Deshler, T., Dolgii, S. I., Her-ber, A. B., Nagai, T., Neely III, R. R., Nevzorov, A. V., Ritter, C., Sakai, T., Santer, B. D.,
30
AMTD
8, 5769–5808, 2015Complex experiment on stydying the
microphysical propertires of aerosol
particles
G. G. Matvienko et al.
Title Page
Abstract Introduction
Conclusions References
Tables Figures
◭ ◮
◭ ◮
Back Close
Full Screen / Esc
Printer-friendly Version
Interactive Discussion
Discussion
P
a
per
|
Discussion
P
a
per
|
Discussion
P
a
per
|
Discussion
P
a
per
|
Sakerin, S. M., Kabanov, D. M., Rostov, A. P., Turchinovich, S. A., Turchinovich, and Yu, S.: Sys-tem for the network monitoring of the atmospheric constituents active in radiative processes, Part 1. Sun photometers, Atmos. Ocean. Opt., 17, 314–320, 2004. 5775, 5776
Sakerin, S. M., Kabanov, D. M., Rostov, A. P., Turchinovich, S. A., and Knyazev, V. V.: Sun pho-tometers for measuring the spectral atmospheric transparency under stationary and mobile
5
conditions, Atmos. Ocean. Opt., 25, 1112–1117, 2012. 5775
Samoilova, S. V., Balin, Yu. S., Kokhanenko, G. P., and Penner, I. E.: Investigation of the tro-pospheric aerosol layer vertical distribution from the data of sensing with a multifrequency Raman lidar, Part 1. Methods for the reconstruction of optical parameters, Atmos. Ocean. Opt., 22, 344–357, 2009. 5777
10
Shmargunov, V. P. and Pol’kin, V. V.: AZ-5 based aerosol counter, Prib. Tekh. Eksp., 2, 165–166, 2007. 5776
Shmargunov, V. P., Kozlov, V. S., Tumakov, A. G., Pol’kin, V. V., and Panchenko, M. V.: FAN-based automated aerosol nephelometer, Prib. Tekh. Eksp., 5, 165–167, 2008. 5776
Shmargunov, V. P., Pol’kin, V. V., Tumakov, A. G., Panchenko, M. V., and Pol’kin, V. V.:
Closed-15
volume aureole photometer, Prib. Tekh. Eksp., 6, 155–157, 2010. 5777
Solomon, S., Qin, D., Manning, M., Chen, Z., Marquis, M., Averyt, K. B., Tignor, M., and Miller, H. L.: Climate Change 2007: The Physical Science Basis, Contribution of Work-ing Group I to the Fourth Assessment Report of the Intergovernmental Panel on Climate Change, IPCC AR4 WG1, Cambridge University Press, 2007. 5771
20
AMTD
8, 5769–5808, 2015Complex experiment on stydying the
microphysical propertires of aerosol
particles
G. G. Matvienko et al.
Title Page Abstract Introduction Conclusions References Tables Figures ◭ ◮ ◭ ◮ Back Close
Full Screen / Esc
Printer-friendly Version Interactive Discussion Discussion P a per | Discussion P a per | Discussion P a per | Discussion P a per
Table 1.Composition and purpose of individual elements of the measurement system.
No. Element Produced by Measurements since
Purpose URL
1 TOR station IAO SB RAS, RUSSIA
1992 Monitoring of meteorological pa-rameters, gas and aerosol compo-sition of air, and solar radiation in the surface layer
http://lop.iao.ru/eng/index.php/about-tor-station/aero-tor
2 Basic Experimen-tal Complex
IAO SB RAS, RUSSIA
1986 Monitoring of meteorological pa-rameters, gas and aerosol compo-sition of air, and solar radiation in the surface layer
http://lop.iao.ru/eng/index.php/about-bec/aerosols
3 Fonovaya (Back-ground) Observa-tory
IAO SB RAS, RUSSIA
1978 Monitoring of meteorological pa-rameters, gas and aerosol compo-sition of air, and solar radiation in the surface layer
http://lop.iao.ru/eng/index.php/about-fonovyi/aerosols-2
4 Ty-134 OPTIK fly-ing laboratory
IAO SB RAS, RUSSIA
1988 Measurement of meteorological parameters, gas and aerosol com-position of air, optical characteris-tics of air
http://www.iao.ru/en/resources/equip/plane/
5 DigiCORA 3 system for radio sounding of the atmosphere
Vaisala Oy, Finland
2006 Determination of vertical distribu-tion of meteorological parameters by contact tools
http://www.vaisala.fi/Vaisala_Documents/Brochures_and_ Datasheets/MW31-for-MET-Datasheet-B210361EN-E-LOW.pdf
6 SP-9 sun pho-tometer
IAO SB RAS, RUSSIA
2010 Measurement of aerosol optical depth and water column of the at-mosphere
http://link.springer.com/article/10.1134/S102485601304012X
7 Aerosol Station IAO SB RAS, RUSSIA
1996 Measurements of characteristics of surface aerosol
http://aerosol.iao.ru/?lang=en
8 LOZA Lidar IAO SB RAS, RUSSIA
1992 Determination of aerosol profile at a distance of 1–10 km in any direc-tion of the hemisphere
http://www.iao.ru/en/resources/equip/lidars
9 2.4 XLB Direct Broadcast Recep-tion System
Orbital Systems, USA
2011 Reception of satellite data from AVHRR, MODIS, and other opto-electronic devices
http://www.orbitalsystems.com/antenna-products/systems/ eosdb-systems/
10 METEO-2 Ultra-sonic Meteosta-tion
IAO SB RAS, RUSSIA
2007 Measurement of mean values and characteristics of wind turbulence and air temperature
http://www.iao.ru/en/resources/equip/dev/meteo2
11 VOLNA Sodar IAO SB RAS, RUSSIA
2006 Measurement of vertical profiles of wind vector components in the atmospheric boundary layer
http://www.iao.ru/en/resources/equip/dev/sodar
12 Siberian Lidar Station
IAO SB RAS, RUSSIA
1988 High-altitude sensing of the atmo-sphere
AMTD
8, 5769–5808, 2015Complex experiment on stydying the
microphysical propertires of aerosol
particles
G. G. Matvienko et al.
Title Page Abstract Introduction Conclusions References Tables Figures ◭ ◮ ◭ ◮ Back Close
Full Screen / Esc
Printer-friendly Version Interactive Discussion Discussion P a per | Discussion P a per | Discussion P a per | Discussion P a per |
Table 2.Measurement facilities and their characteristics.
TOR station
Unit Device/sensor Parameter Range Error Time constant
Weather station HIH-3602-C HIH-3602-C M-63 M-63 MPX4115AP
t,◦C U,% dd, deg
V, m s−1
P, hPa
−40. . .+85 0. . .100 0. . . 360 1.2. . . 40 150. . . 1150
±0.1◦C
±2 %
±10◦
±(0.5+0.05V)
±1.5 1 s 1 s 1 s 1 s 0.001 s Gas analyzer G2301-m CO2, ppm
CH4, ppm
H2O, ppm
0. . . 1000 0. . . 20 0. . . 70 000
<0.2 ppm
<0.0015 ppm
<150 ppm 1 s 1 s 1 s 3.02-Π O3, µg m−
3 0. . .500
±20 % 1 s P-310 NO/NO2, µg m−
3
0. . .1000 ±25 % 160 s K-100 CO, mg m−3
0. . .50 ±20 % 1 s API 100E SO2, ppm 0. . .20 ±0.5 % 20 s
Brewer 049 TO, DU – ±1 % 120 s
Aerosol system GRIMM #1.109 Dp, µm (31
chan-nels)
N, cm−3
0.25. . .32 0. . .2000
–
±3 %
6 s
Diffusion aerosol spec-trometer
Dp, nm (20
chan-nels)
N, cm−3
3. . .200 0. . .500 000
–
±10 %
80 s
Air ions Sapfir-3M N, cm−3
0. . .2 500 000 ±5 % 4 s Radiation unit M-115 λ, µm
Q, W m−2 0.3
. . .2.4 0. . .1500
±10 % <40 s
YES UVB-1 λ, nm
I, W m−2 280. . . 320
0. . . 2.5 –
<5 %
0.1 s
Brewer 049 λ, nm
I, W m−2 290. . . 325– –– 265 s
Gamma back-ground
IRF γ-background, µR/h 1. . . 1000 30 % 1 s
BEC
Unit Device/sensor Parameter Range Error Time constant
Weather station HIH-3602-C HIH-3602-C M-63 M-63 MPX4115AP
t,◦C U,% dd, deg
V, m s−1
P, hPa
−40. . .+85 0. . . 100 0. . . 360 1.2. . . 40 150. . . 1150
±0.1◦C
±2 %
±10◦
±(0.5+0.05V)
±1.5 1 s 1 s 1 s 1 s 0.001 s Gas analyzer LI-820 CO2, ppm 0. . . 1000 <0.2* ppm 1 s
3.02-Π O3, µg m− 3
0. . .500 ±20 % 1 s API 200E NO/NO2, ppm 0. . .20 ±0.5 % 20 s K-100 CO, mg m−3
0. . .50 ±20 % 1 s ME 9850B SO2, ppm 0. . .20 ±1 % <20 s
HCNM 2000G CH4andΣCH, ppm 0. . . 10 0.1 120 s
Aerosol system GRIMM #1.108 Dp, µm (15
chan-nels)
N, cm−3
0.3. . .20 0. . .2000
–
±3 %
AMTD
8, 5769–5808, 2015Complex experiment on stydying the
microphysical propertires of aerosol
particles
G. G. Matvienko et al.
Title Page Abstract Introduction Conclusions References Tables Figures ◭ ◮ ◭ ◮ Back Close
Full Screen / Esc
Printer-friendly Version Interactive Discussion Discussion P a per | Discussion P a per | Discussion P a per | Discussion P a per
Table 2.Continued.
Fonovaya Observatory
Unit Device/sensor Parameter Range Error Time constant
Weather station HIH-3602-C HIH-3602-C M-63 M-63 MPX4115AP
t,◦C U,% dd, deg
V, m s−1
P, hPa
−40. . .+85 0. . . 100 0. . . 360 1.2. . . 40 150. . . 1150
±0.1◦C
±2 %
±10◦
±(0.5+0.05V)
±1.5 1 s 1 s 1 s 1 s 0.001 s Gas analyzer FGGA
Model 907-0010
CO2, ppm
CH4, ppm
H2O, ppm
20. . . 10 000 0.005. . . 50 150. . . 70 000
0.2 ppm 0.001 ppm 100 ppm
1 s
LI-840 CO2, ppm 0. . . 1000 <0.2* ppm 1 s
3.02-P O3, µg m−3 0. . .500 ±20 % 1 s P-310 NO/NO2, µg m−3 0. . .1000 ±25 % 160 s K-100 CO, mg m−3 0. . .50
±20 % 1 s C-310 SO2, mg m−
3 0. . .2
±25 % 142 s Aerosol system GRIMM #1.108 Dp, µm (15
chan-nels)
N, cm−3
0.3. . .20 0. . .2000
–
±3 %
6 s
Diffusion aerosol spec-trometer
Dp, nm (20
chan-nels)
N, cm−3
3. . .200 0. . .1 000 000
–
±10 %
160 s
Air ions Sapfir-3M N, cm−3 0. . .2 500 000
AMTD
8, 5769–5808, 2015Complex experiment on stydying the
microphysical propertires of aerosol
particles
G. G. Matvienko et al.
Title Page
Abstract Introduction
Conclusions References
Tables Figures
◭ ◮
◭ ◮
Back Close
Full Screen / Esc
Printer-friendly Version
Interactive Discussion
Discussion
P
a
per
|
Discussion
P
a
per
|
Discussion
P
a
per
|
Discussion
P
a
per
|
Table 3.Coordinates of the stations.
Station Latitude Longitude Altitude above mean sea level TOR 56◦28′41′′ 85◦03′15′′ 133
Fonovaya1 56◦25′07′′ 84◦04′27′′ 80
AMTD
8, 5769–5808, 2015Complex experiment on stydying the
microphysical propertires of aerosol
particles
G. G. Matvienko et al.
Title Page
Abstract Introduction
Conclusions References
Tables Figures
◭ ◮
◭ ◮
Back Close
Full Screen / Esc
Printer-friendly Version
Interactive Discussion
Discussion
P
a
per
|
Discussion
P
a
per
|
Discussion
P
a
per
|
Discussion
P
a
per
Table 4.Total number of days when nanoparticles formed in situ (Types 1, 2, and 3), type was
uncertain (Type 0), and no nucleation (Type 4) ) was observed over the entire measurement period. ND means no data available, i.e. days when the instrumentation did not work for any reasons; TND means the total number of days analyzed.
Month Type 1 Type 2 Type 3 Type 0 Type 4 ND TND
TOR station
1 1 1 5 11 69 6 87
2 3 2 4 10 63 3 82
3 20 20 9 23 40 12 112
4 30 11 7 21 31 20 100
5 15 19 6 28 52 4 120
6 3 6 15 18 63 13 105
7 2 10 6 22 58 26 98
8 7 12 7 24 66 8 116
9 17 11 7 18 64 3 117
10 7 6 3 13 58 6 87
11 2 2 0 5 66 15 75
12 2 2 3 5 75 6 87
Total 109 102 72 198 705 122 1186
Fonofaya Observatory
1 0 1 4 5 46 6 56
2 4 1 7 9 36 0 57
3 7 5 5 6 25 14 48
4 10 11 9 5 20 5 55
5 3 5 8 5 31 41 52
6 2 2 6 9 53 18 72
7 1 4 3 5 60 20 73
8 3 4 6 5 66 9 84
9 17 8 6 7 39 13 77
10 5 3 0 3 44 7 55
11 1 0 6 3 43 7 53
12 0 0 1 4 45 12 50