www.atmos-meas-tech.net/3/1333/2010/ doi:10.5194/amt-3-1333-2010
© Author(s) 2010. CC Attribution 3.0 License.
Measurement
Techniques
Retrieval of aerosol optical depth in vicinity of broken clouds
from reflectance ratios: case study
E. Kassianov1, M. Ovchinnikov1, L. K. Berg1, S. A. McFarlane1, C. Flynn1, R. Ferrare2, C. Hostetler2, and M. Alexandrov3
1Pacific Northwest National Laboratory, Richland, Washington, 99352, USA 2NASA Langley Research Center, Hampton, Virginia, 23681, USA
3NASA Goddard Institute for Space Studies, New York, 10025, USA
Received: 2 February 2010 – Published in Atmos. Meas. Tech. Discuss.: 21 April 2010 Revised: 14 September 2010 – Accepted: 18 September 2010 – Published: 6 October 2010
Abstract. A recently developed reflectance ratio (RR) method for the retrieval of aerosol optical depth (AOD) is evaluated using extensive airborne and ground-based data sets collected during the Cloud and Land Surface Interac-tion Campaign (CLASIC) and the Cumulus Humilis Aerosol Processing Study (CHAPS), which took place in June 2007 over the US Department of Energy (DOE) Atmospheric Ra-diation Measurement (ARM) Southern Great Plains site. A detailed case study is performed for a field of single-layer shallow cumuli observed on 12 June 2007. The RR method is applied to retrieve the spectral values of AOD from the reflectance ratios measured by the MODIS Airborne Simu-lator (MAS) for two pairs of wavelengths (660 and 470 nm, 870 and 470 nm) collected at a spatial resolution of 0.05 km. The retrieval is compared with an independent AOD estimate from three ground-based Multi-filter Rotating Shadowband Radiometers (MFRSRs). The interpolation algorithm that is used to project MFRSR point measurements onto the air-craft flight tracks is tested using AOD derived from NASA Langley High Spectral Resolution Lidar (HSRL). The RR AOD estimates are in a good agreement (within 5%) with the MFRSR-derived AOD values for the 660-nm wavelength. The AODs obtained from MAS reflectance ratios overesti-mate those derived from MFRSR measurements by 15–30% for the 470-nm wavelength and underestimate the 870-nm AOD by the same amount.
Correspondence to:E. Kassianov ([email protected])
1 Introduction
Potential effects of aerosol on clouds and precipitation (termed indirect aerosol effects) and consequently their ef-fects on climate were first suggested several decades ago (Warner, 1968; Twomey, 1977; Albrecht, 1989). However, our understanding of complex aerosol-cloud-precipitation in-teractions remains far from complete. Atmospheric aerosols can cause a range of effects (Small et al., 2009; Stevens and Feingold, 2009 and references therein) such as (1) in-creasing albedo due to changes in the cloud droplet con-centration and enhancing reflection of solar radiation back into space and (2) altering precipitation and extending life-time of clouds. Moreover, aerosols can modulate the ra-diative energy balance of the atmosphere and reduce the amount of solar radiation reaching the surface by absorbing and reflecting sunlight, also called direct radiative forcing. These and other aerosol effects depend strongly on aerosol loading, which is typically characterized by aerosol optical depth (AOD)τa. Since aerosols can be transported over long
distances and aerosol properties vary geographically, their global distribution is particularly essential. Current space borne sensors, such as the MODerate-Resolution Imaging Spectroradiometer (MODIS) and Multiangle Imaging Spec-troradiometer (MISR), enable measurements ofτaand other
aerosol properties on both regional and global scales, al-though typically with coarse resolution and limited accu-racy, especially over land (e.g., Mishchenko et al., 2009; Kokhanovsky and de Leeuw, 2009).
Major uncertainties in the satellite-derivedτa are
V´arnai and Marshak, 2009). The cloud contamination ef-fect comes from partly cloudy pixels which can be misclassi-fied as cloud-free. This effect is more pronounced for coarse resolution satellite observations performed over regions con-taining small clouds. For example, over the tropical western Atlantic Ocean, the population of misclassified partly-cloudy 1.1-km MISR pixels is found to be 12% and the correspond-ing cumulus-induced AOD increase is about 20% (Zhao et al., 2009). The cloud adjacency effect relates to enhancement (near illuminated cloud sides) and reduction (near shadowy cloud sides) in the reflectanceR of cloud-free columns as a result of sunlight scattering by clouds adjacent to the pixel of interest. Since clouds have complex three-dimensional (3-D) geometry, a critical assessment of the cloud-induced en-hancement/reduction can be obtained by using 3-D radiative transfer calculations for observed or simulated cloud fields (e.g., Cahalan et al., 2001; Nikolaeva et al., 2005; Wen et al., 2006, 2007; Yang and Di Girolamo, 2008). The evidence of a large impact on the retrieved AOD due to the cloud adja-cency effect (e.g., Wen et al., 2006, 2007) has led to the de-velopment of techniques to address problems associated with cloud-induced enhancement. These problems may be ad-dressed by using three different but overlapping approaches. The first approach includes selection of clear pixels lo-cated far away from clouds/shadows, where the 3-D radia-tive effects of clouds are relaradia-tively small (e.g., Wen et al., 2006, 2007). Statistical analysis of the two-dimensional (2-D) horizontal distribution of visible reflectance provides a population of appropriate clear pixels as a function of the nearest cloud distance (d), which determines the range of a completely clear area from a clear pixel of interest and is specified as the distance from the clear pixel to the nearest cloudy pixel (Wen et al., 2006). This population decreases rapidly withd and the rate of decrease is a function of both the cloud fraction (CF) and solar zenith angle (SZA). For ex-ample, for a cloud field with CF∼0.5 and SZA∼30 degrees, the clear pixel population is about 5% and 1% ford >2 km andd >3 km, respectively (Wen et al., 2007). Therefore, the existing one-dimensional (1-D) operational satellite re-trievals of AOD can be successfully applied for a quite lim-ited number of remote (e.g.,d >2 km) clear pixels. The mea-sured “remote” aerosol properties may differ substantially from their “near-cloud” counterparts (Su et al., 2008; Tackett and Di Girolamo, 2009; Twohy et al., 2009).
The second approach parameterizes the 3-D radiative ef-fects of clouds on the AOD retrievals. Marshak et al. (2008) proposed such a parameterization based on a simple two-layer model of the atmosphere with broken clouds in the lower layer and only Rayleigh scatterers in the upper layer over dark surface. This parameterization requires several cloud parameters, such as CF, domain-averaged cloud op-tical depth (COD) and the ratio of cloud thickness to cloud horizontal size. The first two parameters (CF and COD) can be obtained from satellite observations, such as the MODIS Cloud Product (MOD06). Since atmospheric aerosols are not
included, the parameterization assumes that only molecular scattering is responsible for the cloud-induced enhancement of reflectance near clouds. A larger increase of reflectance at shorter wavelengths is typically referred to as “bluing” of aerosols near cloud edges (e.g., Wen et al., 2008), while a larger increase of reflectance at longer wavelengths is re-ferred to as “reddening” (Redemann et al., 2009).
The third approach attempts to minimize the 3D radiative effects of clouds by using multi-spectral observations of re-flectance. Kassianov and Ovtchinnikov (2008) proposed to exploit reflectance ratios, which are less sensitive to the 3-D effects of clouds than reflectances themselves. As a result, this method, named the reflectance ratio (RR) method, pro-vides an effective way to reduce substantially the impact of the 3-D effects on the retrieved AOD. To evaluate the poten-tial of the RR method, Kassianov et al. (2009) conducted a sensitivity study and illustrated that it has the ability to de-tect both “remote” and “nearby” clear pixels appropriate for the RR-based AOD retrievals. Such detection increases the number of appropriate pixels and does not require the statis-tical analysis of the 2D horizontal distribution of reflectance. Also, the sensitivity study suggested that the RR-based de-tection of clear pixels and the accuracy of AOD retrievals depend only weakly on the domain-averaged COD.
In this paper, we further evaluate the RR method by using integrated aircraft and ground-based data sets collected dur-ing the US Department of Energy (DOE) sponsored Cloud and Land Surface Interaction Campaign (CLASIC) and Cu-mulus Humilis Aerosol Processing Study (CHAPS). These two campaigns provide intensive measurements of clouds and aerosols on a number of cloudy days. One of these days, 12 June 2007, is selected for this study. This day is characterized by the occurrence of a single-layer of shal-low cumuli, aerosol loading that is similar to the climatology and includes multi-spectral observations of the reflected so-lar radiation obtained at a spatial resolution of 0.05 km using a high-altitude aircraft. Such high-resolution observations make it possible to substantially reduce the sub-pixel cloud contamination and allow us to focus on the cloud adjacency effect. These observations were accompanied by indepen-dent aircraft and surface measurements of AOD. In Sect. 2 we overview CLASIC and CHAPS and describe measure-ments used in this study. Section 3 outlines the RR method and provides some results from the sensitivity study, which are relevant for our evaluation analysis (Sect. 4). Sections 5 and 6 include discussion and summary, respectively.
2 CHAPS and CLASIC overview
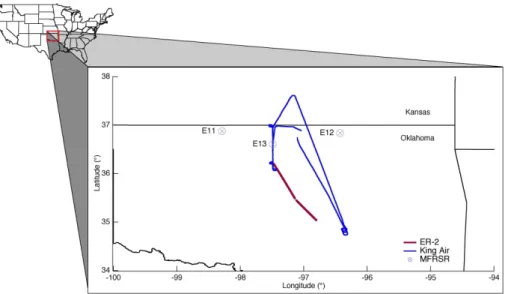
Fig. 1. The general map of aircraft flight tracks with locations of three MFRSRs (circles), and representative flight patterns flown by the ER-2 (red) and the King Air (blue) on 12 June 2007. The corresponding AOD values for these flight patterns are shown in Fig. 9 (Sect. 4).
of cloud-aerosol interactions in shallow cumuli and to pro-vide integrated ground-based, aircraft and satellite observa-tions. CLASIC was designed to examine relationships be-tween surface processes and shallow cumuli (Miller et al., 2007). A number of aircraft particpated in CLASIC, includ-ing the NASA ER-2 (Fig. 2), which was equipped with the MODIS Airborne Simulator (MAS). The ER-2 flew at 20-km altitude and the MAS measured reflected solar and emitted thermal radiation in 50 channels (from 470 nm to 14 200 nm) with high spatial resolution (0.05 km). There were twelve campaign-related ER-2 flights (http://mas.arc.nasa.gov/data/ deploy html/clasic home.html). We use the RR method to convert the MAS reflectances into the AOD values as de-scribed in Sect. 4.
CHAPS was designed to study changes in the optical and chemical properties of particles as they move through shallow cumuli as well as changes to the cloud microphys-ical properties (Berg et al., 2009). One of the primary instrument platforms used during CHAPS was the NASA Langley King-Air (Fig. 2), which was equipped with the High Spectral Resolution Lidar (HSRL). The HSRL flew at about 9-km altitude and measured profiles of aerosol backscatter and depolarization at two wavelengths (532 nm and 1064 nm), and profiles of aerosol extinction, and con-sequently, AOD at one wavelength (532 nm). There were nineteen campaign-related King Air flights (http://science. larc.nasa.gov/hsrl/chaps/chaps.html).
To evaluate the RR-derived AOD from MAS radiances, we need collocated and coincident estimates of the AOD from independent measurements. Data collected by several instru-ments (Table 1) during a single cloudy day (12 June 2007) with well-defined single-layer cumuli (Fig. 3) were analyzed. We found that the aircraft data (MAS and HSRL) collected
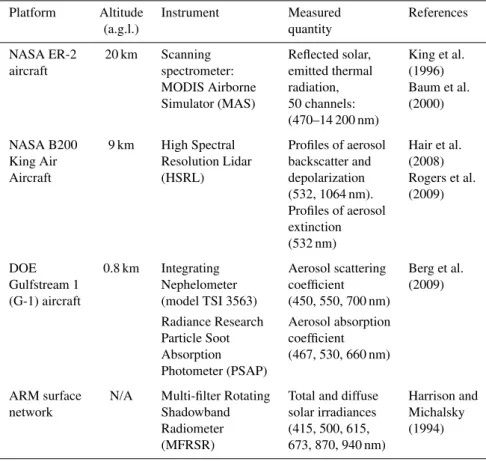
Table 1.List of key instruments used for obtaining optical and radiative properties of aerosol during the case study period.
Platform Altitude Instrument Measured References
(a.g.l.) quantity
NASA ER-2 20 km Scanning Reflected solar, King et al.
aircraft spectrometer: emitted thermal (1996)
MODIS Airborne radiation, Baum et al.
Simulator (MAS) 50 channels: (2000)
(470–14 200 nm)
NASA B200 9 km High Spectral Profiles of aerosol Hair et al.
King Air Resolution Lidar backscatter and (2008)
Aircraft (HSRL) depolarization Rogers et al.
(532, 1064 nm). (2009) Profiles of aerosol
extinction (532 nm)
DOE 0.8 km Integrating Aerosol scattering Berg et al.
Gulfstream 1 Nephelometer coefficient (2009)
(G-1) aircraft (model TSI 3563) (450, 550, 700 nm) Radiance Research Aerosol absorption Particle Soot coefficient Absorption (467, 530, 660 nm) Photometer (PSAP)
ARM surface N/A Multi-filter Rotating Total and diffuse Harrison and
network Shadowband solar irradiances Michalsky
Radiometer (415, 500, 615, (1994)
(MFRSR) 673, 870, 940 nm)
for this day (12 June 2007) meet, at least in part, these crite-ria. The MAS legs 10 and 11 and HSRL observations were made during the same day and over the same general area (Fig. 1). However, the MAS and HRSL flight routes were separated in space and time (Fig. 1). Thus, in a strict sense the MAS and HSRL observations were not collocated or co-incident.
To obtain independent AOD estimates along the MAS flight trajectory, we apply AOD values provided by ground-based Multi-filter Rotating Shadowband Radiome-ters (MFRSRs). These instruments give the spectral values of AOD at six wavelengths (415, 500, 615, 673, 870 and 940 nm). The MFRSR measures spectral values of the to-tal and diffuse solar irradiances with 20-s temporal resolu-tion. These quantities are used to obtain the direct solar ir-radiances, and consequently, AOD values for clesky ar-eas (Harrison and Michalsky, 1994). The MFRSR data for 12 June 2007 were taken from the network operated by the US DOE ARM Program. This network includes 21 sites with the mean distance between neighboring sites of about 80 km. For interpolation of AOD between the MFRSR sites, we used an original technique based on the assumption that AOD fields over the SGP region have the spatial structure of a two-dimensional Fractional Brownian Motion (Appendix A).
This assumption has been verified in the study by Alexandrov et al. (2004a). Unfortunately, on 12 June clear-sky data are available from only 3 MFRSRs (E11, E12, and E13) (Fig. 1). For other sites, clear-sky data are not available because the direct solar beam was frequently blocked by clouds. To cover the area of interest (Fig. 1), the measurements made by the three MFRSR instruments are interpolated. The interpolated MFRSR-derived AOD provide the independent constraint to be compared with those retrived from the MAS observa-tions using the RR method. Uncertainties associated with the MFRSR-based interpolation are estimated by using the HSRL-derived AOD (Sect. 4).
Fig. 3.Two-dimensional images of ground-based micropulse lidar attenuated backscatter (km−1sr−1) (top) and hemispherical total sky images (bottom) for 12 June 2007. Top: The horizontal and vertical axes represent time (UTC) and altitude (km), respectively.
stack 10 m tall, the air stream is dried to approximately 40% relative humidity and the scattering and absorption are mea-sured using a TSI 3563 Integrating Nephelometer and Radi-ance Research Particle Soot Absorption Photometer (PSAP), respectivily. The air stream then passes through a humidi-fier, and a second measurement of scattering is made. The two aerosol scattering measurements at two different relative humidities (RHs) can be used to determine the aerosol hy-groscopic growth factor,f(RH), which is defined as the ratio of the scattering measured at 85% RH to the scattering mea-sured at 40% RH (Sheridan et al., 2001). The SSA is defined as a ratio of observed scattering and extinction for different values of relative humidity (e.g., dry and wet SSA values).
Similar to the AOS, the US DOE Gulfstream 1 (G-1) air-craft provides observations of aerosol optical properties at different altitudes. Berg et al. (2009) present the full instru-ment payload on board the G-1, which includes two TSI 3563 Integrating Nephelometers for measuring aerosol scattering and two PSAPs to measure particle absorption. A total of eight research flights with the G-1 were conducted during the CHAPS campaingn. The G-1 measurements made on 11, 13 and 14 June are of particular interest to this study. The average growth factor over the three-day period observed at the surface was 2.54, which was much larger than the long-term average of 1.83 presented by Sheridan et al. (2001). The SSA was calculated using both the dry (40% relative humid-ity) and wet (85% relative humidhumid-ity) values of scattering. On
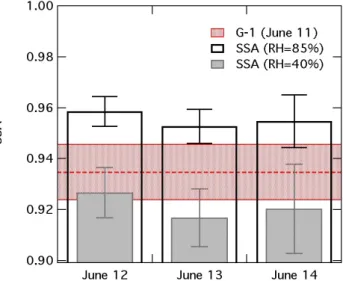
Fig. 4. Daily average mean surface SSA on 12 June through 14 June 2007 at the ACRF Central Facility for RH of 40% (grey), SSA for the same days for RH of 85% (black), and average SSA computed form G-1 flight leg on 11 June (dashed red line). Error bars for surface measurements indicate the standard deviation for that day, and red shading indicates the standard deviation of SSA measured by the G-1.
12 June, the 24-h average dry SSA associated with particles less than 10 µm in diameter was 0.927, while the wet SSA was nearly 0.96 (Fig. 4). Absorption data from the ACRF Central Facility was not available on 11 June; therefore only surface measurements made on 13 and 14 June were included in Fig. 4. The SSA over these three days is nearly constant with differences within the daily-range variability, suggest-ing that aerosol absorbsuggest-ing properties did not vary systemat-ically over that period. Measurements of SSA at a relative humidity of 35% were made on board the G-1 aircraft in relatively clean air just south of Oklahoma City, Oklahoma. The average SSA value (0.934) from a flight on 11 June is shown in Fig. 4. This leg was flown approximately 800 m above ground and 300 m below cloud base. These results are broadly consistent with a finding from a two-year study at the ARM Central Facility that SSA values measured at the surface were slightly smaller than those measured aloft (Andrews et al., 2004). We use an SSA of 0.95 for generat-ing of LUTs, and thereafter for the AOD estimations from the MAS-measured reflectances by using the RR method (Sect. 4).
3 RR method and sensitivity study results
properties (e.g., AOD, SSA, phase function) and surface albedo enter into the radiative transfer calculations as input. An underlying assumption of this approach is that 1-D re-flectance closely approximates the real (3-D) rere-flectances. This assumption is violated for partially cloudy scenes with significant horizontal inhomogeneity. Similar to traditional aerosol retrievals, the RR method (Kassianov and Ovtchin-nikov, 2008) is also based on LUTs generated by a 1-D ra-diative transfer model but assumes that the 1-D reflectance ratio ρ1D(λ2;λ1) approximates the 3-D reflectance ratio
ρ3D(λ2;λ1), where ρ (λ2;λ1) is the ratio of reflectances
R (λ2)andR (λ1)at two wavelengthsλ2 andλ1. This as-sumption is motivated by the well-known fact that clouds reflect about the same amount of sunlight regardless of the wavelength and consequently the reflectance ratio is less sen-sitive to 3-D radiative effects of clouds than reflectance (Kas-sianov and Ovtchinnikov, 2008). The second assumption of the RR method is that the spectral behavior ofτa is
de-scribed by a two-parameter power lawτa(λ)=βλ−α (e.g.,
von Hoyningen-Huene, 2003; Katsev et al., 2010). The two parametersα andβ are known as the Angstrom exponent and the turbidity coefficient, respectively. This assumption is motivated by widespread practical use of different two-parameter fits ofτa(λ) in aerosol-related studies and
satel-lite retrievals, such as in the MODIS and Advanced Very High Resolution Radiometer (AVHRR) operational aerosol retrieval algorithms.
In contrast to traditional aerosol retrievals, the RR-based LUTs link two reflectance ratios (two knowns) and two pa-rametersαandβ (two unknowns). For given observational conditions and viewing geometry, the link can be written as
ραβ(λ2;λ1) = f1(α, β) (1)
ραβ(λ3;λ1) = f2(α, β)
The RR method includes two basic steps described in de-tail by Kassianov and Ovtchinnikov (2008) and briefly sum-marized here. The first step defines parameters α and β
by replacement of the 1-D reflectance ratios ραβ(λ2;λ1) and ραβ(λ3;λ1) by their “observed” 3-D counterparts
ρobs(λ2;λ1) and ρobs(λ3;λ1) in Eq. (1). Such replace-ment represents the first assumption specified in the previ-ous paragraph. The second step uses the second assumption and estimatesτa(λ)by using the defined parameters (α,β)
and assumed power law. The selection of appropriate wave-lengths(λ1, λ2, λ3)in Eq. (1) is governed by the existence and uniqueness of their solution. Graphically, the solution of Eq. (1) is an intersection point of two isolines of constant re-flectance ratios in the (α,β) domain. When these isolines are nearly orthogonal over much of the (α,β) domain, a unique solution for the (α,β) pair can be obtained (Appendix B). Note that we considered three wavelengths (470, 660 and 870 nm). Some of these wavelengths may not be available for other aircraft- and space-born instruments, which measure reflected solar radiation. For example, the 470-nm channel
is not included in widely-used radiometers, such as AVHRR and Multiangle Imaging Spectroradiometer (MISR). There-fore, the adaption of the RR method to these radiometers would require additional studies for selecting other combi-nations of wavelengths.
A key question in the obtaining of parameters (α, β) relates to how random errors in the reflectance ratios can change the solution of Eq. (1), and consequently, the trieved AOD. If the solution changes significantly, the re-trieval would not be considered to be stable. These errors can be attributed by uncertainties in sensor characteristics (e.g., calibration), the atmospheric conditions (e.g., aerosol SSA) and surface properties (e.g., surface albedo). The radiomet-ric calibration of the MAS shortwave channels (<2500 nm) is discussed by King et al. (2010). In particular, the calibra-tion adjustment is about 7% at 660 nm (King et al., 2010). It is customary to express the reflectance as the sum of regular
¯
R (λ)and fluctuatingR (λ)˜ components
R (λ) = ¯R (λ)+ ˜R (λ) (2)
A sensitivity study by Kassianov et al. (2009) assessed the performance of the RR method when random errors R (λ)˜
were specified asR (λ)˜ =γ (λ)R (λ)¯ and noiseγ (λ)was dis-tributed uniformly over the interval (−0.05; 0.05). In par-ticular, the sensitivity study included two limiting cases with spectrally dependent and spectrally independent errors. The study showed that the spectrally correlated errors do not sig-nificantly affect the number of pixels where the RR-based retrieval of AOD is possible or the RR-derived AOD val-ues. On the other hand, spectrally independent fluctuations of
R (λ)can increase substantially the number of pixels where large (>50%) positive and negative AOD biases occur. The domain-averaged values of the retrieved AOD, however, de-pend only weakly onR (λ)˜ because negative and positive bi-ases tend to cancel each other. In contrast, the total num-ber of clear pixels with retrieved AOD (NAOD) is sensitive to the random errorsR (λ)˜ . For example,NAOD is reduced by about 20% when small (≤5%) but spectrally independent random errors were introduced in the reflectances. Such re-duction can be explained as follows. Spectrally independent errors in reflectances can be amplified substantially for some clear pixels leading to large uncertainties in reflectance ra-tios. As a result, the reflectance ratios can move outside the valid ranges specified in the generated LUTs, in which case the RR method does not provide the AOD retrieval for such pixels.
4 Evaluation of the RR method
The evaluation of the RR method includes (1) estimation of the RR-derived AOD values and (2) their comparison with independent AOD estimates. The RR-derived AOD values (Sect. 4.1) are obtained by the RR method. We determine pa-rametersαandβby applying the RR method to the cloudy-sky MAS-measured reflectances. Then these parameters (α
andβ) are used to specify the spectral values of AOD. Inde-pendent AOD estimates are obtained by spatial and temporal interpolation of the MFRSR-derived AODs (Sect. 4.2). First, we assess uncertainties associated with the AOD interpola-tion by comparing the MFRSR- and HSRL-derived AODs along the HSRL flight track. Then the AOD interpolation is used to obtain the MFRSR AODs along the MAS flight tra-jectory. These MFRSR-obtained AODs are then compared to those provided by the RR method.
4.1 RR-derived AOD
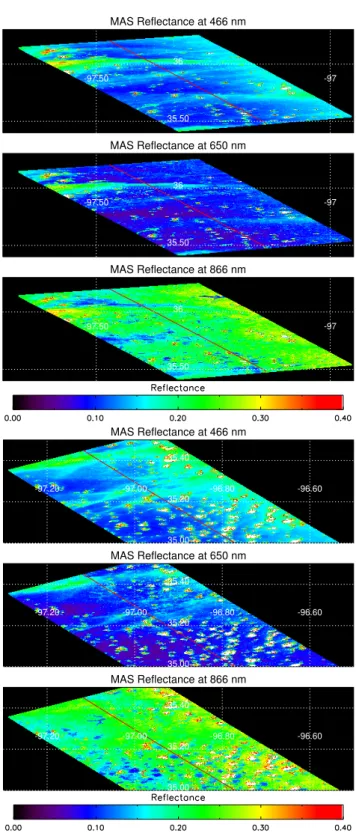
To convert the MAS reflectances (Fig. 5) into the AOD val-ues, we generate the LUTs for given observational condi-tions. During 12 June 2007, two legs 10 and 11 of the MAS flights had the closest temporal and spatial overlap with the NASA King Air flight pattern. The corresponding mean val-ues of the SZA are 40 and 41 degrees for legs 10 and 11, respectively. We generate the LUTs for these two SZAs and assumed values of aerosol SSA and surface albedoAS. Re-sults of our analysis (Sect. 2) demonstrate that on this day the aerosol was slightly absorbing (SSA∼0.95) and that ground-and aircraft-based SSA values are comparable. Thus, we assume that the aerosol SSA is equal to 0.95 for all three wavelengths (470, 660 and 870 nm) and does not change sig-nificantly with altitude in the boundary layer. However, the vertical distributions of other aerosol properties (e.g., extinc-tion coefficient) are not vertically uniform and represent typ-ical profiles observed during the CLASIC and CHAPS cam-paigns. Also, these campaigns include satellite- and ground-based measurements of surface albedoAS, which is a com-plex function of land cover type, aerosol loading, cloud prop-erties and SZA (e.g., Yang et al., 2008). Note that the area surrounding the ARM Central Facility contains 10 main land cover types (e.g., Luo et al., 2005) and it is characterized by substantial spatial variability ofAS. The sensitivity of the RR-retrieved AOD toASis considered next.
We start with analysis of available information ofAS(λ) at the ARM Central Facility and surrounding area obtained from surface and satellite observations (e.g., Michalsky et al., 2003; Yang et al., 2008). The main objective of such analysis is to define typical spectral variations ofAS(λ). For exam-ple, the 6-channel upward-looking MFRSRs and downward-looking Multi-filter Radiometers (MFRs) on 10 m and 25 m towers at the ARM Central Facility are applied to estimate spectral values ofAS(λ) at six MFRSR wavelengths. Val-ues of surface albedo at other wavelengths are obtained by
MAS Reflectance at 466 nm
-97.50 -97
35.50 36
MAS Reflectance at 650 nm
-97.50 -97
35.50 36
MAS Reflectance at 866 nm
-97.50 -97
35.50 36
MAS Reflectance at 466 nm
-97.20 -97.00 -96.80 -96.60
35.00 35.20 35.40
MAS Reflectance at 650 nm
-97.20 -97.00 -96.80 -96.60
35.00 35.20 35.40
MAS Reflectance at 866 nm
-97.20 -97.00 -96.80 -96.60
35.00 35.20 35.40
Table 2.Initial values, increments and the corresponding ranges of assumed surface albedo as functions of wavelengths.
Wavelength Initial value, Increment, Range
(nm) Aλ 1Aλ (min–max)
470 0.03 0.005 0.03–0.06
660 0.07 0.01 0.07–0.13
870 0.20 0.02 0.20–0.32
interpolation. At the ARM SGP site, the typical spectral val-uesAS(λ)vary over a broad range: (0.03–0.06), (0.07–0.13) and (0.20–0.32) for the wavelengths 470, 600 and 870 nm, respectively. To represent such spectral variations, we de-velop the LUTs, which cover these ranges. Specifically, we calculate the LUTs for the following values ofAS(λ)
AS,λ(i) = Aλ+1Aλ×(i−1), (3)
i = 1, ..., NA
whereAλ and1Aλ are their initial values and increments
(Table 2). We assume that the number of binsNA is equal to 7. Thus, for the three wavelengths, the total number of cre-ated LUTs is 343 (73=343). For each LUT, we obtain a pop-ulation of clear pixels where the AOD is retrieved using the RR-method. The population size,NAOD, depends substan-tially on the assumed surface albedo: it decreases by about 10 times with increase ofAS(λ)from 0.20 to 0.32 (Fig. 6). In comparison with NAOD, the domain-averaged retrieved AOD values at 660 nm are not sensitive to the assumedAS(λ) (Fig. 6). The observed weak AOD dependence at 660 nm is consistent with the sensitivity study results (Sect. 3). The assumed AS(λ) has a noticeable impact on the Angstrom exponent of the retrieved AOD (Appendix C): it increases from 1.20 to 1.54 whenAS(λ)increases from 0.20 to 0.32. Note that an accurate estimation of the Angstrom exponent from satellite-obtained AODs represents a great challenge even for clear-sky conditions (e.g., Mischenko et al., 2010). As a result, the satellite-based AOD retrievals and their com-parisons are performed typically for a given wavelength.
Below, we show the RR-derived AOD values (legs 10 and 11), which represent the largest populationsNAOD∗ . The number of pixelsNAOD∗ equals 701 and 533 for leg 10 and leg 11, respectively. The corresponding spectral values of the surface albedo are A∗s,470=0.06, A∗s,660=0.07 and
A∗s,870=0.22 and these values are the same for legs 10 and 11. Since the mean values of the RR-retrieved AOD are largely unaffected by uncertainties in the reflectance (Sect. 3), we compare the mean values with those provided by MFRSR observations.
Fig. 6. Example of the RR-based AOD retrieval: population of clear pixels with the retrieved AOD and the domain-averaged AOD (660 nm) as function of assumed surface albedo (870 nm) for leg 10 (top) and leg 11 (bottom).
4.2 MFRS-derived AOD
The spectral AOD values at six wavelengths are supplied by three MFRSRs located at three sites (Sect. 2). The tempo-ral and spatial interpolation of the MFRSR data (Sect. 2), allows us to obtain the MFRSR-derived AOD for time in-stances and locations of interest. In other words, such inter-polation makes it possible to get the “collocated” and “coin-cident” MFRSR and MAS observations.
Fig. 7.Two-dimensional images of aerosol extinction coefficient at 532 nm obtained from HSRL data as function of latitude and longitude (the bottom of figure). The HSRL flight had a complex spatial pattern (Fig. 1), thus the corresponding monotonic temporal scale is also given at the top of figure.
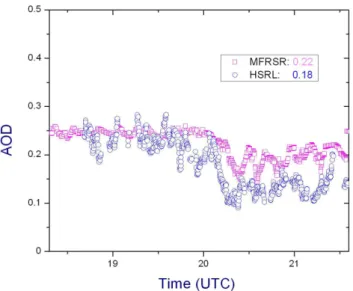
Fig. 8. Temporal realizations of the MFRSR- and HSRL-derived AOD along the HSRL track. Corresponding mean values (0.22 and 0.18) are shown.
column (from surface to the top of the atmosphere) and a 9-km thick layer, respectively. Thus, aerosols located above the HSRL flight altitude (9 km) can contribute slightly (∼0.01) to the observed differences between the HSRL- and MFRSR-derived AODs.
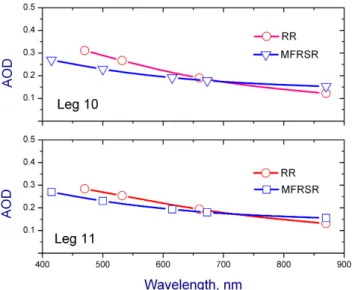
We use the MFRSR-derived AODs interpolated to the MAS track for comparison with the corresponding RR-derived AODs. Figures 9 and 10 show that the spec-tral values of the RR- and MFRSR-derived AODs corre-late quite well, with better agreement between the RR-and MFRSR-derived AODs for leg 11 (Fig. 10). For both legs, the RR- and MFRSR-derived AOD are close (within
5%) for the 660-nm wavelength. In comparison with the MFRSR data, the RR method overestimates (underestimates) AOD values for wavelengths shorter (longer) than 660 nm (Fig. 10). The corresponding absolute (relative) differences are about 0.04–0.07 (16–29%) and 0.02–0.03 (15–20%) for wavelengths 470 nm and 870 nm, respectively. Under clear-sky conditions, uncertainties of the MFRSR-derived AOD are about 0.01–0.02 (Michalsky et al., 2006) and the ex-pected uncertainties of the MODIS-derived AOD typically fall within ±0.05±0.15τa over land (Remer et al., 2005).
Under cloudy-sky conditions, the cloud-induced enhance-ment may be responsible for much larger overestimation of the MODIS-derived AOD (e.g., Wen et al., 2006, 2007).
5 Discussion
The observed differences between the spectral dependence of RR- and MFRSR-derived AODs (Sect. 4) can be attributed to several factors. The first factor is related to the sampling is-sues. The MAS sampling of reflectances is performed along the flight track, whereas the MFRSR sampling of direct nor-mal irradiances (direct beam) is made at three ground-based sites followed by appropriate interpolation of the MFRSR-derived AODs (Sect. 2). As determined by comparing the MFRSR-and HSRL-derived AODs, the uncertainties associ-ated with the AOD interpolation are about 0.04 (20%) for the 500-nm wavelength. These uncertainties may have spectral dependence. The second factor is related to the cloud screen-ing. The RR-based cloud screening is based on the spec-tralvariations of reflectance ratios (Kassianov et al., 2009), whereas the MFRSR-based cloud screening incorporates the
Fig. 9. Map of AOD obtained from the RR, HSRL and MFRSR retrievals (colored lines). Warmer colors indicate larger AOD. The RR retrieval is performed for the MAS-measured reflectances along the MAS flight legs 10 and 11. The more western RR retrieval corresponds to the flight leg 10. Numbers along the colored lines denote the corresponding time of day (UTC) and circles define locations of two MFRSRs. The MFRSR-derived AOD is interpolated spatially and temporally to represent the AOD along the MAS flight trajectory (legs 10 and 11). To ease the comparison of the RR- and MFRSR-derived AODs, the latter are slightly shifted down and to the left (toward the southwest).
Fig. 10. Spectral dependence of the domain-averaged AOD values obtained from the RR and MFRSR retrievals for leg 10 (top) and leg 11 (bottom).
“nearby” AOD values depend on relative humidity (RH) in a cloud layer in a complex and ambiguous way. For example, large changes of Angstrom exponent, which defines the spec-tral dependence of AOD, can be produced for the bimodal aerosol size distribution and these changes are governed by the accumulation mode fraction and RH (Loeb and Schus-ter, 2008). Note that the uncertainties in surface albedo can
modify substantially the population of clear pixels with the retrieved AODNAOD (Sects. 3 and 4) and thus change the corresponding “near-cloud” AOD values.
The largest population of pixels determined using the RR methodNAOD∗ is obtained for the following spectral values of the surface albedo: A∗s,470=0.06, A∗s,660=0.07 and
A∗s,870=0.22 (Sect. 4). These values can be considered as an “effective” domain-averaged (along flight track) values for given observational (e.g., aerosol and cloud properties) and illumination (SZA) conditions. Since the spatial resolution of the MAS observations is 0.05 km and populationNAOD∗
equals 701 for leg 10 and 533 for leg 11, these “effective” values represent samples with a horizontal swath of about 35 km along leg 10 and 25 km along leg 11. The estima-tion of these “effective” values required a substantial (343) number of LUTs (Sect. 4). For the given area of interest and set of wavelengths, the number of LUTs is defined by the
AS(λ)range and the specified number of binsNA(Sect. 4). Since the detailed information about AS(λ) is not required for the RR-based AOD retrieval (Sect. 4), larger increments
1Aλcan be used to reduce the number of binsNA. If
Table 3.Acronyms.
AOD Aerosol optical depth AOS Aerosol Observation System ARM Atmospheric Radiation Measurement ASP Atmospheric Science Program CF Cloud fraction
CHAPS Cumulus Humilis Aerosol Processing Study CLASIC Cloud and Land Surface Interaction Campaign COD Cloud optical depth
d Nearest cloud distance DOE Department of Energy
EMSL Environmental Molecular Sciences Laboratory G-1 Gulfstream-1 aircraft
HSRL NASA Langley High Spectral Resolution Lidar LUT Look-up table
MAS MODIS Airborne Simulator MFR Multi-filter Radiometer
MFRSR Multi-filter Rotating Shadowband Radiometer MISR Multiangle Imaging Spectroradiometer
MODIS MODerate-Resolution Imaging Spectroradiometer MSCF Molecular Science Computing Facility
NASA National Aeronautics and Space Administration OBER Office of Biological and Environmental Research PSAP Radiance Research Particle Soot Absorption Photometer PNNL Pacific Nortnwest National Laboratory
RH Relative humidity RR Reflectance ratio SGP Southern Great Plains SSA Single scattering albedo SZA Solar zenith angle
potential relationship between such “effective” values ofAS and their actual counterparts, additional studies are needed. These studies should include collocated and coincident air-craft (e.g., Coddington et al., 2008; Knobelspiesse et al., 2008) and ground-based (e.g., Michalsky et al., 2003) mea-surements of surface albedo.
6 Summary
We evaluate a new method, called the RR method, using ex-tensive airborne and ground-based datasets collected during the CLASIC and CHAPS, which took place in June 2007 over the DOE ARM SGP site. We perform a detailed case study for a day (12 June 2007) with single-layer shallow cumuli and typical aerosol loading. For this day, indepen-dent measurements of AOD are available from aircraft-based HSRL and three ground-based MFRSRs. These HSRL-and MFRSR-derived AODs are used for the development of a dataset to evaluate the RR method. Such develop-ment includes the temporal and spatial interpolation of the MFRSR-derived AODs and estimation of uncertainties as-sociated with this interpolation. The uncertainties are esti-mated by interpolating the MFRSR-derived AODs (500 nm) for the 3-h HSRL fight trajectory and comparing the mean
value of MFRSR-derived AOD (along the HSRL track) with that provided by the HSRL (532 nm). The moderate differ-ence (∼20%) between the MFRSR and HSRL values sug-gests that the temporally and spatially interpolated MFRSR-derived AODs can give a reasonable AOD estimate for a given time and location, at least for the day of interest.
The RR method utilizes the reflectance ratios at two pairs of wavelengths (660 and 470 nm) and (870 and 470 nm) and estimates AOD for clear pixels under partly cloudy condi-tions (Kassianov and Ovtchinnikov, 2008; Kassianov et al., 2009). The advantage of the RR method over available reflectance–based algorithms is that it reduces substantially the impact of the 3-D radiative effects of clouds on the re-trieved AOD, which can be large (up to 140%). We ap-ply the RR method to derive spectral values of AOD from the cloudy-sky reflectance ratios provided by the MODIS Airborne Simulator (MAS) with high spatial resolution (0.05 km). The MFRSR-derived AOD values are interpolated along the MAS fight trajectory and these interpolated values are considered as observational constraint for the evaluation of the RR method. Comparison of the RR- and MFRSR-derived AODs reveals that their mean values (along the MAS track) are in a good agreement (within 5%) for 660-nm wave-length. The RR AODs are greater (by 15–30%) than the MFRSR ones for 470-nm wavelength. The opposite is true for 870-nm wavelength. The RR-MFRSR differences in spectral dependence could be associated with the sampling and cloud screening issues. The conclusions so far are ob-tained for a single day with typical single-layer cumuli and typical aerosol loading. More retrievals for different cloud and aerosol types are needed in order to better understand advantages and limitations of the RR method, and hence to improve the aerosol retrievals under partly cloudy conditions. The results of the case study illustrate the capability of the RR method for retrieving AOD from high-resolution aircraft observations. These observations make it possible to reduce the negative influence of the cloud contamination effect on the AOD retrieval. However, this influence should be more pronounced for coarse-resolution (0.5–1.0 km) observations provided by satellites, such as the MODIS instrument on the “A-Train” satellite constellation (Stephens et al., 2002). An “A-Train” overpass occurred over the ARCF during the case-study day (12 June 2007). To understand the influence of spatial resolution on the RR-based AOD retrieval, we plan to apply the RR method to available MODIS observations made at the coarse spatial resolution.
Appendix A
Interpolation method
Here we describe an original interpolation technique first re-ported by Alexandrov et al. (2006). Consider a realization
with known statistics of its increments1f=f (x)−f (x0)
described by a Gaussian probability distribution
ϕ (1 f ) = √1
2π s exp
"
−(1 f ) 2 2s2
#
,
where
s =
q
E( 1 f )2 = σ |1 x|H
is the standard deviation, expressed in terms of the charac-teristic dispersion parameterσ and the Hurst exponent H, which takes values between 0 and 1. Here x andx0 are points on the plane (which can be considered as 2-D vectors in some coordinate system) and1xis the distance between them (the length1x= |x−x0|of the difference between the corresponding 2-D vectors).
Letf be sampled at a set ofn+1 points
{x0, x1, x2, ..., xn} on the plane and we need to esti-mate its valuef (x)at some other pointx. This is equivalent to estimation of the increment 1f=f (x)−f (x0), since
f (x0)is known. We define the sampled increments as
1 fi = f (xi) −f (x0), i = 1,2, ..., n
and the corresponding distance vectors as1xi=xi−x0with
1xi = |1xi|. The choice of a particular “base point” x0 among the sampled points does not affect the interpolation results.
The covariance matrix6 of the increments 1fi has the elements
6ij = E1 fi 1 fj = σ2 1 xi 1 xjHρij,
whereρij are the elements of the corresponding correlation
matrix
ρij =
E1 fi 1 fj
r
E(1 fi)2E
h
1 fj2
i
,
which in 2-D case can be expressed as
ρij =
1 2 "
rijH + 1
rijH −
rij +
1
rij −
2 cosαij
H#
,
whererij=1xi/1xj, andαij is the angle between the
vec-torsxi andxj.
The (n+1) – dimensional random variable 1=
{1f, 1f1, 1f2, ..., 1fn}obeys the following joint normal distribution:
ϕ (1) =
√ |K| 2π(n+1)/2
×exp
"
−1 2 (1f )
2k 00+21f
n
X
i=1 k0i1fi+
n
X
i=1
n
X
j=1
kij1fi1 fj
!# ,
whereK=6−1,kij are the elements of K(index “0”
cor-responds to1f), and|K| =detK. It is not difficult to show that ones1f1,1f2,. . . ,1fnare fixed,1f obeys normal dis-tribution
ϕ1(1 f ) =
1 √
2π S exp
"
−(1 f −A) 2 2S2
#
with the mean
A = − 1
k00
n
X
i=1
k0i 1 fi
and the dispersion
S2 = 1
k00
,
which can be used respectively as the predicted value of1f
and the uncertainty of this value.
The Hurst exponentH and the characteristic dispersion
σ are free parameters of the model and should be defined a priori. Classical Brownian motion corresponds toH=1/2, while the Kolmogorov’s 3-D turbulence toH=1/3 (Davis et al., 1994). In the study by Alexandrov et al. (2004a) of scal-ing properties of AOD based on MFRSR measurements from the SGP network values ofH ranging from 0.1 to 0.5 were encountered in time series samples. The monthly averaged (September 2000) value ofH derived from spatial structure function was 0.32. Based on the results of that paper we have chosenH=0.3 andσ=0.002 for this study. Note that the mean value estimateAis independent from the characteristic dispersionσ2, thus, interpolation is possible even whenσ is poorly constrained.
Alexandrov et al. (2006) compared the results of the described interpolation technique with two more standard methods: minimal curvature surface (MCS) and kriging. For that test MFRSR sites were removed (one at a time) from the SGP network, and the AOD values (at 870 nm) interpolated from the remaining part of the network to the removed site location were compared with the actual measurements at that site. FBM and MCS results appeared to be similar and gener-ally better than those of kriging. The largest differences oc-cur at the network border, especially if the AOD values from the removed site were not typical for its neighborhood. The mean differences over all sites for MCS, FBM and kriging were respectively 0.0024, 0.0026, and 0.0032 with standard deviations 0.014, 0.013, and 0.025.
Appendix B
Development and application of LUTs
Fig. B1. Example of model reflectance ratios (ρ) generated for SZA = 40, and assumed spectral values of the surface albedo
AS(470)=0.06,AS(660)=0.07, andAS(870)=0.22.
the molecular scattering and surface reflection. The model’s details and its evaluation are described in Kassianov and Ko-gan (2002) and Cahalan et al. (2005), respectively. Here we outline the basic steps for the reflectance estimates.
The photon trajectories are simulated using the forward Monte Carlo framework (Marchuk et al., 1980). Within this framework, photons are emitted from initial pointsrn
0=
x0n, y0n, z0at the top-of atmosphere (z=z0) along the sun illumination directionω0=(θ0, ϕ0), wherenis thenth pho-ton. The initial weight of each photon is set asWon=1. The photon path lengthlis sampled from the probability density of the free path between two successive events (or photon-matter interactions):
f (l) = σ (r(l))exp (−τ (l)) (B1)
whereσ (r(l))is the total extinction coefficient, which repre-sents a sum of the extinction coefficients for individual com-ponents (molecular, aerosols, clouds). The optical length of the free path is defined as
τ (l) =
l
Z
0
σ r′ +sω
ds (B2)
wherer′is the initial point of the photon path.
At the scattering event of orderm, a responsible compo-nent (e.g., cloud) is determined and the photon weight is changed accordingly
Wmn = Wmn−1̟ (r) (B3)
where̟ (r)is a SSA of the determined responsible com-ponent at pointr (if the scattering event occurs above sur-face) or a surface albedo (if the scattering event occurs at surface). If the photon weight is less than a given thresh-old, the photon trajectory is terminated. An angular redis-tribution function9 θ, ϕ;θ′, ϕ′is applied for sampling of
Fig. B2. A family of points whereραβ=ρobs, the corresponding
three-parameter polynomial fits and the obtained solution (α∗and
β∗).
the next scattering direction θ′, ϕ′
. If them-th scattering event occurs above surface, then9 θ, ϕ;θ′, ϕ′
is a scat-tering phase function. If themth scattering event occurs at surface, then 9 θ, ϕ;θ′, ϕ′
is a bidirectional reflectance distribution function.
At each collision event, a value of contribution function
hnm(θ∗, ϕ∗;r∗)is calculated
hnm θ∗, ϕ∗;r∗ (B4)
= Wmn9 θ, ϕ;θ∗, ϕ∗
exp −τ r,r∗,
where pointr∗is located within a giving horizontal area1A
at the top of atmosphere. The sum of these values over all scattering events and photon trajectories estimates the re-flectance (1A). The Monte Carlo algorithm based on contri-bution function defined by Eq. (B4) is called the “local esti-mation” method (Marchuk et al., 1980).
The US standard atmosphere (Liou, 1992) and Lamber-tian surface are assumed in generating the LUTs. The LUTs generating also requires the aerosol phase functions at 470, 660 and 870 nm, which are calculated using Mie theory and aerosol microphysical properties provided by a Large-Eddy Simulation (Ovtchinnikov and Ghan, 2005) for typical sum-mertime conditions at the ARM SGP site. The aerosol SSA is estimated from aircraft observations (Sect. 2). A two-parameter power law (τa(λ)=βλ−α) is applied for
obtain-ing the AOD at three wavelengths (470, 660 and 870 nm), where parameterαvaries between 0.2 and 2.4 and parameter
βvaries between 0.03 and 0.35. The aerosol optical proper-ties are used as input for the radiative transfer calculations. The output is the reflectance ratios for two pairs of wave-lengths (870 and 470 nm) and (660 and 470 nm) as function ofαandβ(Fig. B1).
model reflectance ratiosραβ match the observed reflectance
ratios ρobs (Fig. B2). Then, we define the corresponding polynomial fits (e.g., three-parameter fit). Finally, we ob-tain the estimates of these two parametersα∗ andβ∗ from the point where these two fits cross each other (Fig. B2).
Appendix C
Uncertainties of RR-based AOD retrieval
Uncertainties in the RR-derived AOD could arise from inappropriate assumptions and errors associated with as-sumed/specified aerosol properties. For example, we apply the aerosol SSA provided by aircraft observations, which has an uncertainty range from 2% to 7% (e.g., Sheridan et al., 2001). To estimate the sensitivity of the RR-based AOD re-trieval to errors associated with aerosol SSA, we also per-form the RR-based AOD retrieval by using another SSA. Specifically, we assume that SSA equals 0.90 at all three wavelengths (470, 660 and 870 nm). Table C1 shows that the differences between the mean values of the RR-derived AODs for two cases (SSA = 0.95 and SSA = 0.90) are within 5%. The good agreement between these values suggests that the averaged RR-derived AODs are not sensitive to the as-sumed values of the aerosol SSA. In contrast, the number of points where the RR retrieval provides an AOD is quite sensitive to the assumed SSA (the difference of 18%). Sim-ilar results are obtained for an assumed phase function of atmospheric aerosols (not shown), which could have strong impact on the accuracy of the major satellite-based AOD re-trievals (Kokhanovsky et al., 2009).
Also, uncertainties in the RR-derived AOD could arise from inappropriate assumptions about surface albedo. The surface albedo over land is spectrally-dependent and in-creases generally with wavelength. For the considered wave-lengths (470, 660 and 870 nm), the largest values of surface albedo occur at 870 nm. To illustrate the sensitivity of the AOD spectral shape to assumed surface albedo at 870 nm (A870), we include the domain-averaged values of the re-trieved AODs at three wavelengths and the corresponding values of standard deviation (Fig. C1).
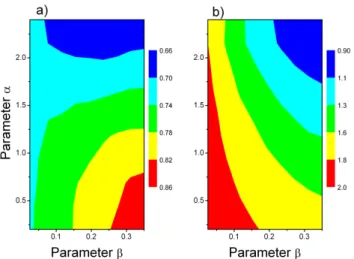
The mean values of the retrieved AODs at 660 nm and 870 nm do not change substantially with A870, while the mean AOD at 470 nm shows much stronger sensitivity to
A870. As a result, the Angstrom exponent (470–870 nm) of the retrieved AOD depends noticeably on the assumed sur-face albedoA870: it changes from 1.20 atA870=0.20 to 1.54 atA870=0.32. Note that the estimation of Angstrom ex-ponent from the reflected solar radiation is much less accu-rate than the estimation of AOD at a given wavelength (e.g., Mischchenko et al., 2010). The standard deviation values, which provide a measure of variability of the RR-retrieved AODs, are not very sensitive to the assumed surface albedo (Fig. C1). We emphasize that different number of pixels with
Table C1. The number of points with the RR-derived AODs (leg 10) and the corresponding mean values of AOD at three wave-lengths (470, 660 and 870 nm) obtained for two cases with different assumptions about aerosol SSA.
Assumed Number of AOD (470) AOD (660) AOD (870) SSA points
0.95 701 0.306 0.192 0.135
0.90 577 0.303 0.186 0.128
17.7% 1.0% 3.3% 4.9%
Fig. C1. Mean values of the RR-retrieved AOD (leg 10) at three wavelengths (470, 660 and 870 nm)(a)and the corresponding val-ues of standard deviation obtained for seven cases with different assumptions about surface albedo at 870 nm.
retrieved AOD are used for obtaining the considered basic statistics and this number depends strongly on the assumed surface albedo (Fig. 6).
The current version of the RR method can estimate quite accurately the averaged values of the AOD for cases with moderate-to-large aerosol loading (AOD>0.1). However, it performs poorly in the close vicinity of clouds (∼0.1– 0.3 km). The corresponding errors of the RR-derived AOD depend on the cloud fraction and COD and can exceed 100% (Kassianov et al., 2009). Since the largest changes of aerosol properties occur near clouds (e.g., Su et al., 2008; Chiu et al., 2008), the RR method is not well suited for describing them.
Acknowledgements. This work was supported by the National Aeronautics and Space Administration (NASA) through the Radiation Sciences Program and the Office of Biological and Environmental Research (OBER) of the US Department of Energy (DOE) as part of the Atmospheric Radiation Measurement (ARM) Program and Atmospheric Science Program (ASP). The Pacific Northwest National Laboratory (PNNL) is operated by Battelle for the DOE under contract DE-AC06-76RLO 1830. This research was performed in part using the Molecular Science Comput-ing Facility (MSCF) in the Environmental Molecular Sciences Laboratory (EMSL), a national scientific user facility sponsored by the US DOE, OBER and located at PNNL. We are grateful to James Barnard and Alexander Kokhanovsky and anonymous reviewers for thoughtful comments.
Edited by: A. A. Kokhanovsky
References
Albrecht, B.: Aerosols, cloud microphysics, and fractional cloudiness, Science, 245, 1227–1230, doi:10.1126/science.245.4923.1227, 1989.
Alexandrov, M. D., Marshak, A., Cairns, B., Lacis, A. A., and Carlson, B. E.: Scaling properties of aerosol optical thickness retrieved from ground-based measurements, J. Atmos. Sci., 61, 1024–1039, 2004a.
Alexandrov, M., Marshak, A., Cairns, B., Lacis, A. A., and Carlson, B. E.: Automated cloud screening algorithm for MFRSR data, Geophys. Res. Lett., 31, L04118, doi:10.1029/2003GL019105, 2004b.
Alexandrov, M., Lacis, A., Carlson, B., and Cairns, B.: New Devel-opments in Multi-Filter Rotating Shadowband Radiometer Data Analysis, Paper presented at the Sixteenth Atmospheric Radia-tion (ARM) Science Team Meeting, US Department of Energy, Richland, WA, 2006.
Andrews, E., Sheridan, P. J., Ogren, J. A., and Ferrare, R.: In situ aerosol profiles over the Southern Great Plains cloud and radia-tion test bed site: 1. Aerosol optical properties, J. Geophys. Res., 109, D06208, doi:10.1029/2003JD004025, 2004.
Baum, B. A., Kratz, D. P., Yang, P., Ou, S., Hu, Y., Soulen, P. F., and Tsay, S.-C.: Remote sensing of cloud properties using MODIS Airborne Simulator imagery during SUCCESS, I. Data and mod-els, J. Geophys. Res., 105, 11767–11780, 2000.
Berg, L. K., Berkowitz, C. M., Hubbe, J. M., Ogren, J. A., Hostetler, C. A., et al.: Overview of the Cumulus Humilis Aerosol Process-ing Study, B. Am. Meteorol. Soc., 90, 1653–1667, 2009.
Cahalan, R. F., Oreopoulos, L., Wen, G., Marshak, A., Tsay, S.-C., and DeFelice, T.: Cloud characterization and clear sky correction from Landsat 7, Remote Sens. Environ., 78, 83–98, 2001. Cahalan, R. F., Oreopoulos, L., Marshak, A., Evans, K. F., Davis,
A. B., et al.: The International Intercomparison of 3-D Radiation Codes (I3RC): Bringing together the most advanced radiative transfer tools for cloudy atmospheres, B. Am. Meteorol. Soc., 86, 1275–1293, 2005.
Chiu, J. C., Marshak, A., Knyazikhin, Y., Pilewski, P., and Wis-combe, W. J.: Physical interpretation of the spectral radiative signature in the transition zone between cloud-free and cloudy regions, Atmos. Chem. Phys., 9, 1419–1430, doi:10.5194/acp-9-1419-2009, 2009.
Coddington, O., Schmidt, K. S., Pilewskie, P., Gore, W. J., Bergstrom, R. W., Rom´an, M., Redemann, J., Russell, P. B., Liu, J., and Schaaf, C. C.: Aircraft measurements of spectral surface albedo and its consistency with ground-based and space-borne observations, J. Geophys. Res., 113, D17209, doi:10.1029/2008JD010089, 2008.
Davis, A., Marshak, A., Wiscombe, W., and Cahalan, R.: Multi-fractal characterizations of nonstationarity and intermittency in geophysical fields: Observed, retrieved, or simulated, J. Geo-phys.Res., 99, 8055–8072, 1994.
Hair, J. W., Hostetler, C. A., Cook, A. L., Harper, D. B., Ferrare, R. A., Mack, T. L., Welch, W., Izquierdo, L. R., and Hovis, F. E.: Airborne High Spectral Resolution Lidar for profiling aerosol optical properties, Appl. Optics, 47, 6734–6752, 2008.
Harrison, L. and Michalsky, J.: Objective algorithms for the re-trieval of optical depths from ground-based measurements, Appl. Optics, 33, 5126–5132, 1994.
Kassianov, E., Ovchinnikov, M., Berg, L. K., McFarlane, S. A., and Flynn, C.: Retrieval of aerosol optical depth in vicinity of broken clouds from reflectance ratios: Sensitivity study, J. Quant. Spectrosc. Ra., 110, 1677–1689, 2009.
Kassianov, E. and Kogan, Y. L.: Spectral Dependence of Radia-tive Horizontal Transport in Stratocumulus Clouds and Its Ef-fect on Near-IR Absorption, J. Geophys. Res., 107(D23), 4712, doi:10.1029/2002JD002103, 2002.
Kassianov, E. I., Barnard, J. C., and Ackerman, T. P.: Retrieval of Aerosol Microphysical Properties Using Surface MultiFil-ter Rotating Shadowband RadiomeMultiFil-ter (MFRSR) Data: Mod-eling and Observations, J. Geophys. Res., 110(D9), D09201, doi:10.1029/2004JD005337, 2005.
Kassianov, E. I., Flynn, C. J., Ackerman, T. P., and Barnard, J. C.: Aerosol single-scattering albedo and asymmetry parameter from MFRSR observations during the ARM Aerosol IOP 2003, At-mos. Chem. Phys., 7, 3341–3351, doi:10.5194/acp-7-3341-2007, 2007.
Kassianov, E. and Ovtchinnikov, M.: On reflectance ratios and aerosol optical depth retrieval in the presence of cumulus clouds, Geophys. Res. Lett., 35, L06807, doi:10.1029/2008GL033231, 2008.
Katsev, I. L., Prikhach, A. S., Zege, E. P., Grudo, J. O., and Kokhanovsky, A. A.: Speeding up the AOT retrieval procedure using RTT analytical solutions: FAR code, Atmos. Meas. Tech. Discuss., 3, 1645–1705, doi:10.5194/amtd-3-1645-2010, 2010. King, M. D., Menzel, W. P., Grant, P. S., Myers, J. S., Arnold,
Ocean. Tech., 13, 777–794, 1996.
King, M. D., Platnick, S., Wind, G., Arnold, G. T., and Dominguez, R. T.: Remote sensing of radiative and microphysical prop-erties of clouds during TC4: Results from MAS, MAS-TER, MODIS, and MISR, J. Geophys. Res., 115, D00J07, doi:10.1029/2009JD013277, 2010.
Knobelspiesse, K. D., Cairns, B., Schmid, B., Rom´an, M. O., and Schaaf, C. B.: Surface BRDF estimation from an aircraft compared to MODIS and ground estimates at the Southern Great Plains site, J. Geophys. Res., 113, D20105, doi:10.1029/2008JD010062, 2008.
Kobayashi, T., Masuda, K., Sasaki, M., and Mueller, J.: Monte Carlo simulations of enhanced visible radiance in clear-air satel-lite fields of view near clouds, J. Geophys. Res., 105, 26569– 26576, 2000.
Kokhanovsky, A. A. and de Leeuw, G.: Satellite Aerosol Remote Sensing over Land, Praxis Publishing, UK, 388 pp., 2009. Kokhanovsky, A. A., Deuz´e, J. L., Diner, D. J., Dubovik, O., Ducos,
F., Emde, C., Garay, M. J., Grainger, R. G., Heckel, A., Herman, M., Katsev, I. L., Keller, J., Levy, R., North, P. R. J., Prikhach, A. S., Rozanov, V. V., Sayer, A. M., Ota, Y., Tanr´e, D., Thomas, G. E., and Zege, E. P.: The inter-comparison of major satellite aerosol retrieval algorithms using simulated intensity and polar-ization characteristics of reflected light, Atmos. Meas. Tech., 3, 909–932, doi:10.5194/amt-3-909-2010, 2010.
Liou, K. N.: Radiation and Cloud Processes in the Atmosphere, Oxford Univ. Press, New York, 1992.
Litvinov, P., Hasekamp, O., Cairns, B., and Mishchenko, M.: Re-flection models for soil and vegetation surfaces from multiple-viewing angle photopolarimetric measurements. J. Quant. Spec-trosc. Ra., 111, 529–539, 2010.
Loeb, N. G. and Schuster, G. L.: An observational study of the relationship between cloud, aerosol and meteorology in bro-ken low-level cloud conditions, J. Geophys. Res., 113, D14214, doi:10.1029/2007JD009763, 2008.
Luo, Y., Trishchenko, A., Latifovic, R., and Li, Z.: Surface bidi-rectional reflectance and albedo properties derived using a land cover-based approach with Moderate Resolution Imaging Spec-troradiometer observations, J. Geophys. Res., 110, D01106, doi:10.1029/2004JD004741, 2005.
Marchuk, G., Mikhailov, G., Nazaraliev, M., Darbinjan, R., Kargin, B., and Elepov, B.: The Monte Carlo Methods in Atmospheric Optics, Springer-Verlag, 208 pp., 1980.
Marshak, A., Wen, G., Coakley, J., Remer, L., Loeb, N., and Caha-lan, R.: A simple model for the cloud adjacency effect and the apparent bluing of aerosols near clouds, J. Geophys. Res., 113, D14S17, doi:10.1029/2007JD009196, 2008.
Matheson, M. A., Coakley, J. A., and Tahnk, W. R.: Aerosol and cloud property relationships for summertime stratiform clouds in the northeastern Atlantic from Advanced Very High Resolu-tion Radiometer observaResolu-tions, J. Geophys. Res., 110, D24204, doi:10.1029/2005JD006165, 2005.
Michalsky, J., Min, Q., Barnard, J., Marchand, R., and Pilewskie, P.: Simultaneous spectral albedo measurements near the Atmospheric Radiation Measurement Southern Great Plains (ARM SGP) central facility, J. Geophys. Res., 108, 4254, doi:10.1029/2002JD002906, 2003.
Michalsky, J. J., Anderson, G. P., Barnard, J., Delamere, J., Guey-mard, C., Kato, S., Kiedron, P., McComiskey, A., and Ricchiazzi,
P.: Shortwave radiative closure studies for clear skies dur-ing the Atmospheric Radiation Measurement 2003 Aerosol In-tensive Observation Period, J. Geophys. Res., 111, D14S90, doi:10.1029/2005JD006341, 2006.
Miller, M. A., Avissar, R., Berg, L., Edgerton, S., Fischer, M., et al.: SGP Cloud and Land Surface Interaction Campaigns (CLASIC), US Department of Energy, DOE/SC-ARM-0703, 14 pp., 2007. Mishchenko, M. I., Geogdzhayev, I. V., Liu, L., Lacis, A. A.,
Cairns, B., and Travis, L. D.: Toward unified satellite climatol-ogy of aerosol properties: What do fully compatible MODIS and MISR aerosol pixels tell us?, J. Quant. Spectrosc. Ra., 110, 402– 408, 2009.
Mishchenko, M. I., Liu, L., Geogdzhayev, I. V., Travis, L. D., Cairns, B., and Lacis, A. A.: Toward unified satellite clima-tology of aerosol properties. 3. MODIS versus MISR versus AERONET, J. Quant. Spectrosc. Ra., 111, 540–552, 2010. Molina, L. T., Madronich, S., Gaffney, J. S., Apel, E., de Foy, B.,
Fast, J., Ferrare, R., Herndon, S., Jimenez, J. L., Lamb, B., Osornio-Vargas, A. R., Russell, P., Schauer, J. J., Stevens, P. S., Volkamer, R., and Zavala, M.: An overview of the MILA-GRO 2006 Campaign: Mexico City emissions and their trans-port and transformation, Atmos. Chem. Phys., 10, 8697–8760, doi:10.5194/acp-10-8697-2010, 2010.
Nikolaeva, O. V., Bass, L. P., Germogenova, T. A., Kokhanovisky, A. A., Kuznetsov, V. S., and Mayer, B.: The influence of neigh-boring clouds on the clear sky reflectance with the 3-D transport code RADUGA, J. Quant. Spectrosc. Ra., 94, 405–424, 2005. Ovtchinnikov, M. and Ghan, S. J.: Parallel simulations of
aerosol influence on clouds using a cloud-resolving model and a single column model, J. Geophys. Res., 110, D15S10, doi:10.1029/2004JD005088, 2005.
Redemann, J., Zhang, Q., Russell, P. B., Livingston, J. M., and Remer, L. A.: Case studies of aerosol remote sensing in the vicinity of clouds, J. Geophys. Res., 114, D06209, doi:10.1029/2008JD010774, 2009.
Remer, L. A., Kaufman, Y. J., Tanre, D., Mattoo, S., Chu, D. A., et al.: The MODIS aerosol algorithm, products and validation, J. Atmos. Sci., 62, 947–973, 2005.
Rogers, R. R., Hair, J. W., Hostetler, C. A., Ferrare, R. A., Obland, M. D., Cook, A. L., Harper, D. B., Burton, S. P., Shinozuka, Y., McNaughton, C. S., Clarke, A. D., Redemann, J., Russell, P. B., Livingston, J. M., and Kleinman, L. I.: NASA LaRC airborne high spectral resolution lidar aerosol measurements during MI-LAGRO: observations and validation, Atmos. Chem. Phys., 9, 4811–4826, doi:10.5194/acp-9-4811-2009, 2009.
Sheridan, P. J., Delene, D. J., and Ogren, J. A.: Four years of contin-uous surface aerosol measurments from the Department of En-ergy’s Atmospheric Radiation Measurement Program Southern Great Plains Cloud and Radiation Testbed site, J. Geophy. Res., 106, 20735–20747, 2001.
Small, J. D., Chuang, P. Y., Feingold, G., and Jiang, H.: Can aerosol decrease cloud lifetime?, Geophys. Res. Lett., 36, L16806, doi:10.1029/2009GL038888, 2009.
Stephens, G. L., Vane, D. G., Boain, R. J., Mace, G. G., Sassen, K., et al.: The CLOUDSAT mission and the A-train, B. Am. Meteorol. Soc., 83, 1771–1790, 2002.
Su, W., Schuster, G. L., Loeb, N. G., Rogers, R. R., Fer-rare, R. A., Hostetler, C. A., Hair, J. W., and Obland, M. D.: Aerosol and cloud interaction observed from high spec-tral resolution lidar data, J. Geophys. Res., 113, D24202, doi:10.1029/2008JD010588, 2008.
Tackett, J. L. and Di Girolamo, L.: Enhanced aerosol backscatter adjacent to tropical trade wind clouds revealed by satellite-based lidar, Geophys. Res. Lett., 36, L14804, doi:10.1029/2009GL039264, 2009.
Twohy, C. H., Coakley Jr., J. A., and Tahnk, W. R.: Effect of changes in relative humidity on aerosol scattering near clouds, J. Geophys. Res., 114, D05205, doi:10.1029/2008JD010991, 2009. Twomey, S.: The influence of pollution on the shortwave albedo of
clouds, J. Atmos. Sci. 34, 1149–1152, 1977.
V´arnai, T. and Marshak, A.: MODIS observations of enhanced clear sky reflectance near clouds, Geophys. Res. Lett., 36, L06807, doi:10.1029/2008GL037089, 2009.
von Hoyningen-Huene, W., Freitag, M., and Burrows, J. B.: Re-trieval of aerosol optical thickness over land surfaces from top-of-atmosphere radiance, J. Geophys. Res., 108, 4260, doi:10.1029/2001JD002018, 2003.
Waquet, F., Cairns, B., Knobelspiesse, K., Chowdhary, J., Travis, L. D., Schmid, B., and Mishchenko, M. I.: Polarimetric remote sensing of aerosols over land, J. Geophys. Res., 114, D01206, doi:10.1029/2008JD010619, 2009.
Warner, J.: A reduction in rainfall associated with smoke from sug-arcane fires – And inadvertent weather modification?, J. Appl. Meteorol., 7, 247–251, 1968.
Wen, G., Marshak, A., and Cahalan, R.: Impact of 3-D clouds on clear sky reflectance and aerosol retrieval in a biomass burn-ing region of Brazil, Geosci. Remote Sens. Lett., 3, 169–172, doi:10.1109/LGRS.2005.861386, 2006.
Wen, G., Marshak, A., Cahalan, R., Remer, L., and Kleidman, R.: 3-D aerosol-cloud radiative interaction observed in collocated MODIS and ASTER images of cumulus cloud fields, J. Geophys. Res., 112, D13204, doi:10.1029/2006JD008267, 2007.
Wen, G., Marshak, A., and Cahalan, R. F.: Importance of molecular Rayleigh scattering in the enhancement of clear sky reflectance in the vicinity of boundary layer cumulus clouds, J. Geophys. Res., 113, D24207, doi:10.1029/2008JD010592, 2008.
Yang, F., Mitchell, K., Hou, Y. T., Dai, Y., Zeng, X., Wang, Z., and Liang, X. Z.: Dependence of Land Surface Albedo on So-lar Zenith Angle: Observations and Model Parameterization, J. Appl. Meteorol. Clim., 47, 2963–2982, 2008.
Yang, Y. and Di Girolamo, L.: Impacts of 3-D radiative effects on satellite cloud detection and their consequences on cloud frac-tion and aerosol optical depth retrievals, J. Geophys. Res., 113, D04213, doi:10.1029/2007JD009095, 2008.