ACPD
9, 20853–20880, 2009Absorbing aerosols in cloudy skies
K. Peters et al.
Title Page
Abstract Introduction
Conclusions References
Tables Figures
◭ ◮
◭ ◮
Back Close
Full Screen / Esc
Printer-friendly Version
Interactive Discussion Atmos. Chem. Phys. Discuss., 9, 20853–20880, 2009
www.atmos-chem-phys-discuss.net/9/20853/2009/ © Author(s) 2009. This work is distributed under the Creative Commons Attribution 3.0 License.
Atmospheric Chemistry and Physics Discussions
This discussion paper is/has been under review for the journalAtmospheric Chemistry and Physics (ACP). Please refer to the corresponding final paper inACPif available.
E
ff
ects of absorbing aerosols in cloudy
skies: a satellite study over the Atlantic
Ocean
K. Peters1,2, J. Quaas1, and N. Bellouin3
1
Max Planck Institute for Meteorology, Hamburg, Germany
2
University of Hamburg, Hamburg, Germany
3
Hadley Centre, Met Office, Exeter, UK
Received: 25 August 2009 – Accepted: 13 September 2009 – Published: 2 October 2009 Correspondence to: K. Peters (karsten.peters@zmaw.de)
ACPD
9, 20853–20880, 2009Absorbing aerosols in cloudy skies
K. Peters et al.
Title Page
Abstract Introduction
Conclusions References
Tables Figures
◭ ◮
◭ ◮
Back Close
Full Screen / Esc
Printer-friendly Version
Interactive Discussion Abstract
Aerosol effects, direct as well as indirect, constitute one of the biggest sources of uncer-tainty when it comes to quantifying human forcing of climate change. Understanding these will thus increase the credibility of climate predictions. This study focuses on aerosol effects when absorbing aerosols reside in cloudy skies. In cloudfree condi-5
tions, aerosols usually exert a negative radiative forcing (RF) at the top of the atmo-sphere (TOA) due to their scattering properties. When located above clouds, absorbing aerosols can reduce the shortwave local planetary albedoα, resulting in an often sig-nificant local positive direct radiative forcing (DRF). A method for deriving the aerosol radiative effects of absorbing aerosols in cloudy situations from satellite retrievals is 10
presented. Data of 2005 and 2006 from various sensors aboard satellites of the “A-Train” constellation, restricted to the tropical and subtropical Atlantic ocean, is used. A multiple linear regression is performed to identify the dependence of α in cloudy scenes on cloud liquid water path (LWP) and aerosol optical depth (AOD), using the OMI UV-Aerosolindex (UV-AI) as an indicator for absorbing aerosols. The results show 15
an increase of α with increasing aerosol load, and a relative decrease of α with in-creasing amount of absorbing aerosols in cloudy scenes. This allows to derive the direct aerosol effect of absorbing aerosols above clouds, with the effect of aerosol ab-sorption over clouds in the Atlantic contributing+0.08±1.2×10⁻³ Wm−2 to the global TOA RF.
20
1 Introduction
Aerosols are an important constituent of the climate system due to their effect on the radiation budget of the atmosphere. Aerosols can interact with radiation directly, by ab-sorption and scattering ( ˚Angstr ¨om, 1962; McCormick and Ludwig, 1967), or indirectly through the modification of cloud microphysical properties (Twomey, 1974; Devasthale 25
ACPD
9, 20853–20880, 2009Absorbing aerosols in cloudy skies
K. Peters et al.
Title Page
Abstract Introduction
Conclusions References
Tables Figures
◭ ◮
◭ ◮
Back Close
Full Screen / Esc
Printer-friendly Version
Interactive Discussion 1989; Pincus and Baker, 1994). Absorbing aerosols have been found to exert a
so-called semi-direct effect, altering the average cloud fraction by locally heating cloud-and near-cloud air layers (Hansen et al., 1997; Johnson et al., 2004). Understcloud-anding the underlying mechanisms of the climate system and its change under anthropogenic influence is a big challenge. Assessing the role of aerosols in this system has been 5
a major effort by measurement campaigns as well as remote sensing and modelling studies. Nevertheless, the exact mechanisms and effects of aerosols on climate are still not well understood. This results in large uncertainties when quantifying anthro-pogenic radiative forcing of climate change (IPCC, 2007). The aim of this study is to in-vestigate the radiative forcing at the top of the atmosphere (TOA) of absorbing aerosols 10
in cloudy situations. Analysis will be performed by means of satellite retrievals for the Atlantic ocean region. The single scattering albedo (SSA)ω0is the ratio of scattering to total extinction. Even for highly absorbing aerosol (withω0as low as 0.8), scattering dominates extinction in the visible spectral range. In clear sky conditions, even strongly absorbing aerosols usually impose a negative TOA DRF over oceanic regions due to 15
the dark underlying surface. An observer from space would see this as an apparent “brightening” of the overall scene. Increase of the underlying surface albedo, such as clouds residing below aerosols, alters the appearance of this scene from space quite remarkably: for absorbing aerosol, a reduction of brightness, a darkening, of the overall scene would be observed from space, implying a positive TOA DRF. In this case, the 20
absorption of the particle dominates the scattering for the net TOA effect. Therefore, the net TOA radiative effect of a specific absorbing aerosol depends on the underlying surface albedo. Previous measurement and modeling studies of these situations con-firm this deduction, mainly using a cloud layer underlying aerosols as a proxy for high surface albedo. Liao and Seinfeld (1998a,b) have shown, by use of a one-dimensional 25
over-ACPD
9, 20853–20880, 2009Absorbing aerosols in cloudy skies
K. Peters et al.
Title Page
Abstract Introduction
Conclusions References
Tables Figures
◭ ◮
◭ ◮
Back Close
Full Screen / Esc
Printer-friendly Version
Interactive Discussion lying a cloud layer. Emphasis is put on the vertical distribution of clouds and aerosols
in GCM calculations to correctly infer anthropogenic DRF. Keil and Haywood (2003) used field measurements of the SAFARI-2000 campaign to calculate DRF of biomass burning aerosol residing above closed stratocumulus decks off the coast of Namibia and Angola. Assuming no effect of the aerosol on the clouds themselves, the pres-5
ence of clouds converted the original negative TOA DRF to a positive one of nearly the same magnitude (from−13.0 Wm−2 to +11.5 Wm−2). Using satellite retrievals only, Stammes et al. (2008) investigated the same region with respect to absorbing aerosol presence in cloudy scenes. A shortwave heating of the atmosphere in the range of 0 to+80 Wm−2, with a mean of+35 Wm−2, is found by comparing reflectance spectra 10
of clean and polluted scenes. Most recently, Chand et al. (2009) studied the same re-gion by combining data measured from different satellite sensors and radiative transfer calculations to infer a more thorough picture of the radiative forcing (RF) patterns for the period of July–October 2006 and 2007. They found that the sign of DRF exerted by absorbing aerosols above clouds depends on cloud fraction, with the forcing being 15
positive and up to+12 Wm−2on regional scales. The critical cloud fraction is proposed to be about 0.4, with positive forcing occurring for larger values. Satellite data nowa-days offer the opportunity to investigate global distributions of aerosols and clouds on long temporal timescales. Measurements of instruments on satellites in the “A-Train” constellation (Stephens et al., 2002; Anderson et al., 2005) yield excellent coincidence 20
in time and space. In this study, data from four different instruments of the A-Train constellation are combined. The data used in this study is presented in Sect. 2. The method and results of deriving a quantitative relationship of cloudy sceneα and AOD are presented and discussed in Sect. 3. Method and results of the radiative forcing calculations are shown and discussed in Sect. 4. Finally, the results are summarised 25
ACPD
9, 20853–20880, 2009Absorbing aerosols in cloudy skies
K. Peters et al.
Title Page
Abstract Introduction
Conclusions References
Tables Figures
◭ ◮
◭ ◮
Back Close
Full Screen / Esc
Printer-friendly Version
Interactive Discussion 2 Data
The A-Train satellite constellation currently consists of five satellites which orbit the Earth in formation (Stephens et al., 2002; Anderson et al., 2005), where the time dif-ference between the first satellite, EOS (Earth Observing System) Aqua, and the last satellite, EOS Aura, is eight minutes. One main advantage of the A-Train is the possi-5
bility of combining all measured data due to the collocation in time and space. The aim of this study is to combine measurements of cloud, aerosol and radiative properties to then derive the TOA RF of absorbing aerosols in cloudy scenes. Data covering the Atlantic Ocean from 35◦N to 30◦S at a resolution of 0.25◦×0.25◦ for the years 2005 and 2006 are used. The data products of the A-Train constellation used in this study 10
are introduced in the following. 2.1 MODIS
MODIS (MODerate resolution Imaging Spectrometer) on EOS Aqua measures the up-welling radiance in 36 channels within the spectral range from 0.44 to 15µm. Due to its wide swath, it is possible to achieve global coverage almost every day. Seven of the 15
MODIS channels, in the spectral range from 0.47 to 2.13µm, can be used to obtain aerosol optical properties in cloud free ocean as well as over suited land scenes (King et al., 1992; Kaufman et al., 1997; Tanr ´e et al., 1997; Yu et al., 2006). Measurements of the AOD over cloud-free oceans allow for a precision of±0.03±0.05τ, mainly due to assumptions made in the radiative transfer model applied. The retrieval algorithm ad-20
ditionally provides the AOD fine-mode fraction which is that part of the extinction which can be associated to small particles. The MODIS data products used in this study are theMYD08 D3andMYDATML2collection 5 datasets as obtained from the MODIS website (NASA MODIS). AOD in this study is from theMYD08 D3daily Level3 product on a 1◦×1◦grid. For the further analysis, the data is interpolated to 0.25◦×0.25◦. The 25
ACPD
9, 20853–20880, 2009Absorbing aerosols in cloudy skies
K. Peters et al.
Title Page
Abstract Introduction
Conclusions References
Tables Figures
◭ ◮
◭ ◮
Back Close
Full Screen / Esc
Printer-friendly Version
Interactive Discussion In this study, aerosol properties from the coarse resolution product (MYD08 D3) are
combined with cloud parameters from the finer resolution product, assuming that the aerosol is homogeneously distributed in a 1◦×1◦grid box. Variations in aerosol prop-erties, in contrast to cloud propprop-erties, tend to occur on spatial scales spanning a few hundred kilometres, especially over oceans (Anderson et al., 2003). Therefore, reduc-5
tion of resolution of the aerosol compared to the cloud data will not introduce significant uncertainties in the analysis.
2.2 AMSR-E
AMSR-E (Advanced Microwave Scanning Radiometer – Earth Observing System; Kawanishi et al., 2003) is installed on EOS Aqua and provides global passive mi-10
crowave measurements. Horizontally and vertically polarised brightness temperatures are measured in six channels, from 6.9 GHz to 89.0 GHz and the spatial resolution varies from 5.4 km at 89 GHz to 56 km at 6.9 GHz. Important for this study is the deriva-tion of the cloud liquid water path (LWP) from AMSR-E measurements at 36.5 GHz (Wentz, 1997). The data used is gridded onto a global 0.25◦×0.25◦grid and obtained 15
from the websitewww.remss.com. 2.3 CERES
CERES (Clouds and the Earth’s Radiant Energy System; Wielicki et al., 1996; Loeb and Manalo-Smith, 2005) is an instrument aboard EOS Aqua and is designed to mea-sure the upwelling short- and longwave radiation at about 20×20 km2horizontal reso-20
lution. The measured radiances are converted into TOA fluxes as a function of viewing-and solar zenith angles by the use of Angular Distribution Models (ADMs) viewing-and al-low for a detailed computation of the Earth’s radiation budget. The CERES dataset used in this study is the single-scanner-footprint (SSF) productCER SSF Aqua-FM3-MODIS Edition2A. This Level2 dataset is a combination of MODIS and CERES mea-25
ACPD
9, 20853–20880, 2009Absorbing aerosols in cloudy skies
K. Peters et al.
Title Page
Abstract Introduction
Conclusions References
Tables Figures
◭ ◮
◭ ◮
Back Close
Full Screen / Esc
Printer-friendly Version
Interactive Discussion 5µm), upwelling shortwave radiative flux at TOA (CERES SW TOA flux - upwards),
which we convert into local planetary albedo α by relating the outgoing shortwave flux to the expected instantaneous incoming solar insolation computed by use of the CERES measured solar zenith angle at the surface, the eccentricity of Earth’s orbit and a solar constant of 1365 Wm−2. The data is, like the MODIS Level2 data, gridded onto 5
a 0.25◦×0.25◦global grid. 2.4 OMI
OMI (Ozone Monitoring Instrument) is a spectrally highly resolving spectrometer in-stalled on EOS Aura which is capable of measuring radiation in the UV and visible spectral range (0.27–0.5µm) reflected by the Earth System. It is the follow-up of TOMS 10
(Total Ozone Mapping Spectrometer; Heath et al., 1975), has a swath width of 2600 km and offers nearly daily global coverage with a spatial resolution ranging from 13×24 km2 to 28×150 km2. The main advantage of OMI for this study is, that aerosol properties can be derived from its measurements in the UV spectral range also in cloudy scenes. Retrieval algorithms originally developed for TOMS are used to derive the so-called 15
UV-Aerosol Index (UV-AI) (Torres et al., 1998; de Graaf et al., 2005). The properties of this index are important in the context of this study and will be explained later in the text. The UV-AI is taken from theOMAERUVG v003dataset, which is a gridded dataset supplying all measurements falling into a 0.25◦×0.25◦gridbox (Leonard, 2008). For further processing, the simple mean of all measurements in one grid box is calcu-20
lated.
2.4.1 The UV-AI
The UV-AI is a semi-quantative measure allowing for sampling of radiative properties of aerosols in the UV. It is derived by relating the measured upwelling radiances at two wavelengths in the UV (342.5 and 388 nm for OMI; Levelt et al., 2002) to those 25
ACPD
9, 20853–20880, 2009Absorbing aerosols in cloudy skies
K. Peters et al.
Title Page
Abstract Introduction
Conclusions References
Tables Figures
◭ ◮
◭ ◮
Back Close
Full Screen / Esc
Printer-friendly Version
Interactive Discussion et al., 1998; de Graaf et al., 2005). Radiative transfer calculations show that the UV-AI
takes positive values for absorbing aerosol, negative values for non-absorbing aerosol and zero for clouds or purely molecular scattering (Torres et al., 1998; de Graaf et al., 2005). An advantage of the UV-AI is that it allows to detect the absorption due to the presence of the aerosol layer independently from the brightness of the overall scene 5
in the visible spectral range. Thus it is possible to detect absorbing aerosols over and in clouds as well as over snow- or ice-covered land surfaces (Levelt et al., 2002; Torres et al., 2007). It is interesting to investigate whether a proportionality between the UV-AI and AOD over ocean areas exists. AOD and UV-AI correlate very well when investigating situations with just one prevailing aerosol type and near homogeneous 10
surface brightness (desert dust, biomass burning smoke; Hsu et al., 1999), as the UV-AI explicitly depends on aerosol species, the height above the underlying surface (or cloud) as well as on the overall brightness of the observed scene (Torres et al., 1998; de Graaf et al., 2005). The same is found by Christopher et al. (2008) who additionally find the correlation between AOD and UV-AI getting significantly weaker over oceanic 15
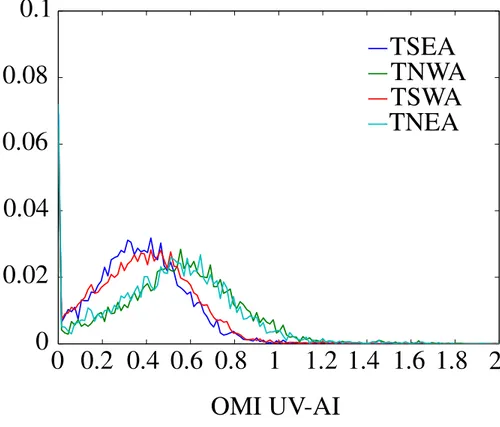
areas due to mixing of aerosol types. Results of this study shown in Fig. 1 support these findings. According to theory, the UV-AI should be close to unity for very low AOD values. Histograms for the regions of interest (see Fig. 2 and Table 1 for region definitions) are displayed in Fig. 1, where the number of measurements in each UV-AI bin (∆UV-AI=0.015) is plotted. The PDs in Fig. 1 show a peak at 0≤UV-AI<0.015, but 20
also a large number of measurements falling into the range of 0.1≤UV-AI<0.7. Thus, in accordance with Torres et al. (1998); de Graaf et al. (2005) and Christopher et al. (2008), it is not possible to infer a quantitative relationship between measured AOD and UV-AI values when the aerosol species observed cannot be characterised. Here, uncertainties for low aerosol burdens with the former possibly stemming from mixing of 25
ACPD
9, 20853–20880, 2009Absorbing aerosols in cloudy skies
K. Peters et al.
Title Page
Abstract Introduction
Conclusions References
Tables Figures
◭ ◮
◭ ◮
Back Close
Full Screen / Esc
Printer-friendly Version
Interactive Discussion Sensitivity of the UV-AI to key parameters
As mentioned above, the UV-AI is dependent on a number of boundary conditions. de Graaf et al. (2005) show calculations of the sensitivity of the UV-AI to parameters such as the solar zenith angle or the surface albedo. Using aerosol layer parameters representative for naturally occurring conditions, the UV-AI shows a strong dependence 5
on the surface albedo for high solar zenith angles. The UV-AI can thus only be consid-ered as independent of the surface albedo for solar zenith anglesθ0<45◦. Furthermore, the dependence of the UV-AI on the AOD of the aerosol layer is tested and found to be nearly linear and identical for all calculations withθ0≤60◦. To account for these de-pendencies, the results of de Graaf et al. (2005) therefore lead to the choice of using 10
measurements (of all instruments) with solar zenith anglesθ0≤45◦in the present study, only. Additionally, a restriction concerning the viewing geometry of the OMI instrument is taken into account. Calculations of de Graaf et al. (2005) show, that the value of the UV-AI is dependent on the viewing zenith angle. It is stated, that values of the UV-AI quickly increase with viewing zenith angles>60◦. In combination with the above men-15
tioned threshold for the solar zenith angle, the threshold for the viewing zenith angle is chosen in such a way, that only scenes with a viewing zenith angle of<30◦are allowed for further analysis. The restrictions applied reduce the amount of measurements avail-able for the regression by roughly 15% and it is assured that derived UV-AI values for a large scale aerosol layer of homogeneous properties do not vary significantly within 20
the area observed.
3 Statistical analysis of overcast scenes
3.1 Method
ACPD
9, 20853–20880, 2009Absorbing aerosols in cloudy skies
K. Peters et al.
Title Page
Abstract Introduction
Conclusions References
Tables Figures
◭ ◮
◭ ◮
Back Close
Full Screen / Esc
Printer-friendly Version
Interactive Discussion and subtropical Atlantic Ocean is used to derive statistical relationships between the
aerosol concentration and changes of the local planetary albedoα of a scene. Focus is put to the Atlantic ocean, as this region is often influenced by absorbing aerosol pollution (e.g. Saharan dust and biomass burning). Only oceanic regions are used, since measurements of the LWP from AMSR-E are not available over land. We choose 5
here not to use the CALIOP (Cloud-Aerosol Lidar with Orthogonal Polarization; Kim et al., 2008), since it covers only a very narrow swath, and since examination of the available data products show ambiguous results on cloud and aerosol layers. Never-theless, Chand et al. (2009) have used CALIOP measurements to investigate vertically separated aerosol and cloud layers, assuming aerosol properties being homogeneous 10
in a 5◦×5◦domain. In this study, data from MODIS and OMI is used to check for absorb-ing aerosols in cloudy situations. Cloud properties are taken from the fine resolution MODIS product, AOD from the coarse resolution aggregated MODIS product and the UV-AI from the above mentioned OMI product. It is assumed that AOD retrieved by MODIS in clear parts of a 1◦×1◦grid box of the coarse resolution MODIS product are 15
representative for the entire grid-box and not being subject to significant subgrid scale variability (Anderson et al., 2003). Since we are interested in liquid water clouds, we select scenes overcast with clouds with a cloud top temperature greater than 273.15 K. Then, the AOD and the UV-AI for this scene are used to characterise the aerosol.
Accounting for differences in the aerosol characteristics with respect to geograph-20
ical location is achieved by dividing the tropical and subtropical Atlantic Ocean into different areas. Aerosol characteristics in each area are assumed to be similar on sea-sonal timescales. The classification of areas is displayed in Fig. 2 with the acronyms explained in Table 1.
The relationship between observed α and absorbing aerosol mass is computed by 25
ACPD
9, 20853–20880, 2009Absorbing aerosols in cloudy skies
K. Peters et al.
Title Page
Abstract Introduction
Conclusions References
Tables Figures
◭ ◮
◭ ◮
Back Close
Full Screen / Esc
Printer-friendly Version
Interactive Discussion clouds in terms of the natural logarithm of LWP and AOD by a multiple linear regression
of the form
α=a0+a1ln(LWP)+a2ln(AOD) (1)
withαbeing derived from CERES TOA shortwave flux, LWP the cloud liquid water path from AMSR-E and AOD the aerosol optical depth from the coarse resolution MODIS 5
dataset. All three quantities are derived from independent coincident retrievals. The LWP retrievals in the microwave spectral range are less affected by aerosol radia-tion interacradia-tions than retrievals in the visible spectrum, thus yielding better results for cloud properties in aerosol contaminated scenes (Wilcox et al., 2009; Chellappan and Horv ´ath, 2009). The UV-AI is used for a conditional sampling of the scenes. We 10
choose a threshold value of UV-AI=0.7 to distinguish between absorbing (UV-AI>0.7) and non-absorbing (UV-AI<0.7) aerosols (M. de Graaf, KNMI, personal communica-tion, 2008). The multiple-regression coefficientsa0,a1and a2 are then calculated for the two UV-AI bins for all four regions as follows: In order to get an error estimate, regressions are performed for slabs of 1000 randomly picked measurement triplets (α, 15
LWP and AOD) of each region. We define the regression slope error as the standard deviations of the 10–100 slopes offered by this approach for each of the four regions. Applying this method, possible dependencies on large scale meteorological conditions (e.g. seasonal change in tropical circulation patterns) and intra-regional variations in background conditions are taken into account.
20
3.2 Results
We are interested here in detecting a relationship between the absorbing aerosol con-centrations and changes ofα cloudy situations. The regions investigated in this study are frequently influenced by absorbing aerosols. These aerosols are mainly injected into the atmosphere over land (e.g. desert dust, biomass burning or industrial aerosol) 25
ACPD
9, 20853–20880, 2009Absorbing aerosols in cloudy skies
K. Peters et al.
Title Page
Abstract Introduction
Conclusions References
Tables Figures
◭ ◮
◭ ◮
Back Close
Full Screen / Esc
Printer-friendly Version
Interactive Discussion area covered by the semipermanent stratocumulus decks offthe coast of Namibia and
Angola (region TSEA) can be considered as offering ideal conditions for observing ab-sorbing aerosols above clouds, especially during the biomass burning season (Keil and Haywood, 2003; Haywood et al., 2004; Stammes et al., 2008; Chand et al., 2009). Sim-ilarly, desert dust stemming from the Sahara is very often advected over the Atlantic, 5
leading to high absorbing aerosols loading in the region TNEA. The relative amount of measurements going into the regression analysis displayed in Table 2 shows the frequent occurrence of absorbing aerosols in cloudy scenes in the region of interest. Indeed, the two regions bordering the western coast of Africa, TSEA and TSWA, both show a higher fraction of absorbing aerosol observations than the neighbouring re-10
gions to the west. Region TNEA even shows the majority of all measurements having an UV-AI≥0.7, most certainly stemming to a large extent from desert dust advected over the ocean.
The calculated values for the coefficients a2, along with their respective standard deviations, are shown in Fig. 3. For an UV-AI<0.7,α is found to increase with AOD in 15
all regions except for the region TSEA, where a decrease ofα with AOD is derived. A positive correlation betweenα and AOD for scattering aerosols in cloudy scenes may be attributed to a combination of the aerosol direct effect and the increase in cloud albedo by the aerosol indirect effect. Since we stratify by LWP in the multiple regres-sion, only the Twomey effect (first indirect effect) is considered here. Since the region 20
TSEA is often subject to significant absorbing aerosol pollution (Stammes et al., 2008), the derived reduction ofα for scenes with UV-AI<0.7 hints at frequent occurence of weakly absorbing aerosol dominating over scattering aerosol in this region. Addition-ally, the semipermanent stratocumulus decks topping the marine boundary layer in this region yield very low cloud top heights, making it difficult for the advected aerosol to get 25
entrained (Keil and Haywood, 2003). By this, the indirect aerosol effect, which would lead to a positive coefficienta2like in the other regions, is inhibited.
ACPD
9, 20853–20880, 2009Absorbing aerosols in cloudy skies
K. Peters et al.
Title Page
Abstract Introduction
Conclusions References
Tables Figures
◭ ◮
◭ ◮
Back Close
Full Screen / Esc
Printer-friendly Version
Interactive Discussion cloudy scenes leads to a reduction ofα at TOA especially for aerosols above clouds.
Here, the reduction ofαwith AOD is strongest for the region TNWA, with region TSEA showing just litte less reduction. Region TNEA is subject to the least reduction ofα
in the spectral range measured by CERES. This region is suspected to be heavily influenced by Saharan dust aerosols, which have a significantly higher absorption in 5
the UVA spectral range than in the visible (Bergstrom et al., 2007). A large UV-AI for dust may correspond to only a weak absorption in the visible range, for which α is defined.
4 Radiative forcing calculations
4.1 Method 10
The TOA radiative forcing by anthropogenic absorbing aerosols,Fant, can be computed as
Fant=F¯ ∆αantLCF, (2)
with ¯F being the incoming daily mean TOA solar radiation, LCF the liquid cloud fraction and∆αantthe change in local planetary albedo defined as
15
∆αant=αtot−αnat, (3)
with
αnat=a0+a1ln(LWP)+a2ln (AODtot−AODant), (4) and
αtot=a0+a1ln(LWP)+a2ln(AODtot), (5) 20
ACPD
9, 20853–20880, 2009Absorbing aerosols in cloudy skies
K. Peters et al.
Title Page
Abstract Introduction
Conclusions References
Tables Figures
◭ ◮
◭ ◮
Back Close
Full Screen / Esc
Printer-friendly Version
Interactive Discussion used to derive the coefficientsa0,a1 anda2 in Eq. (1) is used for the forcing
calcula-tions. Firstly, the radiative forcing by all anthropogenic aerosols in scenes overcast with liquid water clouds is computed choosing the regression applicable according to the re-trieved UV-AI. Secondly, the absorption effect by anthropogenic aerosols is separated using a coefficienta2e
ff defined as 5
a2e
ff =a2|≥0.7−a2|<0.7, (6)
witha2|<0.7 and a2|≥0.7 being the calculated coefficients for scenes with an UV-AI<0.7 and ≥0.7, respectively. Only situations influenced by absorbing aerosol, defined by an UV-AI≥0.7, are used for the second setup, with the absorption forcing considered zero in all other scenes.
10
This RF is calculated for each of the regions and seasons described in Table 1. A distinction between seasons is made to distinguish prevailing aerosol types such as the biomass burning season in southern Africa.
4.2 Results
Table 3 presents the resulting yearly averaged total and absorbing RF by anthropogenic 15
aerosols weighted by the area coverage of each region, defined as the fraction of the globe covered by this region.
The regions TNWA, TNEA and TSWA, show negative TOA RF. This suggests that aerosol scattering and the aerosol indirect effect dominate aerosol absorption. The calculated TOA RF for the region TSEA is positive and much larger than the negative 20
forcing of the other regions. Comparing the RF values of the separate regions, the forcing of the subtropical and tropical Atlantic is dominated by region TSEA, suggesting the radiative properties of this region being important even on a global scale. The same holds when considering the results for the effect of just the aerosol absorption. As previous studies of the radiative effects of absorbing aerosols above clouds have 25
ACPD
9, 20853–20880, 2009Absorbing aerosols in cloudy skies
K. Peters et al.
Title Page
Abstract Introduction
Conclusions References
Tables Figures
◭ ◮
◭ ◮
Back Close
Full Screen / Esc
Printer-friendly Version
Interactive Discussion It is evident, that the TOA RF of absorbing aerosols in cloudy scenes in region
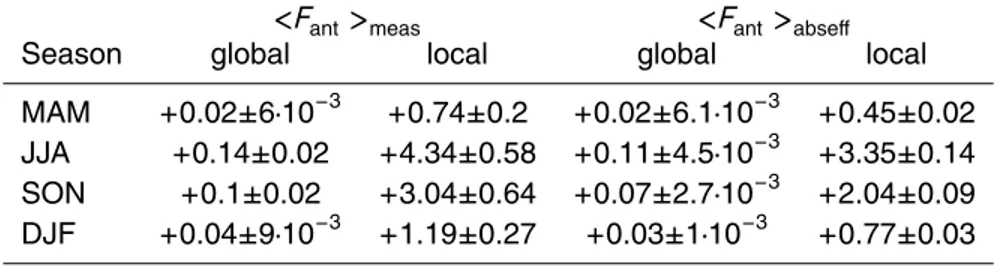
TSEA is subject to a pronounced seasonal cycle, with a distinct maximum occurring during the time of June–November. On a global scale, the TOA RF can reach up to +0.14±0.02 Wm−2. This is, even on a global scale, not negligible regarding the estimates of the direct aerosol effect presented in IPCC (2007), which range from 5
−0.9 Wm−2 to −0.1 Wm−2, with a best estimate of −0.5 Wm−2. Locally, the radia-tive forcing can exceed+40 Wm−2, with a mean regional TOA anthropogenic RF of
+4.34±0.58 Wm−2and+3.04±0.64 Wm−2in season JJA and SON, respectively. The effect of aerosol absorption coming from heavily absorbing aerosols on the TOA RF alone is calculated to account for the largest part of the total TOA RF, especially during 10
the biomass burning season. During months JJA, the effect of aerosol absorption ac-counts for roughly 75% of the total TOA RF. The months June–November correspond to the biomass burning season in southern Africa, giving rise to large scale elevated aerosol layers above the semipermanent stratocumulus decks offthe coast (Keil and Haywood, 2003). Therefore, the change of magnitude in DRF is subject to a pro-15
nounced seasonal cycle. The results found here are consistent with previous studies for the TSEA region (Stammes et al., 2008; Chand et al., 2009; Schulz et al., 2006; Keil and Haywood, 2003; Haywood and Shine, 1997). It should be emphasized that the forcing values presented here are the contribution of the direct and first indirect aerosol effects in cloudy skies. The direct effect in clear skies as well as semi-direct 20
and second indirect effects would need to be taken into account for an estimate of the overall anthropogenic aerosol forcing in the region of interest.
5 Summary and conclusions
This study is aimed at investigating the direct radiative forcing (DRF) of absorbing aerosols in cloudy skies based on spaceborne measurements. A dataset covering 25
ACPD
9, 20853–20880, 2009Absorbing aerosols in cloudy skies
K. Peters et al.
Title Page
Abstract Introduction
Conclusions References
Tables Figures
◭ ◮
◭ ◮
Back Close
Full Screen / Esc
Printer-friendly Version
Interactive Discussion 2002; Anderson et al., 2005), is used to perform a statistical analysis in order to find
a relationship between local planetary albedo α and absorbing aerosol presence in cloudy scenes. A multiple linear regression is performed to derive a statistical expres-sion linkingα derived from CERES to cloud liquid water path (LWP) from AMSR-E and aerosol optical depth (AOD) from MODIS in presence of low-level liquid water clouds 5
as detected by MODIS. We use the UV-Aerosol Index (UV-AI) derived from OMI data as an indicator for absorbing aerosol presence in cloudy scenes. For situations with scattering and only slightly absorbing aerosols (UV-AI<0.7),α increases with AOD in three out of four regions, which is consistent with aerosol scattering and/or an aerosol indirect effect. In scenes with absorbing aerosols (UV-AI >0.7), in all regions, α de-10
creases with AOD, hinting at the effect of aerosol absorption in the cloudy scenes. The relationships are used to infer the RF at the top of the atmosphere (TOA) due to an-thropogenic aerosols. The anan-thropogenic aerosol fraction is taken from the dataset described in Bellouin et al. (2005). The overall forcing is negative in three out of four regions, but positive in the TSEA region. Due to the frequent presence of low-level 15
clouds and the strong α-AOD relationship, this region dominates the anthropogenic forcing in scenes with low-level clouds in the entire region investigated here, which amounts to a contribution to the global annual mean anthropogenic aerosol forcing by+0.05±0.03 Wm−2. Within the TSEA region anthropogenic aerosols exert regional seasonal mean forcings of up to 4 Wm−2in JJA. Concluding, absorbing aerosols exert 20
a strong influence on planetary albedo. The contribution of absorption in cloudy scenes by anthropogenic aerosols in the tropical and subtropical Atlantic ocean region to the global anthropogenic aerosol forcing is estimated at+0.08±1.2×10⁻³.
Acknowledgements. AMSR-E data are produced by Remote Sensing Systems and sponsored by the NASA Earth Science REASoN DISCOVER Project and the AMSR-E Science Team.
25
Data are available atwww.remss.com. Thanks a lot to all the colleagues giving helpful advice throughout the conduction of this study, with special thanks going out to M. de Graaf, H. Grassl,
´
ACPD
9, 20853–20880, 2009Absorbing aerosols in cloudy skies
K. Peters et al.
Title Page
Abstract Introduction
Conclusions References
Tables Figures
◭ ◮
◭ ◮
Back Close
Full Screen / Esc
Printer-friendly Version
Interactive Discussion
The service charges for this open access publication have been covered by the Max Planck Society.
References
Albrecht, B. A.: Aerosols, Cloud Microphysics, and Fractional Cloudiness, Science, 245, 1227– 1230, 1989. 20854
5
Anderson, T. L., Charlson, R. J., Winker, D. M., Ogren, J. A., and Holmen, K.: Mesoscale variations of tropospheric aerosols, J. Atmos. Sci., 60, 119–136, 2003. 20858, 20862 Anderson, T. L., Charlson, R. J., Bellouin, N., Boucher, O., Chin, M., Christopher, S. A.,
Hay-wood, J., Kaufman, Y. J., Kinne, S., Ogren, J. A., Remer, L. A., Takemura, T., Tanr ´e, D., Torres, O., Trepte, C. R., Wielicki, B. A., Winker, D. M., and Yu, H. B.: An “A-Train” strategy
10
for quantifying direct climate forcing by anthropogenic aerosols, B. Am. Meteorol. Soc., 86, 1795–1809, doi:10.1175/BAMS-86-12-1795, 2005. 20856, 20857, 20868
˚
Angstr ¨om, A.: Atmospheric turbidity, global illumination and planetary albedo of the earth, Tellus, 14, 435–450, 1962. 20854
Bellouin, N., Boucher, O., Haywood, J., and Reddy, M. S.: Global estimate of aerosol direct
15
radiative forcing from satellite measurements, Nature, 438, 1138–1141, 2005. 20865, 20868 Bergstrom, R. W., Pilewskie, P., Russell, P. B., Redemann, J., Bond, T. C., Quinn, P. K., and Sierau, B.: Spectral absorption properties of atmospheric aerosols, Atmos. Chem. Phys., 7, 5937–5943, 2007,
http://www.atmos-chem-phys.net/7/5937/2007/. 20865
20
Chand, D., Wood, R., Anderson, T. L., Satheesh, S. K., and Charlson, R. J.: Satellite-derived direct radiative effect of aerosols dependent on cloud cover, Nat. Geosci., 2, 181–184, doi:10.1038/ngeo437, 2009. 20856, 20862, 20864, 20867
Chellappan, S. and Horv ´ath, A.: Global Assessment of AMSR-E and MODIS Cloud Liquid Water Path Retrievals in Warm Oceanic Clouds, J. Geophys. Res., submitted, 2009. 20863
25
Christopher, S. A., Gupta, P., Haywood, J., and Greed, G.: Aerosol optical thicknesses over North Africa: 1. Development of a product for model validation using Ozone Monitoring In-strument, Multiangle Imaging Spectroradiometer, and Aerosol Robotic Network, J. Gephys. Res.-Atmos., 113, D00C04, doi:10.1029/2007JD009446, 2008. 20860
de Graaf, M., Stammes, P., Torres, O., and Koelemeijer, R.: Absorbing Aerosol Index:
ACPD
9, 20853–20880, 2009Absorbing aerosols in cloudy skies
K. Peters et al.
Title Page
Abstract Introduction
Conclusions References
Tables Figures
◭ ◮
◭ ◮
Back Close
Full Screen / Esc
Printer-friendly Version
Interactive Discussion
tivity analysis, application to GOME and comparison with TOMS, J. Geophys. Res.-Atmos., 110, D01201, doi:10.1029/2004JD005178, 2005. 20859, 20860, 20861
Devasthale, A., Kr ¨uger, O., and Grassl, H.: Change in Cloud-Top Temperatures Over Europe, IEEE Geosci. Remote S., 2, 333–336, doi:10.1109/LGRS.2005.851736, 2005. 20854 Devasthale, A., Kruger, O., and Grassl, H.: Impact of ship emissions on cloud properties over
5
coastal areas, Geophys. Res. Lett., 33, L02811, doi:10.1029/2005GL024470, 2006. 20854 Hansen, J., Sato, M., and Ruedy, R.: Radiative forcing and climate response, J. Geophys.
Res.-Atmos., 102, 6831–6864, 1997. 20855
Haywood, J., Osborne, S. R., and Abel, S. J.: The effect of overlying aerosol layers on remote sensing retrievals of cloud effective radius and cloud optical depth, Q. J. Roy. Meteor. Soc.,
10
130, 779–800, 2004. 20864
Haywood, J. M. and Shine, K. P.: Multi-spectral calculations of the direct radiative forcing of tropospheric sulphate and soot aerosols using a column model, Q. J. Roy. Meteor. Soc., 123, 1907–1930, 1997. 20855, 20867
Heath, D., Krueger, A., Roeder, H., and Henderson, B.: Solar backscatter and Ultraviolet and
15
Total Ozone Mapping Spectrometer (SBUV-TOMS) for Nimbus G, Opt. Eng., 14, 323–331, 1975. 20859
Hsu, N., Herman, J., Torres, O., Holben, B., Tanre, D., Eck, T., Smirnov, A., Chatenet, B., and Lavenu, F.: Comparisons of the TOMS aerosol index with Sun-photometer aerosol optical thickness: Results and applications, J. Gephys. Res.-Atmos., 104, 6269–6279, 1999. 20860
20
IPCC: Summary for Policymakers, in: Climate Change 2007: The Physical Science Basis. Contribution of Working Group I to the Fourth Assessment Report of the Intergovernmental Panel on Climate Change, edited by: Solomon, S., Qin, D., Manning, M., Chen, Z., Marquis, M., Averyt, K., M.Tignor, and Miller, H., Cambridge University Press, Cambridge, UK and New York, NY, USA, 2007. 20855, 20867
25
Johnson, B., Shine, K., and Forster, P.: The semi-direct aerosol effect: Impact of ab-sorbing aerosols on marine stratocumulus, Q. J. Roy. Meteor. Soc., 130, 1407–1422, doi:10.1256/qj.03.61, 2004. 20855
Kaufman, Y. J., Tanr ´e, D., Remer, L. A., Vermote, E. F., Chu, A., and Holben, B. N.: Operational remote sensing of tropospheric aerosol over land from EOS moderate resolution imaging
30
spectroradiometer, J. Geophys. Res.-Atmos., 102, 17051–17067, 1997. 20857
ACPD
9, 20853–20880, 2009Absorbing aerosols in cloudy skies
K. Peters et al.
Title Page
Abstract Introduction
Conclusions References
Tables Figures
◭ ◮
◭ ◮
Back Close
Full Screen / Esc
Printer-friendly Version
Interactive Discussion
Observing System (AMSR-E), NASDA’s contribution to the EOS for global energy and wa-ter cycle studies, IEEE T. Geosci. Remote, 41, 184–194, doi:10.1109/TGRS.2002.808331, 2003. 20858
Keil, A. and Haywood, J.: Solar radiative forcing by biomass burning aerosol particles during SAFARI 2000: A case study based on measured aerosol and cloud properties, J. Geophys.
5
Res.-Atmos., 108, 8467, doi:10.1029/2002JHD002315, 2003. 20856, 20864, 20867
Kim, S.-W., Berthier, S., Raut, J.-C., Chazette, P., Dulac, F., and Yoon, S.-C.: Validation of aerosol and cloud layer structures from the space-borne lidar CALIOP using a ground-based lidar in Seoul, Korea, Atmos. Chem. Phys., 8, 3705–3720, 2008,
http://www.atmos-chem-phys.net/8/3705/2008/. 20862
10
King, M. D., Kaufman, Y. J., Menzel, W. P., and Tanr ´e, D.: Remote sensing of cloud, aerosol, and water vapor properties from the Moderate Resolution Imaging Spectrometer (MODIS), IEEE T. Geosci. Remote, 30, 2–27, 1992. 20857
Leonard, P.: OMAERUVG File Specification Version 3, http://disc.sci.gsfc.nasa.gov/Aura/OMI/ omaeruvg v003.shtml, Online; accessed 27 August, 2008, 2008. 20859
15
Levelt, P. F., van den Oord, G. H. J., Hilsenrath, E., Leppelmeier, G. W., and Bhartia, P. K.: OMI Algorithm Theoretical Basis Document, Volume III; Clouds, Aerosols, and Surface UV Irradiance, KNMI, NASA and FMI, 2002. 20859, 20860
Liao, H. and Seinfeld, J.: Effect of clouds on direct aerosol radiative forcing of climate, J. Geo-phys. Res.-Atmos., 103, 3781–3788, 1998a. 20855
20
Liao, H. and Seinfeld, J. H.: Radiative forcing by mineral dust aerosols: sensitivity to key vari-ables, J. Geophys. Res.-Atmos., 103, 31637–31645, 1998b. 20855
Loeb, N. G. and Manalo-Smith, N.: Top-of-atmosphere direct radiative effect of aerosols over global oceans from merged CERES and MODIS observations, J. Climate, 18, 3506–3526, 2005. 20858
25
McCormick, R. A. and Ludwig, J. H.: Climate Modification by Atmospheric Aerosols, Science, 156, 1358–1359, 1967. 20854
NASA MODIS: LAADS Web, http://ladsweb.nascom.nasa.gov/data/search.html, access: sev-eral times 2007 and 2008. 20857
Pincus, R. and Baker, M. B.: Effect of precipitation on the albedo susceptibility of clouds in the
30
marine boundary layer, Nature, 372, 250–252, 1994. 20855
ACPD
9, 20853–20880, 2009Absorbing aerosols in cloudy skies
K. Peters et al.
Title Page
Abstract Introduction
Conclusions References
Tables Figures
◭ ◮
◭ ◮
Back Close
Full Screen / Esc
Printer-friendly Version
Interactive Discussion
Montanaro, V., Myhre, G., Penner, J. E., Pitari, G., Reddy, S., Seland, Ø., Stier, P., and Takemura, T.: Radiative forcing by aerosols as derived from the AeroCom present-day and pre-industrial simulations, Atmos. Chem. Phys., 6, 5225–5246, 2006,
http://www.atmos-chem-phys.net/6/5225/2006/. 20867
Stammes, P., Tilstra, L. G., Braak, R., de Graaf, M., and Aben, E. A. A.: Estimate of Solar
Radia-5
tive Forcing by Polluted Clouds Using OMI and SCIAMACHY Satellite Data, in: CURRENT PROBLEMS IN ATMOSPHERIC RADIATION (IRS 2008): Proceedings of the International Radiation Symposium (IRC/IAMAS), edited by: Nakajima, T. and Yamasoe, M. A., 577–580, Foz do Iguacu, Brazil, 3–8 August 2008, 2008. 20856, 20864, 20867
Stephens, G. L., Vane, D. G., Boain, R. J., Mace, G. G., Sassen, K., Wang, Z. E., Illingworth,
10
A. J., O’Connor, E. J., Rossow, W. B., Durden, S. L., Miller, S. D., Austin, R. T., Benedetti, A., Mitrescu, C., and CloudSat Sci Team: The cloudsat mission and the a-train - A new dimension of space-based observations of clouds and precipitation, B. Am. Meteorol. Soc., 83, 1771–1790, doi:10.1175/BAMS-83-12-1771, 2002. 20856, 20857, 20867
Tanr ´e, D., Kaufman, Y. J., Herman, M., and Mattoo, S.: Remote sensing of aerosol
proper-15
ties over oceans using the MODIS/EOS spectral radiances, J. Geophys. Res.-Atmos., 102, 16971–16988, 1997. 20857
Torres, O., Bhartia, P., Herman, J., Ahmad, Z., and Gleason, J.: Derivation of aerosol proper-ties from satellite measurements of backscattered ultraviolet radiation: Theoretical basis, J. Geophys. Res.-Atmos., 103, 17099–17110, 1998. 20859, 20860
20
Torres, O., Tanskanen, A., Veihelmann, B., Ahn, C., Braak, R., Bhartia, P. K., Veefkind, P., and Levelt, P.: Aerosols and surface UV products from Ozone Monitoring Instrument observa-tions: An overview, J. Geophys. Res.-Atmos., 112, D24S47, doi:10.1029/2007JD008809, 2007. 20860
Twomey, S.: Pollution and the planetary albedo, Atmos. Environ., 8, 1251–1256, 1974. 20854,
25
20862
Wentz, F. J.: A well-calibrated ocean algorithm for special sensor microwave/imager, J. Geo-phys. Res.-Oceans, 102, 8703–8718, 1997. 20858
Wielicki, B. A., Barkstrom, B. R., Harrison, E. F., Lee, R. B., Smith, G. L., and Cooper, J. E.: Clouds and the earth’s radiant energy system (CERES): An earth observing system
experi-30
ment, B. Am. Meteorol. Soc., 77, 853–868, 1996. 20858
us-ACPD
9, 20853–20880, 2009Absorbing aerosols in cloudy skies
K. Peters et al.
Title Page
Abstract Introduction
Conclusions References
Tables Figures
◭ ◮
◭ ◮
Back Close
Full Screen / Esc
Printer-friendly Version
Interactive Discussion
ing two independent retrievals of liquid water path, J. Geophys. Res., 114, D05210, doi:10.1029/2008JD010589, 2009. 20863
Yu, H., Kaufmann, Y. J., Chin, M., Feingold, G., Remer, L. A., Anderson, T. L., Balkanski, Y., Bellouin, N., Boucher, O., Christopher, S., DeCola, P., Kahn, R., Koch, D., Loeb, N., Reddy, M. S., Schulz, M., Takemura, T., and Zhou, M.: A review of measurement-based
5
assessments of the aerosol direct radiative effect and forcing, Atmos. Chem. Phys., 6, 613– 666, 2006,
ACPD
9, 20853–20880, 2009Absorbing aerosols in cloudy skies
K. Peters et al.
Title Page
Abstract Introduction
Conclusions References
Tables Figures
◭ ◮
◭ ◮
Back Close
Full Screen / Esc
Printer-friendly Version
Interactive Discussion
Table 1.Acronyms for the regions displayed in Fig. 2
TNWA tropical northwest Atlantic TNEA tropical northeast Atlantic TSWA tropical southwest Atlantic
TSEA tropical southeast Atlantic DJF December, January, February MAM March, April, May
ACPD
9, 20853–20880, 2009Absorbing aerosols in cloudy skies
K. Peters et al.
Title Page
Abstract Introduction
Conclusions References
Tables Figures
◭ ◮
◭ ◮
Back Close
Full Screen / Esc
Printer-friendly Version
Interactive Discussion
Table 2.Amount of measurements used for the regression analysis in Eq. (1).
ACPD
9, 20853–20880, 2009Absorbing aerosols in cloudy skies
K. Peters et al.
Title Page
Abstract Introduction
Conclusions References
Tables Figures
◭ ◮
◭ ◮
Back Close
Full Screen / Esc
Printer-friendly Version
Interactive Discussion
Table 3. Annual mean global anthropogenic absorbing aerosol RF at TOA in cloudy scenes in Wm−2. < Fant>meas and < Fant>abseff are the results obtained from the reference and the absorption effect calculation, respectively. Results are displayed for the whole subtropical and tropical Atlantic (All regions) as well as for each region separately.
Region <Fant>meas <Fant>abseff
ACPD
9, 20853–20880, 2009Absorbing aerosols in cloudy skies
K. Peters et al.
Title Page
Abstract Introduction
Conclusions References
Tables Figures
◭ ◮
◭ ◮
Back Close
Full Screen / Esc
Printer-friendly Version
Interactive Discussion
Table 4. Anthropogenic absorbing aerosol RF at TOA in cloudy scenes in Wm−2 for region TSEA (see Fig. 2). Results are displayed for different seasons (see Table 1), averaged on global and local scale. <Fant>measand<Fant>abseffare the results obtained from the reference
and the absorption effect calculation, respectively.
<Fant>meas <Fant>abseff
ACPD
9, 20853–20880, 2009Absorbing aerosols in cloudy skies
K. Peters et al.
Title Page
Abstract Introduction
Conclusions References
Tables Figures
◭ ◮
◭ ◮
Back Close
Full Screen / Esc
Printer-friendly Version
Interactive Discussion
0
0.02
0.04
0.06
0.08
0.1
TSEA
TNWA
TSWA
TNEA
0 0.2 0.4 0.6 0.8 1
1.2 1.4 1.6 1.8 2
OMI UV-AI
ACPD
9, 20853–20880, 2009Absorbing aerosols in cloudy skies
K. Peters et al.
Title Page
Abstract Introduction
Conclusions References
Tables Figures
◭ ◮
◭ ◮
Back Close
Full Screen / Esc
Printer-friendly Version
Interactive Discussion
90◦W 60◦W 30◦W 0◦ 30◦E 60◦E
30◦S
15◦S
EQ
15◦N
30◦N
TSEA
TSWA
TNWA
TNEA
ACPD
9, 20853–20880, 2009Absorbing aerosols in cloudy skies
K. Peters et al.
Title Page
Abstract Introduction
Conclusions References
Tables Figures
◭ ◮
◭ ◮
Back Close
Full Screen / Esc
Printer-friendly Version
Interactive Discussion
a
2=
∆
α
∆
ln