www.biogeosciences.net/11/6401/2014/ doi:10.5194/bg-11-6401-2014
© Author(s) 2014. CC Attribution 3.0 License.
Benthic biomass size spectra in shelf and deep-sea sediments
B. A. Kelly-Gerreyn1,*, A. P. Martin1, B. J. Bett1, T. R. Anderson1, J. I. Kaariainen1, C. E. Main1, C. J. Marcinko1, and A. Yool1
1National Oceanography Centre, European Way, Southampton, SO14 3ZH, UK *now at: Bureau of Meteorology, 700 Collins St., Docklands VIC 3008, Australia
Correspondence to:A. P. Martin ([email protected])
Received: 29 November 2013 – Published in Biogeosciences Discuss.: 14 January 2014 Revised: 7 October 2014 – Accepted: 9 October 2014 – Published: 26 November 2014
Abstract.The biomass distributions of marine benthic meta-zoans (meio- to macro-fauna, 1 µg–32 mg wet weight) across three contrasting sites were investigated to test the hy-pothesis that allometry can consistently explain observed trends in biomass spectra. Biomass (and abundance) size spectra were determined from observations made at the Faroe–Shetland Channel (FSC) in the Northeast Atlantic (water depth 1600 m), the Fladen Ground (FG) in the North Sea (150 m), and the hypoxic Oman Margin (OM) in the Arabian Sea (500 m). Observed biomass increased with body size as a power law at FG (scaling exponent,b=0.16) and FSC (b=0.32), but less convincingly at OM (b=0.12 but not significantly different from 0). A simple model was con-structed to represent the same 16 metazoan size classes used for the observed spectra, all reliant on a common detrital food pool, and allowing the three key processes of ingestion, respi-ration and mortality to scale with body size. A micro-genetic algorithm was used to fit the model to observations at the sites. The model accurately reproduces the observed scal-ing without needscal-ing to include the effects of local influences such as hypoxia. Our results suggest that the size-scaling of mortality and ingestion are dominant factors determining the distribution of biomass across the meio- to macrofaunal size range in contrasting marine sediment communities. Both the observations and the model results are broadly in agree-ment with the “metabolic theory of ecology” in predicting a quarter power scaling of biomass across geometric body size classes.
1 Introduction
Marine sediments are sites of long-term removal, via burial, of organic carbon derived from productivity at the ocean sur-face and so play a key role in global biogeochemical cycles. The amount of organic carbon that is buried is determined by the rate of processing by benthic organisms with the major-ity of the settling carbon (the POC flux) respired back to the water column (Pfannkuche et al., 1999). A smaller fraction of the POC flux is incorporated into benthic biomass and the remainder is buried.
environments (Schmidt-Nielsen, 1984; Hildrew et al., 2007). Consequently, the body-size approach may prove useful in studies of benthic communities in both shallow (Blanchard et al., 2009) and deep-sea environments.
The biomass distributions of marine benthic communities were first studied using a size-based approach by Schwing-hamer (1981). He constructed benthic biomass size spectra (BBSS) from six intertidal stations in the Northwest Atlantic and found a “characteristic” trimodal size spectrum (with biomass peaks in the size ranges 0.5–1 µm, 64–125 µm and
>2 mm; corresponding to micro-, meio- and macrofauna, respectively) which was supported by later works (Schwing-hamer, 1983, 1985). In contrast, other studies, primarily in shallow-water locations (Strayer, 1986; Drgas et al., 1998; Duplisea, 2000), found biomass increases that were contin-uous with increasing body size, suggesting that discontinu-ities in biomass distributions could be a result of sampling artefacts (Bett, 2013).
The pioneering work in modelling benthic community biomass distributions was undertaken by Peters (1983). Or-ganisms within the community were assigned to one of five size classes that all fed from the same detritus food pool, and which were parameterized according to four body-size-based processes: ingestion, respiration, egestion and mortal-ity. Peters (1983) applied his model to study pesticide bio-accumulation and showed qualitative similarities with ob-servations reported in the literature (Griesbach et al., 1982). More recently, Rakocinski (2009) applied Peters’ model to investigate hypoxia in subtidal macrofauna. Other biomass size-based approaches have been used to model fisheries impacts on shelf benthic ecosystems (e.g. Blanchard et al., 2009).
Here, we first investigate the biomass size spectra of ben-thic metazoans (1 µg–32 mg) from three contrasting environ-ments: the Northeast Atlantic (Faroe–Shetland Channel – FSC, 1600 m), the North Sea (Fladen Ground – FG, 150 m) and the Arabian Sea (Oman Margin – OM, 500 m). The fac-tors that control the distribution of biomass are then exam-ined using a model that builds on the allometric approach of Peters (1983). To the best of our knowledge, this work is the first application of a numerical model based on allom-etry to the study of biomass distributions in varied marine benthic environments, especially the deep sea. In particular we explore whether a simple allometric model can represent strongly contrasting systems without recourse to invoking specific functional groups or local environmental influences. Our approach contrasts with other benthic modelling efforts, which have focused on elemental flows within sea bed com-munities (van Oevelen et al., 2006a, b)
2 Methods
2.1 Field observations – sample collection and processing
For practical reasons our field study focuses on a restricted size range of metazoans. In total the marine invertebrates may span a range of body lengths from 50 µm (e.g. smallest nematodes) to 50 cm (e.g. large sea cucumbers), some 4 or-ders of magnitude; their corresponding body weights range over 5 ng–5 kg wet weight, 12 orders of magnitude. The largest of the invertebrates (megabenthos) can only be physi-cally sampled effectively by trawls and similar devices which only provide semi-quantitative data at best and their effi-ciency of collecting specimens is distinctly body-size related (Bett, 2001). The smallest invertebrates also pose consider-able difficulties for quantitative study both in terms of their practical handling and visualization and in their separation from sedimentary and detrital particles. We have therefore concentrated on intermediate-sized invertebrates, the meio-and macro-benthos (Table 2), which can be reliably, quantita-tively sampled and readily extracted from sediment samples (Gage and Bett, 2005).
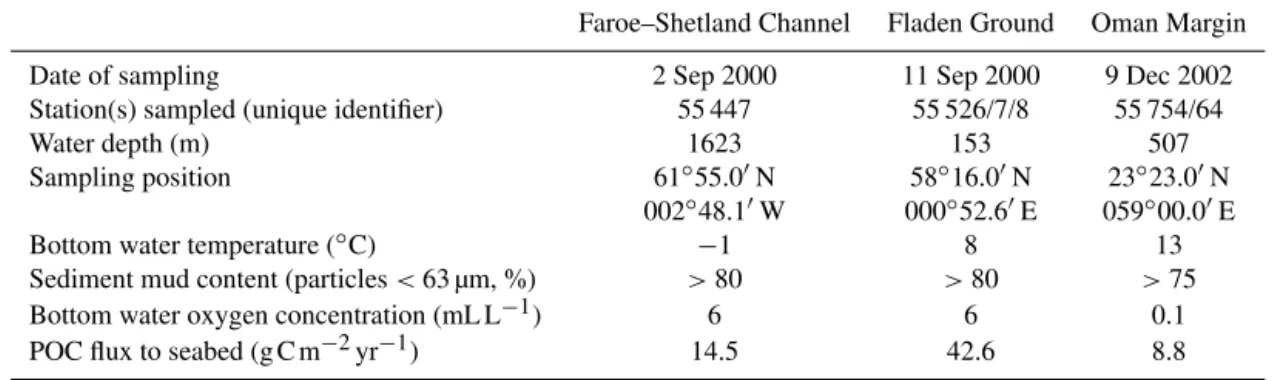
Samples were collected from three contrasting locations in 2000 and 2002: (i) a temperate shelf sea site in the Fladen Ground (FG), North Sea, (ii) an “Arctic” deep-water site in the Faroe–Shetland Channel (FSC), and (iii) a tropical mid-slope oxygen minimum zone site on the Oman Margin (OM), Arabian Sea. Site locations are illustrated in Fig. 1 and basic station data and environmental characteristics for each site are given in Table 1, together with estimates of particulate organic carbon flux to the seabed following the method of Lutz et al. (2007).
The Fladen Ground sampling site lies in the deeper part of the North Sea at the centre of a gyre with bottom water cur-rents which are thought to be slight (<0.25 m s−1; de Wilde
et al., 1986). Fladen Ground is thermally stratified during the summer months when the thermocline can be found between 30 and 70 m. The annual variation in the bottom water tem-perature is small (6–8◦
C, de Wilde et al., 1986).
The sampling site in the FSC lies between the Scottish Continental Shelf and the Faroe Plateau. It is representative of a cold (<0◦
C, Turrell et al., 1999), pristine deep-water habitat at 1600 m depth.
The Arabian Sea sampling site (OM) is characterized by a well-developed oxygen minimum zone (OMZ) that extends from about 100 to 1000 m water depth. The samples were collected from the core of the OMZ (500 m) where the ben-thic communities are subjected to hypoxic conditions (Billett et al., 2006).
Table 1.Station data and environmental characteristics of the three study sites including particulate organic carbon (POC) flux to the seabed estimated following Lutz et al. (2007).
Faroe–Shetland Channel Fladen Ground Oman Margin
Date of sampling 2 Sep 2000 11 Sep 2000 9 Dec 2002
Station(s) sampled (unique identifier) 55 447 55 526/7/8 55 754/64
Water depth (m) 1623 153 507
Sampling position 61◦55.0′N 58◦16.0′N 23◦23.0′N
002◦48.1′W 000◦52.6′E 059◦00.0′E
Bottom water temperature (◦C)
−1 8 13
Sediment mud content (particles<63 µm, %) >80 >80 >75
Bottom water oxygen concentration (mL L−1) 6 6 0.1
POC flux to seabed (g C m−2yr−1) 14.5 42.6 8.8
Figure 1. Chart showing the locations of the three study sites:
Fladen Ground (FG), Faroe–Shetland Channel (FSC), and Oman Margin (OM).
10 cm diameter core tubes: eight cores (628 cm2) were col-lected for a large macrobenthos sample, four cores (314 cm2) for small macrobenthos, one core (78.5 cm2) for mesoben-thos, and a 10 cm2 subsample from a single core for a meiobenthos sample. Macro- and mesobenthos samples were of the 0–10 cm sediment horizon, the meiobenthos sample was of the 0–5 cm horizon. All samples were preserved in Borax-buffered 10 % formalin shortly after collection.
The fauna of macro- and mesobenthos samples were sepa-rated by wet sieving; the fauna of meiobenthos samples were extracted by differential floatation in colloidal silica (Ludox, specific gravity of 1.15; Kaariainen, 2006). The total meta-zoan fauna of the macrobenthos and meiobenthos samples was enumerated and identified to major taxon. In the case of the mesobenthos samples, a random subsample of the meta-zoan fauna was enumerated and identified to major taxon. Subsampling was undertaken with a “Jensen sample splitter” (Kaariainen, 2006).
Individual body weights were determined as the product of biovolume and a specific gravity of 1.13 (Kaariainen, 2006). Body volume was estimated by dividing the morphology into a number of geometric shapes (e.g. cones, cylinders, trun-cated cones) and making the measurements necessary to cal-culate the volume of each. For each primary sieve fraction (i.e. 500, 250, 180 and 45 µm) the body weight of every meta-zoan was calculated except where more than 150 specimens of a particular taxon were present, in which case a subsam-ple of 100 specimens were selected at random from a gridded petri dish.
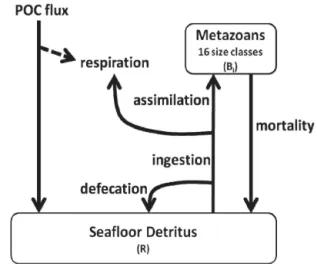
Figure 2.Flow diagram of model structure. The solid lines repre-sent processes explicitly reprerepre-sented in the model.
follow Blanco et al. (1998): wti =wtl
cb+1−1
(c−1)(b−1)
1 b ,
where wtl is the lower weight limit of the size class (see
Table 2, and Warwick, 1984), c is the ratio of geometric increase (i.e. 2), and b is the slope of the abundance–size spectrum (uniformly set to −0.7, for consistency and re-peatability of the method). Geometric mean abundance and biomass data were then log transformed and regressed on log-transformed nominal size class weights (simple least squares regression, implemented using Minitab 15, Minitab Inc.). Regression slopes were compared to standard allomet-ric ratios (e.g. 1/3, 1/4) using attest.
2.2 Model structure
The model is designed to be as simple as possible while retaining the ability to vary physiological rates as a func-tion of organism size. It is therefore intended as a minimal model to capture the first-order behaviour of the observed biomass spectra. The model incorporates 16 metazoan size classes feeding on a single food pool that originates from the supply of particulate organic carbon (POC) from the water column above (Fig. 2). The number of model size classes is derived directly from our measurements and defined by a X2 geometric scale with mean body sizes (Wi) ranging from 8.9×10⁻⁷to 2.9×10⁻²g wet weight (Table 2). Each
meta-zoan size class undertakes ingestion, defecation, assimilation of ingested substrates, respiration, growth and mortality. The size classes do not directly interact. In effect, competitive in-teractions are reduced to simple body size scaling of inges-tion, respiration and mortality. Similarly, predation is not ex-plicitly included but may effectively occur via the common food pool, i.e. all mortality returns to the food pool and may be re-used by any size class.
Table 2.Geometric body size classes used in this study (adapted
from Warwick, 1984).
Size Size range Geometric Approximate class (g wwt) mean wet
weight weight (g wwt)
5 6.0×10⁻⁷to 1.2×10⁻⁶ 8.4×10⁻⁷ 1 µg
6 1.2×10⁻⁶to 2.4×10⁻⁶ 1.7×10⁻⁶ 2 µg
7 2.4×10⁻⁶to 4.8×10⁻⁶ 3.4×10⁻⁶ 3 µg
8 4.8×10⁻⁶to 9.5×10⁻⁶ 6.7×10⁻⁶ 7 µg 9 9.5×10⁻⁶to 1.9×10⁻⁵ 1.3×10⁻⁵ 13 µg
10 1.9×10⁻⁵to 3.8×10⁻⁵ 2.7×10⁻⁵ 27 µg
11 3.8×10⁻⁵to 7.6×10⁻⁵ 5.4×10⁻⁵ 54 µg 12 7.6×10⁻⁵to 1.5×10⁻⁴ 1.1×10⁻⁴ 108 µg
13 1.5×10⁻⁴to 3.1×10⁻⁴ 2.2×10⁻⁴ 216 µg
14 3.1×10⁻⁴to 6.1×10⁻⁴ 4.3×10⁻⁴ 432 µg
15 6.1×10⁻⁴to 1.2×10⁻³ 8.6×10⁻⁴ 1 mg
16 1.2×10⁻³to 2.4×10⁻³ 1.7×10⁻³ 2 mg
17 2.4×10⁻³to 4.9×10⁻³ 3.5×10⁻³ 3 mg
18 4.9×10⁻³to 9.8×10⁻³ 6.9×10⁻³ 7 mg
19 9.8×10⁻³to 2.0×10⁻² 1.4×10⁻² 14 mg 20 2.0×10⁻²to 3.9×10⁻² 2.8×10⁻² 28 mg
In terms of the total benthic ecosystem, the incoming POC flux has to support the consumption of organisms of smaller and larger body sizes than are included in our modelled range (the meio- and macro-benthos). The larger forms include the megabenthos and demersal fish; the smaller forms, the “bac-teria” (prokaryotes) and small eukaryotes (e.g. foraminifer-ans). There are practical reasons to exclude foraminiferans from the model; the full range of foraminiferal entities in our size range can only be recognized by a few people world-wide, live specimens are difficult to distinguish from the dead, and the volume of live protoplasm (and hence body mass) is difficult to estimate reliably. We do however rec-ognize their importance (see e.g. Bett, 2014) and are cur-rently actively pursuing a reliable means of foram body mass estimation. At the physical scale of sediment core samples (ca. 20–100 cm2) bacteria dominate the consumption of POC (e.g. Pfannkuche et al., 1999). We model this additional con-sumption by rescaling the incoming POC flux to that pro-portion available to the meio- and macro-benthos. We refer to the proportion consumed by other size classes asfotherto
The model equations are given below. Model biomass units are expressed in g wet weight per m2(g wwt m−2) and
fluxes given as yearly values (g wwt m−2yr−1). The rate of
change of metazoan biomass,Bi, in each size classiis given by
dBi
dt = |{z}αIi
assimilation
− riαIi | {z }
respiration
| {z }
net production
−miBi2 | {z }
mortality
, (1)
where α is the assimilation efficiency,ri is the respiration coefficient expressed as a fraction of assimilation, mi is a coefficient for metazoan mortality rate andIiis the ingestion rate for size classi, taken here to be
Ii=giRBi, (2)
where R is the stock of detritus and the ingestion coeffi-cientgican vary allometrically (see Table 3). The subscripti (ranging 5–20) indicates that a property or parameter can be body-size dependent.
Net metazoan production (i.e. growth) is calculated as the difference between rates of assimilation and respiration (Eq. 1), representing a departure from Peter’s (1983) model which has an explicit body-size-dependent growth term. For simplicity, rates of assimilation are taken to be a constant (as-similation efficiency,α) fraction of ingestion (Eq. 2). Respi-ration rates are taken to be a fraction of assimilation (ri) lost to the respiratory pathway. Note that in our modelαtakes a single value whereasri varies with size class. Our approach is similar to contemporary pelagic ecosystem models (e.g. Anderson and Pondaven, 2003) in which parameters such as assimilation and growth efficiencies are assigned to specify the fate of material ingested by consumers.
The loss terms for each size class are defecation (the frac-tion of ingesfrac-tion not assimilated), mortality and respirafrac-tion. Losses through defecation and mortality are returned to the food pool,R(Eq. 3), while respiration across the size classes balances the POC flux at steady state.
Simple first-order reaction functions are used to model both ingestion (Eq. 2) and mortality (Eq. 1). Hence, spe-cific rates of ingestion and mortality are regulated by the concentration of the food source and biomass, respectively, yielding a density-dependent formulation in the case of mor-tality, as in, for example, Benoit and Rochet (2004). Use of density-dependent terms, through either resource-limited growth or mortality, is an established way of preventing com-petitive exclusion in model systems (Brown, 1989; Chesson, 2000). Here, a stable solution with co-existence of the 16 size classes was not found when using a linear mortality term. We choose to use a quadratic, density-dependent term rather than a Michaelis–Menten formulation purely out of parsimony, as the latter would involve an extra parameter. Although data are currently lacking to provide explicit support for such density dependence in the benthic realm, density-dependent
mortality is a recognized mechanism for regulating natural populations of pelagic organisms (Ohman and Hirche, 2001; Minto et al., 2008).
The rate of change of the organic matter available for in-gestion, the detrital food pool,R, is taken to be
dR
dt =
1−fother
POCflux
+
i=20
X
i=5
(1−α) Ii
| {z }
defecation
+
i=20
X
i=5
miBi2
| {z }
mortality
−
i=20
X
i=5
Ii
| {z }
ingestion
, (3)
where POCfluxis the flux of organic carbon to the seabed.
The role of bacteria and Foraminifera (and organisms larger than class 20) is represented in the food pool, Eq. (3), through the parameter fother, the fraction of the POC flux that is
respired by these components of the benthic community (i.e. the fraction not reaching the metazoan meio- and macroben-thos). Note that POCflux and fother only ever occur in the
model equations together and so cannot be determined in-dependently by the optimization procedure described later. For this reason, we define a new parameter
Q=
1−fother
POCflux,
which represents the POC flux available to the modelled community. This will of course be smaller than the total flux, POCflux. For the model,Qis converted to units of gC m−2
for comparison to observations by multiplying by 0.077, which is a product of the factors for converting wet weight to dry weight (0.22) and dry weight to carbon (0.36) (Brey et al., 2010).
The model equations do not describe a system in which growth gives rise to the explicit transfer of individuals in size classito size classi+1. This is because the “currency” of the model is biomass; for each size class processes occur at a rate controlled by the amount of biomass in that size class, not the number and/or weight of individuals.
The few available studies suggest that temporal variabil-ity in benthic biomass size spectra appears to be minimal (Schwinghamer, 1981, 1983, 1985; Drgas et al., 1998; Du-plisea et al., 2000) thus we consider only steady-state solu-tions of the model. At steady state, total respiration across all the size classes equals the (1−fother) fraction of incoming
POC flux.
2.3 Model parameterization
We base the model on an allometric approach, with three pa-rametersgi,miandri assumed to follow a power law scaling with body size:
pari=aWib,
T able 3. Model parameters, ranges and optimized v alues. Ranges used for parameter optimization are gi v en in square brack ets. V alues in bold for each site sho w the range of optimized v alues for the 10 optimizations. Model parameter Allo wed range F aroe–Shetland Channel Fl aden Ground Oman Mar gin Ingestion parameter a , g , a g [0.1, 2.0] 1.8 ( 0.1 , 1.8 ) 0.6 ( 0.3 , 1.6 ) 1.5 ( 0.16 , 2.0 ) ( g wwt )− 1 d − 1 b g [ − 0.5, 0.0] − 0.11 ( − 0.20 , − 0.10 ) − 0.18 ( − 0.21 , − 0.07 ) − 0.13 ( − 0.24 , − 0.13 ) Mortality parameter a , m , a m [1 . 0 × 10 − 4 , 0.1] 7 . 2 × 10 − 4 ( 4 . 6 × 10 − 4 , 1 . 2 × 10 − 3 ) 2 . 2 × 10 − 4 ( 1 . 3 × 10 − 4 , 1 . 2 × 10 − 3 ) 2 . 4 × 10 − 3 ( 3 . 7 × 10 − 4 , 3 . 3 × 10 − 3 ) ( g wwt )− 1 d − 1 b m [ − 0.5, 0.0] − 0.44 ( − 0.49 , − 0.40 ) − 0.43 ( − 0.43 , − 0.29 ) − 0.33 ( − 0.48 , − 0.32 ) Fraction of assimilation respired b , r a r [2 . 6 × 10 − 3 , 2.3] 0.58 ( 0.27 , 0.58 ) 0.88 ( 0.47 , 1.0 ) 0.38 ( 0.22 , 0.73 ) b r [ − 0.39, 0.39] 8 . 4 × 10 − 3 ( − 3 . 7 × 10 − 2 , 4 . 4 × 10 − 2 ) 0.11 ( 4 . 7 × 10 − 2 , 0.17 ) − 8 . 7 × 10 − 3 ( − 1 . 0 × 10 − 2 , 6 . 2 × 10 − 2 ) Fraction of ingestion assimilated c α [0.1, 0.9] 0.43 ( 0.25 , 0.86 ) 0.35 ( 0.13 , 0.87 ) 0.11 ( 0.10 , 0.85 ) POC flux av ailable to metazoans d , gC m − 2 yr − 1 Q [0.05, 99] 16 ( 3.4 , 51 ) 50 ( 3.5 , 77 ) 13 ( 0.92 , 20 ) a Because of the parameterizations, absolute v alues of g and m cannot be directly compared to specific ingestion and mortality rates respecti v ely . (Please see te xt for discussion.) Ho we v er , the scaling can be constrained, based on Cammen (1980), Bro wn et al. (2004), Hendriks (1999), Sa v age et al. (2004). b Based on Cammen (1989) and Har gra v e (1971), the fraction of ingested material respired is tak en to lie between 0.01 and 0.6 for all size classes, from which these parameter ranges are deri v ed. c Encompasses fresh and b ulk sediment v alues of Ahrens et al. (2001) and those across animal kingdom in Hendriks (1999). d P arameter is implicitly the product of total POC flux and fraction of this av ailable to metazoans, (1 − f other ). Because of strong contrast in sites, a wide range is chosen for POC flux (0.1–100 gC m − 2 yr − 1 ). Based on Pf annkuche et al. (1999) and W oulds et al. (2009), f other is tak en to v ary from 0.5 to 0.99. These ranges are combined to set the ranges for Q .
the prefactor,a, and scaling exponent,b, can be estimated by comparison of model output to size spectrum data, as de-scribed in the next section.
For the ingestion parameter (gi) the above power law form mimics the observations of Cammen (1980) showing a power law relationship between organic carbon ingestion rate and body size of benthic deposit feeders and detritivores. A size-based approach to mortality follows studies in both aquatic (Savage et al., 2004) and non-aquatic (Hendriks, 1999) or-ganisms, though natural mortality rates for benthic organisms are difficult to parameterize because of scarcity of relevant experimental data.
Constraints are placed upon the model parameters in two ways. First, forg andm, there is previous work to directly constrain the prefactor and scaling exponent (Table 3). For this reason, ranges for the prefactor and scaling exponent are prescribed for both of these parameters from which the opti-mizer can choose values. Second, for the remaining allomet-rically scaling parameter,r, the prefactor and scaling expo-nent cannot be constrained directly but it is possible to put some constraints on the value the parameter can take for the smallest and largest size classes. These values are then used to calculate the scaling exponent and prefactor from which it can derive the parameter value for the other size classes. For all three processes which are allowed to scale with body size (ingestion, respiration and mortality) the range of allowed pa-rameter values includes zero for the scaling exponent so that all can choose to have a process that does not scale with body size if it gives a better fit to the data. Hence, the results are not biased in favour of an allometric solution. Furthermore, to reflect the uncertainty regarding allometric behaviour in respiration, the same range of parameter values forriis used for smallest and largest size classes so that the relationship to body-size can be either increasing or decreasing (i.e. positive or negative scaling exponent). In summary, the relationship to body size emerges from optimizing the model to give the best reproduction of the observations.
2.4 Model parameter optimization
give a 48-digit binary number (as there are eight parameters in the model), referred to as the “genotype” corresponding to this parameter set. Initially, the optimizer randomly gen-erates eight genotypes; the rule of thumb is that the number of genotypes should match the number of parameters. The model is run independently using the parameter set corre-sponding to each genotype. A “cost” is then calculated for each parameter set compared to the data, calculated as the simple sum of square differences between log-transformed observation and model output for each size class. As there are five observations for each size class, each size class con-tributes five terms to the sum. The genotype corresponding to the lowest cost is automatically passed intact to the next “generation”. To generate the other seven genotypes neces-sary for the next generation, pairs of the eight genotypes from the current generation are combined. Each of the pairs used to make a genotype for the next generation is chosen at ran-dom – with probability proportional to the reciprocal of their cost – so those with lowest costs are most likely to be cho-sen. Once a pair have been chosen, a random integer between 2 and 47 is chosen and the two genotypes are combined at this location e.g. if the combination location is 34, the new genotype has the first 33 elements of the binary genotype of parent 1 and the last 15 elements of parent 2. Once a new set of eight genotypes has been created, the process repeats.
The optimizer is run through 5000 generations. Typically there is little change to the optimal solution after 2000 gener-ations. As a further precaution against getting caught in local minima of the cost function, the whole process is repeated 10 times using different sets of initial genotypes. The best fit (i.e. the lowest cost function of the 10 repeats) is presented for each site. Because of difficulties involved in handling ze-roes when log-transforming to calculate the cost function, zero values were removed. As a check, the optimization was repeated using data with zeros replaced by mean values for that biomass interval and similar results were obtained.
Two additional criteria, taken from the literature, were im-posed in determining the passing of genotypes to the next generation in the optimization procedure: (1) that the an-nual ratio of net production (assimilation minus respiration) to biomass (effectively a specific net growth rate) decreases with body size (e.g. Banse and Mosher, 1980) with a value falling between 0.1 and 2.0 yr−1 for the largest
(macrofau-nal) class and a value falling between 4 and 7 yr−1 for the
smallest (meiofauna) size class (Schwinghamer et al., 1986); and (2) that individual respiration rates increase with body size (e.g. Peters, 1983).
3 Results
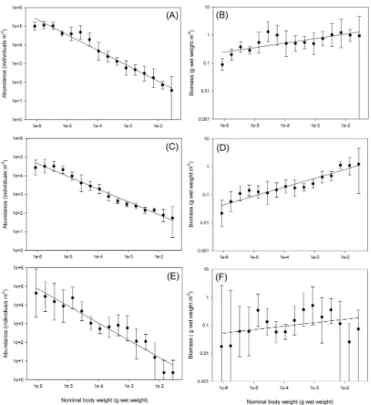
3.1 Observed size spectra: abundance and biomass Abundances decreased with size at all sites. Biomass in-creased with size at two sites but the trend was not
signifi-Figure 3.Abundance and biomass spectra for Fladen Ground(a, b),
Faroe–Shetland Channel(c, d)and Oman Margin(e, f). Geometric
mean (points) and 95 % confidence intervals (bars) based on five replicate samples are shown together with regression lines for the geometric mean data.
cant given the variability in the data at the third site (Fig. 3). We focus on this first-order phenomenon of the decrease (in-crease) in abundance (biomass). Recent work (Bett, 2013, 2014; Warwick, 2014) discusses the extent to which variabil-ity about the trend is likely to be a robust signal or a result of sampling artefacts.
The abundance–body-size relationships were all statisti-cally significant with scaling exponents (and standard er-ror) of−0.83 (0.04),−0.68 (0.03) and−0.92 (0.07) at FG, FSC and OM, respectively (Table 4). The scaling exponent at FG was not significantly different from−3/4, in line with metabolic theory (Brown et al., 2004), whereas at FSC the scaling was not significantly different from −2/3, in line with surface area : volume theory (Schmidt-Nielsen, 1984). OM had the steepest abundance–body-size slope, consistent with other studies of hypoxic environments (Chapelle and Peck, 1999; Quiroga et al., 2005). The latter suggests that the steeper slopes may be due to smaller bodied organisms being better adapted to hypoxic conditions (Gooday et al., 2010).
Total abundance (in classes 5–20) was lowest at FSC (1.51×10⁵ind.m−2, 95 % CI: 0.96–2.19×10⁵ind.m−2),
al-most twice as high at OM (2.82×10⁵ind.m−2, 95 % CI:
0.26–9.39×10⁵ind.m−2), and over three times higher at FG
(5.11×10⁵ind.m−2, 95 % CI: 3.28–7.31×10⁵ind.m−2). At
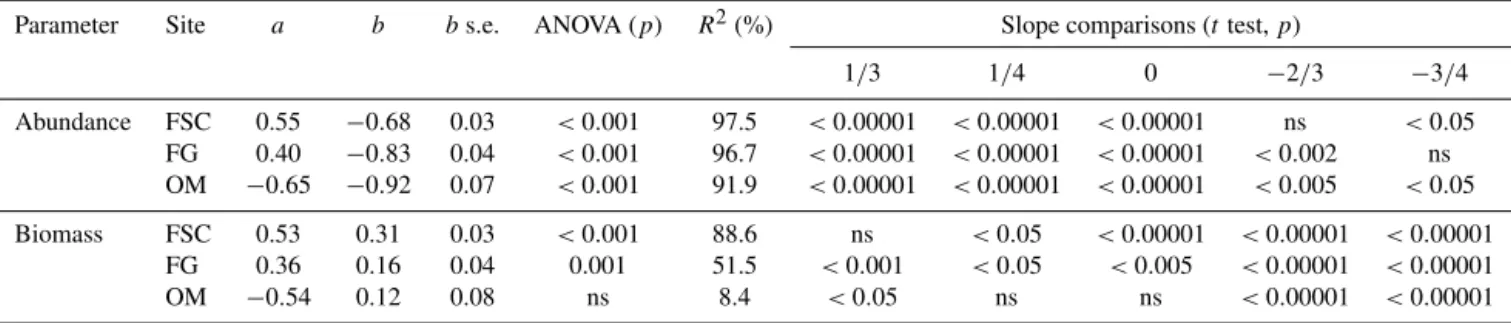
Table 4. Summary of regression analyses for abundance and biomass relationships with nominal body weight for three study sites (FG,
Fladen Ground; FSC, Faroe–Shetland Channel; OM, Oman Margin) assuming a relationship parameter=aWb. ANOVA probability (p),
coefficient of determination (R2), prefactor (a), scaling (b), standard error forband itst-test comparison probabilities (p) with standard
allometric ratios are shown.
Parameter Site a b bs.e. ANOVA (p) R2(%) Slope comparisons (ttest,p)
1/3 1/4 0 −2/3 −3/4 Abundance FSC 0.55 −0.68 0.03 <0.001 97.5 <0.00001 <0.00001 <0.00001 ns <0.05
FG 0.40 −0.83 0.04 <0.001 96.7 <0.00001 <0.00001 <0.00001 <0.002 ns OM −0.65 −0.92 0.07 <0.001 91.9 <0.00001 <0.00001 <0.00001 <0.005 <0.05 Biomass FSC 0.53 0.31 0.03 <0.001 88.6 ns <0.05 <0.00001 <0.00001 <0.00001
FG 0.36 0.16 0.04 0.001 51.5 <0.001 <0.05 <0.005 <0.00001 <0.00001 OM −0.54 0.12 0.08 ns 8.4 <0.05 ns ns <0.00001 <0.00001
(84–99 %), with mesofauna and macrofauna far less abun-dant. The exception was at FG where mesofauna (molluscs, mostlyVeneroidaeandPhilinidae) accounted for over 15 % of the total, most likely representing a recent recruitment event. Nematodes dominated the meiofaunal size range (>
90 %) and polychaetes (mostlyParaonidae,Capitellidaeand Aricidaeat FSC,Amphinomidae,CapitellidaeandNereidae dominating at FG and almost exclusively Ampharetidae at OM) accounted for the majority (>60 %) of individuals in the macrofaunal size range at all sites. Molluscs (mostly VeneroidaeandPhilinidae) dominated the mesofauna at FG while no one group dominated the mesofaunal size classes at the other sites.
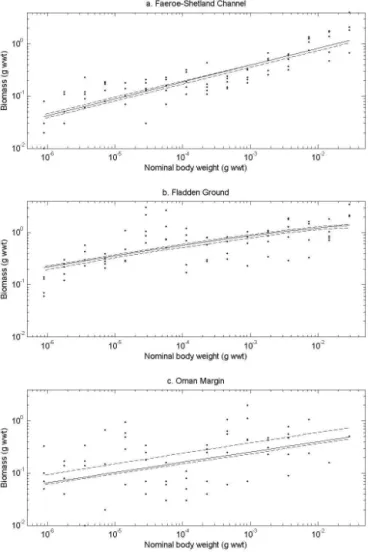
Increasing trends in biomass (Fig. 3) were statistically sig-nificant (p≤0.001) at FSC and FG with scaling exponents (and standard errors) of 0.32 (0.03) and 0.16 (0.04), respec-tively (Table 4). In contrast, the increase in biomass with size was less convincing at OM (the scaling exponent of 0.12 with standard error 0.08 was not significantly different from zero or−1/4).
Total mean biomass at FG (12.1 g wwt m−2, 95 % CI:
6.8–21 wwt m−2) was approximately twice the value at the
FSC site (6.6 g wwt m−2, 95 % CI: 3.5–11.7 wwt m−2) and
more than three times higher than at OM (3.4 g wwt m−2,
95 % CI: 1.6–6.3 wwt m−2). Tukey simultaneous tests
indi-cated that only the difference between FG and OM was sta-tistically significant (p <0.05).
Macrofauna (sensu stricto: i.e. >500 µm excluding taxa typically regarded as meiofaunal; Hessler and Jumars, 1974) accounted for most of the total biomass at all locations (92, 69 and 68 % at FG, FSC and OM respectively), with polychaetes dominating this group. Mesofaunal biomass (<
500 µm,>180 µm, excluding meiofaunal taxa) contributed less than 4 % at the FSC and OM but 26 % at FG. Polychaetes dominated the mesofaunal biomass at FG and OM, with no overall dominant group at FSC. The meiofauna (>45 µm, excluding macrofaunal taxa), dominated by nematodes, ac-counted for less than 7 % of the total biomass at FG and FSC. At OM, the proportion of meiofaunal biomass was more than
four times greater (28 %) than at the other two sites, poten-tially reflecting the tolerance of nematodes to hypoxic condi-tions (e.g. Heip et al., 1985).
3.2 Modelled biomass size spectra
It should be noted that there is considerable variability in op-timal parameter values across the 10 optimizations. This is a common feature when fitting models to data and indicates that the data available cannot constrain all processes in the model, as is invariably the case. For this reason the results need to be viewed with an awareness that for each of the three sites, while the best fit to data shown in Fig. 4 demon-strates how well the model can do, the results of the 10 op-timizations look very similar and only have slightly different costs. Hence, undue weight should not be given to the spe-cific values for the best optimization in Table 3. Considera-tion of the results needs to take the variability in optimized parameters (also shown in Table 3) into account. The biomass spectra produced by the model at each site are shown in Fig. 4, and the associated parameter values are shown in Table 3. In each case, both the best fit and the range of fits from the 10 optimizations are shown. As an equal number of data are available for all three sites, the costs associated with the model fit to each site can be directly compared. De-fined as the one with lowest cost, the best fit among the sites is for the FSC, followed by the FG and then the OM. The total biomass modelled at each of FSC (5.7 g wwt m−2), FG
(10.8 g wwt m−2) and OM (3.5 g wwt m−2) is similar to
Figure 4.Optimized model biomass size spectra for each site. The observations contain five replicates per size class (closed circles). Dashed lines show the envelope for the 10 optimizations. The solid line corresponds to the optimization that resulted in the best fit to data.
error in the scalingestimated from observations (see Table 4) for OM (0.08) is considerably larger than that for either of FSC (0.03) and FG (0.04), reflecting the greater variability apparent even by eye in the data (Fig. 3). Consequently, even for OM the model is within the uncertainty associated with the scaling estimates.
3.3 The allometry of model processes
The model represents the biomass in each size class as a bal-ance between the three processes of assimilation, respiration and mortality. As described earlier, each of these processes is allowed to scale independently with size via a single scaling parameter (gi,ri andmi, respectively).
For assimilation, the structure of the model parameteriza-tion (see Eq. 2) means that the specific assimilaparameteriza-tion rate will scale in the same way as the parameter gi. As the model
further represents assimilation as a constant (α) fraction of ingestion, the scaling ofgi also describes the behaviour of ingestion in the model. Empirical studies have advocated a
−1/4 power law for mass-specific ingestion (e.g. Cammen, 1980; Savage et al., 2004). Although the scaling for the op-timized runs has the same trend as this with size, the abso-lute values are systematically smaller than 0.25 (Table 3). Al-though the lower limit of the range of scaling for each of the three sites FSC (−0.20 to−0.10), FG (−0.21 to−0.07) and OM (−0.24 to −0.13) is close to −0.25, the value for the “best” optimization in each case (FSC,−0.11; FG,−0.18;
−0.13) corresponds to a weaker scaling with biomass. For mortality, the scaling parameter,mi, does not represent the specific mortality rate. Because of the form of the param-eterization used in the model (Eq. 1), the specific mortality rate is given bymiBi. Hence, the scaling exponent of the spe-cific mortality is the sum of the scaling exponents formi and
Bi, given in Table 5. For all three sites, there is a non-zero scaling, i.e. an allometric representation of mortality. Fur-thermore, in all cases the model-specific mortality decreases with size. This is, however, a consequence of the additional imposed criterion (see Sect. 2.4) that the specific net growth rate decrease with size, since at steady state the specific mor-tality rate has to equal the specific net growth rate for each size class. The same empirical studies already cited in the context of assimilation (Cammen, 1980; Savage et al., 2004) imply that specific mortality may scale as−0.25. Support for this from the model is mixed (Table 5). For FG the best fit has a scaling of exactly−0.25 but the range extends from this value to−0.11. For OM the range across the 10 op-timizations (−0.26,−0.12) encompasses−0.25 even if the best fit has a scaling of−0.13. For FSC, however, not even the range (−0.17,−0.09) includes−0.25. Regarding partic-ular values of the specific mortality rate, they are consistent across all three sites with values of 1.3–1.9×10⁻²day−1
for the smallest size class and 1.0–5.3×10⁻³day−1for the
largest. Across the three sites, particular values for the spe-cific assimilation rate are consistently between 1.7×10⁻²
and 3.9×10⁻²day−1for the smallest size class and between
2.2×10⁻³and 10.0×10⁻³day−1for the largest.
There is less evidence that the scaling of the fraction of as-similated material that is respired,br, has a strong influence
on the modelled biomass. For FG, the range (0.04–0.17) is similar in absolute values (but opposite in sign) to the range for ingestion scaling. However, for two of the sites, FSC (−0.04 to 0.04) and OM (−0.01 to 0.06), the range spans zero, corresponding to no scaling with biomass, and the lim-its are small in magnitude. The scaling ofbrshould not,
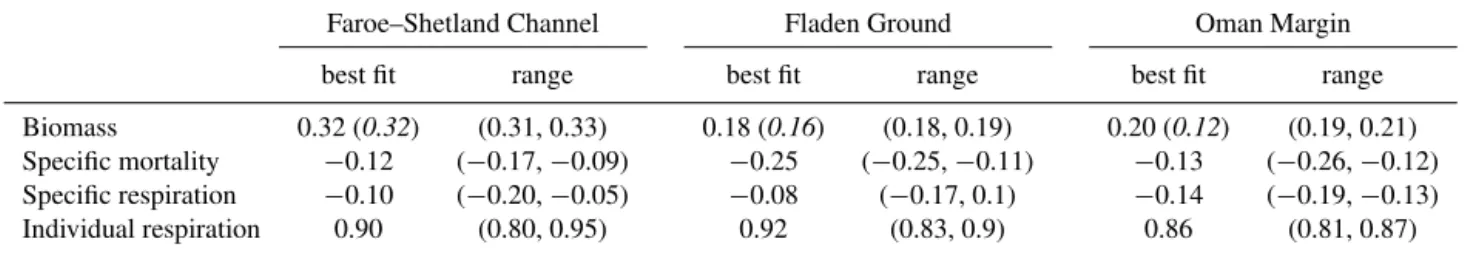
Table 5.Scaling exponents derived from model output, assuming a scaling of parameter=aWb, whereWis nominal weight for class. For biomass, observed scalings are also given, in parentheses in italics.
Faroe–Shetland Channel Fladen Ground Oman Margin
best fit range best fit range best fit range
Biomass 0.32 (0.32) (0.31, 0.33) 0.18 (0.16) (0.18, 0.19) 0.20 (0.12) (0.19, 0.21)
Specific mortality −0.12 (−0.17,−0.09) −0.25 (−0.25,−0.11) −0.13 (−0.26,−0.12)
Specific respiration −0.10 (−0.20,−0.05) −0.08 (−0.17, 0.1) −0.14 (−0.19,−0.13)
Individual respiration 0.90 (0.80, 0.95) 0.92 (0.83, 0.9) 0.86 (0.81, 0.87)
exponentsbgandbr, i.e. the compound effect of allometry
al-lowed in assimilation and respiration efficiencies. Although the scaling exponent of assimilation (viagi) is constrained to be zero or negative, that for the respired fraction of assimila-tion (br) can be positive or negative, so in theory the specific
respiration rate is free to scale either way with size or not at all. A caveat to this is that, as described in Sect. 2.4, an addi-tional observaaddi-tionally motivated criterion is applied to ensure that total respiration within a size class increases with size. As respiration is the product of specific rate and biomass, this condition imposes thatbg+br+bBis greater than zero, where
bBis the scaling exponent for biomass. Table 5 shows that for
all three sites, for the best fit, the scaling exponent for specific respiration rate is negative. There is, however, considerable variability in the estimated rate. At FG, the range (−0.17, 0.10) straddles zero and six of the ten optimizations give a positive scaling exponent. At FSC the scaling varies from near zero, but negative, down to−0.20. At OM, the range is tighter and significantly different from zero (−0.19,−0.13). Focusing on particular values of the specific respiration rate, for FSC and OM the smallest size class has a specific respira-tion rate between 0.3×10⁻²
and 2.1×10⁻²
day−1
while the largest has a rate between 0.5×10⁻³and 5.2×10⁻³day−1. At FG, because of the greater range of scaling behaviour across the optimizations, the specific respiration rate varies between 0.6×10⁻³ and 7.4×10⁻³day−1 for the smallest
size class and a similar range of between 1.1×10⁻³ and
5.9×10⁻³day−1for the largest.
We can also calculate the scaling of the fluxes through the system for each size class, by substituting values from Table 3 into Eq. (1). Table 6 shows the scaling parameters for the three fluxes of ingestion, mortality and respiration. Although the scaling is negative in one instance, this is very close to zero. All other scalings are positive. For FG and OM the flux scalings are sufficiently close to zero that the biomass scaling is effectively cancelling that of ingestion and mor-tality. For FS the increase of biomass with size dominates to give the fluxes similar behaviour, despite specific rates (Table 5) decreasing with size.
Table 6.Scaling of flux terms in Eq. (1) with size for the
three study sites.
Flux scalings Faroe–Shetland Fladen Oman
Channel Ground Margin
Ingestion flux 0.21 0.00 0.07
Mortality flux 0.20 −0.07 0.07
Respiration flux 0.22 0.11 0.06
3.4 Non-allometric model parameters and estimates The fraction of ingestion that is assimilated,α, is allowed a wide range and the optimizer exploits this. There is little consistency, either between or within sites (Table 3), with the range of fitted values across the 10 optimizations for each site spanning the available range. As the parameter only occurs in the model Eqs. (1) and (3) as a product with the prefactor of
gi,ag, it might be thought that the variability reflects the
in-ability to constrain both parameters independently. However, the productαagshows similar variability toα(not shown)
and so the uncertainty also reflects the inability to adequately constrain this parameter by fitting the model purely to data for biomass.
As mentioned earlier, the optimizer can only estimate the POC flux available to metazoans in the size classes stud-ied. For this reason, the fitted values for the parameterQ
(Table 3) represent a lower bound on the total POC flux. Al-though the value for the best fit at the three sites is reason-ably consistent within 4–16 gC m−2yr−1, there is typically a
factor of 20 variation across the 10 optimizations at a given site, though for no optimization does the value hit one of the bounds for the allowed range. Nevertheless, based on the model results there is no justification for claiming variation in the total POC flux between the sites and the only thing that can be said with a degree of confidence is that the total POC flux is likely to be above 1 gC m−2yr−1.
The model values for the POC stock in the sediment for the three stations are very similar: 3.9–52×10−4, 1.5–15×
10−4 and 0.8–18×10−4gC m−2 for FS, FG and OM sites
modelledorganisms. In practice the dominant part of the stock will be more refractory material. This is not modelled here and so model sediment stock values should not be re-garded as estimates for total POC in sediment.
4 Discussion
4.1 Controls on the biomass size spectra
The data presented here add to a rare collection of observed biomass size spectra in marine benthic communities, espe-cially in the deep sea. Such scarcity of data makes it difficult to assess how conservative biomass distributions are in time and space. The few available studies suggest that spatial and temporal variability appears to be minimal (Schwinghamer, 1981, 1983, 1985; Drgas et al., 1998; Duplisea, 2000). Con-sequently, we have chosen to adopt the Occam’s Razor sim-plicity approach by assuming a steady-state system in our modelling study. Questions therefore remain concerning how temporal variation in the POC flux, for instance on seasonal timescales, might affect biomass spectra. An obvious future study using the model presented here would be to explore this.
Our field data (Fig. 3) and model results (Fig. 4), drawn from highly contrasting environments, suggest a continu-ous increasing distribution of biomass across the size classes studied. These observations are consistent with the earlier works of Drgas et al. (1998) and Duplisea (2000), and accept-ing the potential samplaccept-ing artefacts described by Bett (2013), also with the classical works of Schwinghamer (1981, 1983, 1985). This increase in biomass with body size is also appar-ent in studies of the larger bappar-enthos (megabappar-enthos) by Lampitt et al. (1986) and Thurston et al. (1994).
The assumption of steady state allows us to probe the con-trols on the scaling of biomass, as in this instance the model is easily solved mathematically. From Eqs. (1) and (3) we can derive
Bi=(1−ri) αgiR/mi. (4)
For FSC and OM,ri scales relatively weakly with body size (Table 3), so the scaling ofBi is dictated by the ratio
gi/mi=
ag/am
Mbg−bm,
i.e. the slope of the biomass spectrum is∼bg−bm. It is only
when the scaling ofri is so small, though, that Eq. (4) pre-dicts a relationship so close to such a power law. For FG, the scaling ofriis more significant. However, even in this case, if a scaling is calculated for the model, as for the observations, by carrying out a regression of log(biomass) versus log(size), the regression line is indistinguishable from the model output and hence not visible in Fig. 4. For FG the regression expo-nent is typically 13–36 % smaller than that which would be estimated usingbg−bm. For FSC (3–10 %) and OM (1–23 %)
the difference in the two estimates is smaller in magnitude and varying in sign. The above discussion indicates that to first order the scaling of the biomass spectrum is set by a bal-ance between the influences of mortality and ingestion. We now discuss the allometry of each of these two processes in turn.
4.2 Mortality
It should be remembered that the modelled allometry of mor-tality, with specific rate decreasing with size, is imposed in the model. Schwinghamer (1983) suggested that biomass concentrates in larger species of benthic organisms on ac-count of their greater longevity, providing support for size-based mortality. Support for the allometric scaling of mor-tality also comes from studies in both terrestrial (Marba et al., 2007) and pelagic systems (Peterson and Wroblewski, 1984; McGurk, 1986; Savage et al., 2004), most of which have suggested quarter power scaling. Fenchel’s (1974) clas-sical work on the intrinsic rate of natural increase (the rm
“Malthusian parameter”) suggests a body size scaling power of −0.275. It might be reasonable to assume that it is matched by a similar power of scaling for mortality rate. As noted already, the specific mortality scaling parameters for the three sites studied here are too variable to make any claim regarding their match to a quarter power scaling (Table 5).
There is currently no direct evidence for density dependent mortality in benthic communities, as applied in this model. However, density-dependent mortality may arise from fac-tors such as pathogens, starvation and predation and this modelling approach enables an investigation of controls on biomass size spectra without the need for increased degrees of freedom (and thus uncertainty) that would result from the addition of poorly known parameters and terms to ac-count for niche specialization. One may speculate that the single-dimensional niche model developed by Williams and Martinez (2000), and used extensively in food web studies, may in practice lead to the density dependencies in mortal-ity used in the current model. However, the lack of predation (see Sect. 4.2) within the size range considered in this study makes the application of such a model of doubtful use.
esti-mated individualrespiration rate is also shown in Table 5. Al-though it is stronger than the 3/4 power generally employed in metabolic theory (Brown et al., 2004) at each of the sites, it differs from the classical scaling of 2/3 based on surface area to volume ratio by a greater margin.
The importance of size-specific mortality in the Peters (1983) model has recently been acknowledged in an applica-tion investigating the influence of hypoxia on subtidal macro-fauna (Rakocinski, 2009). However, that study used a time-dependent version of the Peters model in which the mortality was not density dependent, leading to competitive exclusion and hence to the survival of only one size class at equilib-rium. Rakocinski (2009) showed that the effects of oxygen limitation favoured a less even distribution of biomass among size classes with more biomass accumulating in the larger size classes. We chose not to adopt a similar approach for the OM site because we wished to test the null hypothesis that a single simple model based on allometry can reproduce ob-served biomass spectra at contrasting sites. Regardless, the high variability in our data for OM would not lend itself to testing the validity of different parameterizations.
In the model, the density-dependent mortality term (Eq. 1) enables coexistence of the multiple size classes on a single food source. Although an accepted approach (Brown, 1989; Chesson, 2000), it does not explicitly address the reasons for species coexistence in benthic systems.
4.3 Ingestion
Ingestion has been shown to scale with body size in the benthos (Cammen, 1980). Production and respiration (metabolism) are also known to scale with body size (e.g. Brown et al., 2004; Banse and Mosher, 1980). In addi-tion, there is evidence that food selection is size dependent (Ritchie and Olff, 1999) whereby small animals can select small patches with high-quality food, and larger animals can rely on larger patches of food that are of overall lower qual-ity. The approach of Ritchie and Olff (1999) relies on assum-ing a fractal geometry of the environment. While the orders of magnitude that span the size range of the fauna consid-ered in the present study (Table 2) may lend themselves to such an approach, data on the relevant fractal dimensions of both the habitat and resources are generally lacking for ben-thic data sets. In addition, Hildrew et al. (2007) suggest that the fractal dimension of a habitat may not be as important as factors relating body size to biological characteristics in ma-rine benthic assemblages. Furthermore, the role of food se-lection in determining the biomass size spectra would require supporting information on the particular food preferences of the fauna in the present study’s size range. To our knowl-edge, there are no studies of resource preferences at greater resolution than can be presently provided by isotope tracer techniques within the size range addressed in this study, al-though studies involving larger benthic organisms exist in both the deep-sea and shallow intertidal sediments (Wigham
et al., 2003; Woulds et al., 2010). Hence, the modelling ap-proach presented here neglects food selection and assumes that all the size classes share a common food source. How-ever, if food selectivity is size dependent at the three sites, this may imply that the assimilation efficiency (α) should also be allowed to scale with body size, particularly as lower quality food tends to favour lower assimilation efficiencies (Ahrens et al., 2001). However, in the modelαonly occurs as a product with the ingestion rategand so optimizing to the observations may implicitly include any scaling of assimila-tion in the scaling of ingesassimila-tion already.
The few studies on benthic assimilation and body size sug-gest that larger organisms have higher assimilation efficiency because of increased gut passage time which is thought to permit a relatively more complete digestion of food mate-rial (Jumars et al., 1990; Gage and Tyler, 1991). While more extensive reviews across the animal kingdom suggest that as-similation efficiencies do not scale with body size (see Hen-driks, 1999), the only published size-based benthic assimi-lation efficiencies for deposit feeders (Ahrens et al., 2001) suggest otherwise.
4.4 Predation
the “natural mortality”, with the biomass transfer occurring via the common food pool.
4.5 POC
The model only estimates the fraction of POC flux reach-ing the seafloor that is consumed by the metazoans it explic-itly represents. The rest of the sinking flux is assumed to be consumed by smaller or larger organisms or sequestered in the sediment. Dominance by bacteria of the breakdown of sedimentary organic material has been documented in both coastal and deep-sea environments and may be associated with their ability to both survive prolonged periods of starva-tion and to mineralize organic material of different reactivi-ties, in both the presence and absence of oxygen. Short-term (days) carbon processing measurements within the Pakistan Margin Oxygen Minimum Zone (depths<1000 m, Woulds et al., 2009; physical scales 40 cm2seabed area) indicate that up to 75 % of the experimentally added organic carbon is respired, most likely by bacteria and Foraminifera. At deeper sites, the percentage increases to 95 % (Woulds et al., 2009). Some uncertainty exists in the role of the benthic bacteria in respiring organic carbon, as shown by two deep-sea studies at comparable depths: Witte et al. (2003a, b; physical scale 200–400 cm2seabed area) found that macrofauna dominated the initial response to organic matter inputs in short-term experiments, whereas Moodley et al. (2002; physical scale 144 cm2seabed area) showed that the microbial community was more important. It should also be noted that both stud-ies reflect short-term responses (days to weeks) to food in-puts and that a steady state may have not been achieved. The model used here assumes steady-state conditions. Fur-thermore, the area of seabed studied will likely influence the result – i.e. at small physical scales, bacteria are likely to dominate total community respiration, while at larger scales, organisms of greater body mass will become increasingly more significant in total community respiration. Note that in the present case our model estimates of the parameterQ rep-resent the POC flux that supports metazoans in classes 5–20. As our assumed lower limit forfotheris 0.5 (see Table 3), the
POC flux required to support the total benthic community will be at least twiceQ.
Comparisons with other data are not straightforward, given that POC flux estimates are highly dependent on the methods used (Lampitt et al., 2001). For consistency and repeatability we instead refer to modelled POC flux to the seafloor (Table 1) as derived from Lutz et al. (2007). The latter model suggests values of 14.5 (FSC), 42.6 (FG) and 8.8 (OM) gC m−2yr−1, that would seem to match well with
ourQparameter estimates: 16, 50, and 13 gC m−2yr−1
re-spectively. It is encouraging that both the absolute order of magnitude, and the relative magnitude between study sites are consistent between our estimate of benthic flux consump-tion and the Lutz et al. (2007) based estimate. Nevertheless these data suggest a substantial potential deficit in the flux
supplied relative to total flux consumed (i.e. consumed is roughly twice that supplied). Similar deficits have been mea-sured in deep-sea field studies (Smith Jr. et al., 2009). These apparent deficits may arise from a number of causes such as technical difficulties in measuring POC flux (Lampitt et al., 2001), and mismatches in the temporal and spatial (see Sect. 4.3) scales of observations. Smith et al. (2013) have recently suggested that previous findings of food deficits are compensated by large episodic surpluses in POC that provide a balance over longer timescales. For the present, an inverse analysis (e.g. van Oevelen et al., 2006a, b) of benthic stand-ing stocks and their power demand, may be a more reliable measure of POC flux to the seabed than water column mea-surements by sediment trap.
4.6 Correlations in parameters
The most direct constraint of the data on the model is through biomass. It was shown in Sect. 4.1 that the scaling of biomass is set to first order by the difference in scaling exponents for ingestion and mortality. This leaves a degree of freedom such that ifbgandbmare increased by the same amount, then the
biomass scaling of the model remains the same. Although this is borne out by a strong correlation of these two param-eters for FG and OM, their correlation is only 0.69 at FSC.
More generally, defining a strong correlation as one greater than 0.7 in magnitude (corresponding to each ex-plaining greater than 50 % of the variance in the other), the number of strongly correlated parameters varies between sites: for FG there are five (−0.75 for α−bg; +0.92 for
bg−bm;+0.86 forbg−am;+0.96 forbm−am;+0.72 for
fother−POCflux); for FSC there are three (+0.72 forbg−br;
+0.98 forbm−am;+0.85 forfother−POCflux); for OM there
are nine (−0.92 forbg−br;+0.98 forbg−bm;−0.73 for
bg−ar; +0.97 forbg−am; −0.96 forbr−bm; −0.89 for
br−am; −0.79 forbm−ar;+0.96 forbm−am; −0.79 for
ar−am).
There is only one pairing that is strongly correlated across all sites,bm−am, and this correlation is always
pos-itive. Since increasingamcan maintain the median value of
amWbm ifbm (which is negative) is increased, this reflects
a degree of flexibility in setting the mortality of largest and smallest classes. Unfortunately this strongest correlation ex-ists for perhaps the most difficult to measure parameters. Correlations seen betweenbgandamare related to the
corre-lations ofbg−bmandbm−am.
The next most consistent correlation is a positive one be-tween fother and POCflux (+0.72, FG; +0.85, FSC; 0.62,
OM). This is expected as only the product Q=(1−
fother)POCflux can be constrained, leaving a degree of
free-dom such that increasingfother can compensate an increase
in POCflux. Although other strong correlations exist in
isola-tion, their lack of consistency across the sites (e.g. forbg−br
against reading too much into them given the variability in the data and simplicity of the model.
4.7 Universality
Although the structure of the model at the three sites stud-ied was the same, the specific values for parameters var-ied (Table 3). It is interesting, however, that parameters that exhibit little variability (across optimizations) at individual sites are often broadly consistent across sites (e.g. bg,bm)
whereas parameters that are very variable at a site can be equally variable at all sites (e.g.α,ag). This is an indication
that, despite its simplicity, the model still has more degrees of freedom than the observations can constrain. Nevertheless, given the reasonable agreement in the key scaling parameters between sites, one interpretation is that the model is captur-ing a more universal behaviour of benthic communities and that it may be possible to reproduce the observations at all three sites using a model with a single set of parameters, and only the incident POC flux varying between them. Fu-ture work will explore whether such a common model exists. 4.8 Metabolic theory
As detailed by Brown et al. (2004), the metabolic theory of ecology predicts a 1/4 power scaling of biomass across geo-metric body size classes within a single trophic level. Ab-solute biomass per class scales with resource supply (e.g. POC flux) and inversely with temperature, but the slope of the log–log plot of biomass on body size remains constant at 1/4. Arguably derived by substantially different means, our model is broadly in agreement given the variability in the data, predicting a slope of 0.18–0.31 across our three study sites, that span a substantial environmental range (water depth, 150–1600 m; habitat temperature−1 to 13◦C; oxygen concentration, 0.1–6 mL L−1; POC flux, 9–43 gC m−2yr−1).
This may of course be coincidence, but it at least suggests the value of further study of macroecology as applied to the marine benthos.
5 Summary
The purpose of this work was to investigate benthic biomass distributions in marine assemblages (meio- to macro-fauna, 1 µg–32 mg) to test the hypothesis that observed scaling of biomass spectra can be explained from an allometric basis. Our study adds to a sparse collection of observed biomass size spectra in benthic communities, particularly in the deep sea, and involves a rare application of simple allometric mod-elling to these environments. At all three sites studied, the metazoan fauna was dominated by deposit feeding meio-fauna (nematodes) and macromeio-fauna (polychaetes). The model reproduced the observed increase of biomass with body size at all three sites, indicating that a balance between size-specific mortality and ingestion controls benthic biomass
dis-tributions. Given the overall trends in published data, show-ing that biomass tends to increase with body size across ge-ometric size classes, we speculate that this is a more widely applicable conclusion for marine sediments.
Acknowledgements. This work was a component of Oceans 2025, a major 5-year coordinated marine science programme funded by the Natural Environment Research Council (NERC). The contributions of Marcinko, Martin and Yool were facilitated by NERC NC modelling and that of Bett by NERC NC mapping funding. The
cruises onboard the NERC research ship RRS Charles Darwin
were ably supported by NERC’s marine and seagoing technical support services, to whom we express our considerable thanks. We are also especially grateful to the Masters and crews of the vessel. We are indebted to Daniel O. B. Jones for implementing and running the Lutz et al. (2007) algorithm as employed in this contribution. Finally, we thank Paul Tyler and Henry Ruhl for their comments on earlier versions of the paper.
Edited by: J. Middelburg
References
Ahrens, M. J., Hertz, J., Lamoureux, E. M., Lopez, G. R., McElroy, A. E., and Brownawell, B. J.: The effect of body size on diges-tive chemistry and absorption efficiencies of food and sediment-bound organic contaminants in Nereis succinea (polychaeta), J. Exp. Mar. Biol. Ecol., 263, 185–209, 2001.
Anderson, T. R. and Pondaven, P.: Non-Redfield carbon and nitro-gen cycling in the Sargasso Sea: pelagic imbalances and export flux, Deep-Sea Res. Pt. I, 50, 573–591, 2003.
Banse, K. and Mosher, S.: Adult body-mass and annual produc-tion/biomass relationships of field populations, Ecol. Monogr., 50, 355–379, 1980.
Benoit, E. and Rochet, M.-J.: A continuous model of biomass size spectra governed by predation and the effects of fishing on them, J. Theor. Biol., 226, 9–21, 2004.
Bett, B. J.: UK Atlantic margin environmental survey: introduction and overview of bathyal benthic ecology, Cont. Shelf Res., 21, 917–956, 2001.
Bett, B. J.: Characteristic benthic size spectra: potential sampling artefacts, Mar. Ecol.-Prog. Ser., 487, 1–6, 2013.
Bett, B. J.: Macroecology and meiobenthos: reply to Warwick (2014), Mar. Ecol.-Prog. Ser., 505, 299–302, 2014.
Billett, D. S. M., Bett, B. J., Jacobs, C. L., Rouse, I. P., and Wigham, B. D.: Mass deposition of jellyfish in the deep Arabian Sea, Lim-nol. Oceanogr., 51, 2077–2083, 2006.
Blanchard, J. L., Jennings, S., Law, R., Castle, M. D., McCloghrie, P., Rochet, M.-J., and Benoît, E.: How does abundance scale with body size in coupled size-structured food webs?, J. Anim. Ecol., 78, 270–280, 2009.
Blanco, J. M., Quiñones, R. A., Guerrero, F., and Rodriguez, J.: The use of biomass spectra and allometric relations to estimate respi-ration of planktonic communities, J. Plankton Res., 20, 887–900, 1998.
relationships between mass, elemental composition and energy content, J. Sea Res., 64, 334–340, 2010.
Brown, J. H., Gillooly, J. F., Allen, A. P., Savage, V. M., and West, G. B.: Toward a metabolic theory of ecology, Ecology, 85, 1771–1789, 2004.
Brown, J. S.: Coexistence on a seasonal resource, Am. Nat., 133, 168–182, 1989.
Cammen, L. M.: Ingestion rate: an empirical-model for aquatic de-posit feeders and detritivores, Oecologia, 44, 303–310, 1980. Cammen, L. M.: The relationship between ingestion rate of deposit
feeders and sediment nutritional value, in: Ecology of Marine Deposit Feeders, Lecture Notes on Coastal and Estuarine Stud-ies, edited by: Lopez, G., Taghon, G., and Levinton, J., Springer-Verlag, New York, USA, 201–222, 1989.
Chapelle, G. and Peck, L. S.: Polar gigantism dictated by oxygen availability, Nature, 399, 114–115, 1999.
Chesson, P.: Mechanisms of maintenance of species diversity, Annu. Rev. Ecol. Syst., 31, 343–366, 2000.
de Wilde, P. A. W. J., Berghuis, E. M., and Kok, A.: Biomass and activity of benthic fauna on the Fladen Ground (Northern North Sea), Neth. J. Sea Res., 20, 313–323, doi:10.1016/0077-7579(86)90053-0, 1986.
Dickie, M., Kerr, S. R., and Boudreau, P.: Size-dependent processes underlying regularities in ecosystem structure, Ecol. Monogr., 57, 233–250, 1987.
Drgas, A., Radziejewska, T., and Warzocha, J.: Biomass size spectra of near-shore shallow-water benthic communities in the Gulf of Gda´nsk Southern Baltic Sea, Mar. Ecol., 19, 209–228, 1998. Duplisea, D. E.: Benthic organism biomass size-spectra in the Baltic
Sea in relation to the sediment environment, Limnol. Oceanogr., 45, 558–568, 2000.
Fenchel, T.: Intrinsic rate of natural increase: the relationship with body size, Oecologia, 14, 317–326, 1974.
Gage, J. D. and Bett, B. J.: Deep-sea benthic sampling, in: Methods for the study of marine benthos, edited by: Eleftheriou, A. and McIntyre, A., Blackwell, Oxford, UK, 273–325, 2005.
Gage, J. D. and Tyler, P. A.: Deep-sea biology: A natural history of organisms at the deep-sea floor, Cambridge University Press, Cambridge, UK, 1991.
Glazier, D. S.: Beyond the “3/4-power law”: variation in the intra-and interspecific scaling of metabolic rate in animals, Biol. Rev. Camb. Philos., 80, 611–662, 2005.
Gooday, A. J., Bett, B. J., Escobar-Briones, E., Ingole, B., Levin, L. A., Neira, C., Raman, A. V., and Sellanes, J.: Habitat hetero-geneity and its influence on benthic biodiversity in oxygen mini-mum zones, Mar. Ecol., 31, 125–147, 2010.
Griesbach, S., Peters, R. H., and Youakim, S.: An allometric model for pesticide bioaccumulation, Can. J. Fish. Aquat. Sci., 39, 727–735, 1982.
Hargrave, B. T.: Energy budget for a deposit-feeding amphipod, Limnol. Oceanogr., 16, 99–103, doi:10.4319/lo.1971.16.1.0099, 1971.
Henriks, A. J.: Allometric scaling of rate, age and density parame-ters in ecological models, Oikos, 86, 293–310, 1999.
Hessler, R. R. and Jumars, P. A.: Abyssal community analysis from replicate box cores in the central North Pacific, Deep-Sea Res. Pt. I, 21, 185–209, 1974.
Heip, C., Vincx, M., and Vranken, G.: The ecology of marine ne-matodes, Oceanogr. Mar. Biol., 23, 399–489, 1985.
Hildrew, A., Raffaelli, D., and Edmonds-Brown, R.: Body size: The structure and function of aquatic systems, Cambridge University Press, Cambridge, UK, 2007.
Jumars, P. A., Mayer, L. M., Deming, J. W., Baross, J. A., and Wheatcroft, R. A.: Deep-sea deposit-feeding strategies suggested by environmental and feeding constraints, Philos. T. R. Soc. S.-A, 331, 85–101, 1990.
Kaariainen, J. I.: Investigating and modeling the size structure of benthic communities, University of Southampton, School of Ocean and Earth Science, PhD thesis, 210 pp., 2006.
Kerr, S. R. and Dickie, L. M.: The biomass spectrum: a predator-prey theory of aquatic production, Columbia University Press, New York, USA, 2001.
Lampitt, R. S., Billett, D. S. M., and Rice, A. L.: Biomass of inverte-brate megabenthos from 500 to 4100 m in the northeast Atlantic Ocean, Mar. Biol., 93, 69–81, 1986.
Lampitt, R. S., Bett, B. J., Kiriakoulakis, K., Popova, E. E., Rague-neau, O., Vangriesheim, A., and Wolff, G. A.: Material supply to the abyssal seafloor in the northeast Atlantic, Prog. Oceanogr., 50, 27–63, doi:10.1016/S0079-6611(01)00047-7, 2001. Lutz, M. J., Caldeira, K., Dunbar, R. B., and Behrenfeld, M. J.:
Seasonal rhythms of net primary production and particulate or-ganic carbon flux to depth describe the efficiency of biologi-cal pump in the global ocean, J. Geophys. Res., 112, C10011, doi:10.1029/2006JC003706, 2007.
Marba, N., Duarte, C. M., and Agusti, S.: Allometric scaling of plant life history, P. Natl. Acad. Sci. USA, 104, 15777–15780, 2007.
McGurk, M. D.: Natural mortality of marine pelagic fish eggs and larvae – role of spatial patchiness, Mar. Ecol.-Prog. Ser., 34, 227–242, 1986.
Minto, C., Myers, R. A., and Blanchard, W.: Survival variability and population density in fish populations, Nature, 452, 344–347, doi:10.1038/nature06605, 2008.
Moodley, L., Middelburg, J. J., Boschker, H. T. S., Duineveld, G. C. A., Pel, R., Herman, P. M. J., and Heip, C. H. R.: Bac-teria and foraminifera: key players in a short-term deep-sea ben-thic response to phytodetritus, Mar. Ecol.-Prog. Ser., 236, 23–29, 2002.
Ohman, M. D. and Hirche, H. J.: Density-dependent mortal-ity in an oceanic copepod population, Nature, 412, 638–641, doi:10.1038/35088068, 2001.
Peters, R. H.: The ecological implications of body size, Cambridge University Press, Cambridge, UK, 1983.
Peterson, I. and Wroblewski, J. S.: Mortality rate of fishes in the pelagic ecosystem, Can. J. Fish. Aquat. Sci., 41, 1117–1120, 1984.
Pfannkuche, O., Boetius, A., Lochte, K., Lundgreen, U., and Thiel, H.: Responses of deep-sea benthos to sedimentation patterns in the north-east Atlantic in 1992, Deep-Sea Res. Pt. I„ 46, 573–596, 1999.
Quiroga, E., Quinoñes, R., Palma, M., Sellanes, J., Gallardo, V., Gerdes, D., and Rowe, G.: Biomass size-spectra of macroben-thic communities in the oxygen minimum zone off Chile, Estuar. Coast. Shelf S., 62, 217–231, 2005.