Raman-spectroscopic investigations on the crystal structure and
phonon modes of Ba(RE
1/2
Ta
1/2
)O
3
microwave ceramics
Roberto L. Moreira
a,∗, L. Abdul Khalam
b, Mailadil T. Sebastian
b, Anderson Dias
caDepartamento de F´ısica, ICEx, UFMG, C.P. 702, Belo Horizonte 30123-970, MG, Brazil bCeramic Technology Division, Regional Research Laboratory, Trivandrum 695019, India
cDepartamento de Qu´ımica, ICEB, UFOP, Ouro Preto 35400-000, MG, Brazil
Available online 14 December 2006
Abstract
Complex Ba(RE1/2Ta1/2)O3[RE = rare earth] ceramics have been prepared by solid state ceramic route and their microwave dielectric responses
were measured in the GHz range. In general, the resonators showed high dielectric constants, high quality factors and good thermal stability of the resonance frequency. However, these properties are found to depend nonlinearly on the tolerance factor, indicating structural modifications with chemical substitution. The structure of Ba(RE1/2B′′1/2)O3 [B′′= Nb, Ta] compounds has been a matter of debate for many years, because
X-ray structural data and vibrational-spectroscopic ones are controversial. In order to contribute to this debate and discuss the relationship between structure and dielectric properties, a systematic investigation of the phonon modes of several ceramics with varying RE ion was carried out. In this paper, the results of the Raman analysis and crystal structure of Ba(RE1/2Ta1/2)O3samples are presented, and correlated with the observed
microwave dielectric properties. © 2006 Elsevier Ltd. All rights reserved.
Keywords: Sintering; Spectroscopy; Dielectric properties; Perovskites; Capacitors
1. Introduction
Ceramic materials with ABO3perovskite structure are being
currently used in a large number of technological applications, such as transducers, sensors, capacitors (polar materials),
dielec-tric resonators and filters (centrosymmedielec-tric compounds).1These
materials offer the possibility of tailoring and optimising the required dielectric properties, because of the many possibil-ities of cation substitution or mixing in the A or B sites. In particular, the rapid development of microwave-based wireless telecommunications is favouring the search for new materi-als with adequate structure (i.e., centrosymmetric) and good dielectric response, which means low-loss ceramics with high
and thermally stable dielectric constant.2Among the important
dielectric resonators studied so far, a large number of works have been devoted to Ba2Ti9O20,3Zr(Sn,Ti)O4,4Ba5Nb4O15,5and to
complex perovskites of general formula A(B′
1/3B′′2/3)O3.6–8On
the other hand, A(B′
0.5B′′0.5)O3 materials have received much
less attention,9–11 although it has been recently showed that
∗Corresponding author. Tel.: +55 31 3499 5624; fax: +55 31 3499 5600.
E-mail address:[email protected](R.L. Moreira).
Ba(RE0.5B′′0.5)O3 ceramics, where RE is a rare-earth ion and
B′′= Nb or Ta, present quite adequate microwave dielectric
responses.12–14
The microwave properties of Ba(RE1/2B′′1/2)O3[B′′= Nb, Ta]
compounds are found to depend nonlinearly on the RE ionic radii, because of possible structural modifications with chem-ical substitution. However, the structure of these materials has been a matter of debate for many years, because X-ray structural data and vibrational-spectroscopic ones obtained by different authors are controversial.10,15–21In a recent work, we have
inves-tigated the Raman phonon modes of several Ba(RE1/2Nb1/2)O3
compounds, showing that tetragonal and orthorhombic struc-tures were compatible with the observed feastruc-tures, with the phase
transformation occurring with increasing ionic radius.22In this
work, the evolution of the dielectric response and the structural
changes of Ba(RE1/2Ta1/2)O3compounds are studied.
The structure of Ba(Y1/2Ta1/2)O3 compound was shown to
be cubic belonging to theFm¯3m (Z= 4)10,17–19,21with a low-temperature phase transition (PT) to a tetragonal (I4/m,Z= 4)
structure around−20◦C.17–19The same PT sequence with
tem-perature was observed at high temtem-peratures for Gd and Nd compounds, so that these materials would have the tetragonal structure at room temperature,18,19confirming the proposition of
Galasso et al.10,15for Gd. On the other hand, Doi and Hinatsu21
claimed recently that Ba(RE1/2Ta1/2)O3 would present cubic,
for Y and RE = Lu–Dy, or monoclinicP21/n(Z= 4) structures,
for RE = Tb–La, in disagreement with the tetragonal structures above for Gd and Nd. Also, although the materials with cubic
structures of Doi and Hinatsu21 agree with those of Galasso
et al.,10,15the latest authors proposed an orthorhombic Pbnm
(Z= 4) structure for the compound with lanthanum. In view
of that, the goal of this work is to present the results on the optical phonon modes and microwave dielectric behaviour
of Ba(RE1/2Ta1/2)O3ceramics (RE = Y, La, Nd–Ho, and Yb).
Detailed X-ray diffraction around chosen Bragg reflections was also used together with spectroscopic data in order to infer the most probable symmetries for these materials.
2. Experimental
Ba(RE1/2Ta1/2)O3[RE = La, Nd, Sm, Eu, Gd, Tb, Dy, Ho, Y,
and Yb] ceramics were prepared by the conventional solid state
ceramic route. High purity BaCO3(99.9%, Aldrich Chemicals,
Milwaukee WI, USA), Ta2O5(99.9%, Nuclear Fuel Complex,
Hyderabad, India), and rare-earth oxides (99.9%, Indian Rare Earths Ltd., Udyogamandal, India) were weighed in the sto-ichiometric ratio 4:1:1 and ball milled using zirconium balls in distilled water medium for 5 days. The slurries were dried
and calcined at 1375◦C for 4 h. The calcined materials were
ground, mixed thoroughly with 3 wt.% PVA solution and dried. They were again ground and uniaxially pressed into cylindrical compacts of 11–14 mm diameter and height 6–7 mm under a pressure of 100–125 MPa. The obtained compounds were sin-tered in air at 1625◦C, for 4 h. Nb
2O5(0.5 wt.%) was added to
the calcined powder of the compounds with RE = La, Eu, Gd, Tb, and Y, as sintering aid, aiming to obtain maximum densification (up to 97–99% of the theoretical densities). For the Dy sample,
0.5 wt.% of CeO2was used, while for RE = Ho and Yb a
mix-ture of 0.5 wt.% of Nb2O5and CeO2showed the best results.
The bulk densities of the sintered samples were measured by Archimedes method. Well-polished samples were used for all the measurements.
The microwave dielectric properties were measured in the region 4–6 GHz using a 8753 ET Network Analyser. The
dielec-tric constants were obtained by using the TE0 1 1 mode from
the method of Hakki and Coleman,23while the quality factors
were calculated from TE0 1δmode by the cavity method.24The
temperature coefficient of the resonance frequency (τf) was
mea-sured for each sample by considering the temperature variation of the TE0 1δresonance mode in the temperature range 25–70◦C.
X-ray diffraction was performed in a modified Rigaku powder
apparatus (Geigerflex 2037), equipped with a Cu K␣ source
(40 kV, 30 mA) and graphite monochromator, from 10◦to 100◦
2θ, with 15 s accumulations for each 0.02◦2θstep. The Raman
spectra of the samples were collected in back-scattering
config-uration with an Olympus microscopy (100×objective) attached
to a Dilor XY spectrometer. The 514.5 nm line of an Ar+ laser
(12 mW) was used as exciting line, and detection was carried out by a liquid-nitrogen cooled CCD. The spectral resolution was
better than 2 cm−1and the accumulation times were typically
three collections of 60 s. The obtained spectra were divided out
by the Bose factor25before being fitted by a sum of Lorentzian
lines.
3. Results and discussion
The microwave dielectric responses of the Ba(RE1/2Ta1/2)O3
ceramic samples were measured in the range 4–6 GHz and the
results are presented inTable 1, together with the measured
den-sities (% of the theoretical values) and the tolerance factors (t),
calculated according to the proposition of Reaney et al.26Once
Nb5+and Ta5+have the same ionic radii, thetvalues are the same
as in the Ba(RE1/2Nb1/2)O3compounds.13 Table 1shows that
the use of sintering aids led to very dense samples with relatively
uniform dielectric constants (continuous increasing ofεrfrom
Yb to Nd, then a small decrease for La). However, the unloaded quality factors (Qu×f) vary significantly, probably originated from extrinsic losses due to microstructural features (grain sizes and boundaries, space charges) rather than from the intrinsic polar phonons, once infrared measurements in these samples showed quite similar spectra (these spectra are not shown here).
The results showed in Table 1 evidence a close
relation-ship between structure and properties for the Ba(RE1/2Ta1/2)O3
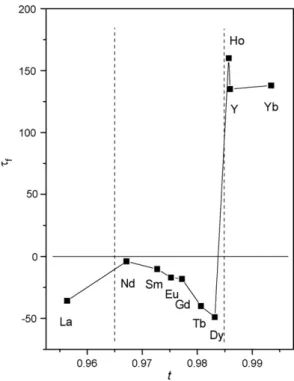
ceramics. Particularly, the temperature coefficients of the
res-onant frequency, τf, change drastically as a function of the
tolerance factors, as it is shown inFig. 1. The vertical dashed
lines in this figure indicate approximately critical t values,
according to Reaney et al.26It was observed thatτfvaries from high positive values (for Yb, Ho and Y samples) to small
nega-tive ones for the other samples. High posinega-tiveτf(together with
tclose to 1) is characteristic of cubic structures, while negative values fort< 0.985 are indications of structures of lower symme-tries, usually showing distorted or tilted octahedra.26Therefore,
these simple results from macroscopic dielectric response and tolerance factors give us a first indication of lowering symmetry for our samples, though its important to remember that the indi-cated lines for tilting changes are temperature dependent and may vary for particular samples.22,26
In order to verify the possible lowering of symmetry from Ho to Dy sample and others, we have initially performed X-ray powder diffraction around some strong Bragg reflections. We
used the indices for the cubicFm¯3m phase, since this phase
Table 1
Measured densities (ρ) and microwave dielectric response (εr,Quat 4–6 GHz,
andτf) for the Ba(RE1/2Ta1/2)O3ceramic samples together with the tolerance
factors (t)
RE ρ(%) t εr Qu×f(GHz) τf(ppm/◦C)
La 97.5 0.95633 37.1 20950 −35.7
Nd 98.0 0.96712 38.7 12050 −4.00
Sm 96.0 0.97272 37.6 15000 −10.2
Eu 97.0 0.97521 36.5 41200 −16.2
Gd 97.0 0.97725 36.0 3150 −18.2
Tb 98.0 0.98067 35.5 31900 −38.2
Dy 97.5 0.98320 34.0 20650 −48.0
Ho 98.0 0.98573 33.5 24050 130.0
Y 96.0 0.98597 33.0 50150 120.0
Fig. 1. Temperature coefficient of the resonant frequency (τf) as a function of
the tolerance factortfor Ba(RE1/2Ta1/2)O3ceramics. The vertical dashed lines
indicate approximately the critical values oftaccording to Reaney et al.26
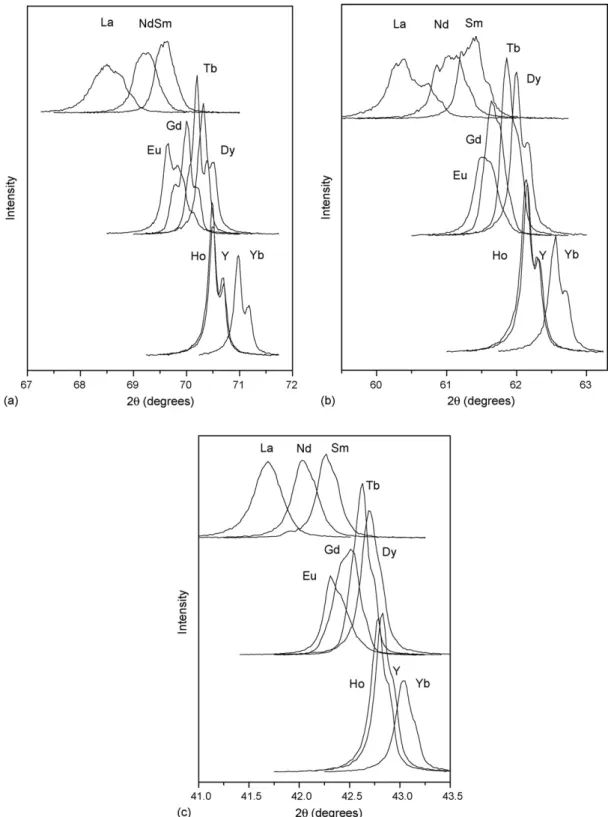
has been currently accepted for Y sample. The peaks chosen were (4 0 0), (4 4 0) and (6 2 0), located approximately at 42◦,
62◦and 70◦2θ, respectively.Fig. 2a presents the diffractograms
for the Ba(RE1/2Ta1/2)O3ceramics in the range 67–72◦2θ, i.e., a
detail for the cubic (6 2 0) peak. The doubling of the reflections
for Yb, Y and Ho accounts for the K␣1 (1.54051 ˚A) and K␣2
(1.54433 ˚A) lines. For the sample with Dy, a small peak
broad-ening and a faint shoulder at lower angles indicate the appearing of ferroelastic domains, accompanying the phase transforma-tion cubic-to-tetragonal. For the Tb sample, a third peak appears clearly and the ferroelastic distortion shows to be more impor-tant, becoming still larger for Gd and Eu. For the latest three samples, although the existence of ferroelastic domains is also clear, the peak profiles are quite different, they look like if the number of domains has increased. A second ferroelastic tran-sition from tetragonal to orthorhombic or monoclinic structure would lead to such behaviour. The same features were observed for the (4 4 0) cubic peak (Fig. 2b), while the (4 0 0) reflection showed only a broadening for samples from Dy to La, without revealing details about ferroelastic domains (Fig. 2c).
The results of the X-ray diffraction confirmed the predicted phase transformation between Ho and Dy samples, conjectured
from the observed behaviour ofτfversust(Table 1andFig. 1),
and also the ferroelastic nature of such transformation. Besides, they suggested a second transition to a still lower symmetry phase for samples with RE = Sm, Nd and La. Raman spec-troscopy is a very powerful tool to investigate the symmetries of crystalline structures, due to the very strict selection rules. For our system, at our knowledge, only Ba(Y1/2Ta1/2)O3sample has
been previously investigated by Raman spectroscopy.19
There-fore, we have undertaken Raman measurements of all samples.
The obtained spectra are presented inFig. 3(RE = Yb, Y and
Ho),Fig. 4(RE = Dy, Tb, Gd and Eu), andFig. 5(RE = Sm, Nd
and La). In general, the ceramics present a highly ordered struc-ture because the Raman lines are of narrow width. It is also clear that three types of Raman spectra are observed, accordingly to the displayed figures (the samples were grouped according to the number of observed features).
For the first group of samples (Yb, Y and Ho), the num-ber of observed bands corresponds well to that predicted by group theory27for the cubicFm¯3m(O5h) group. For this struc-ture, the reducible representation at the Brillouin zone centre
calculated with Ba ions at 8c Wyckoff sites of Td
symme-try, RE at 4a (Oh), Ta at 4b (Oh) and O at 24e (C4v) sites
is Ŵ= A1g+ Eg+ F1g+ 2F2g+ 5F1u+ F2u.19,22 Therefore, four
Raman-active bands (A1g, Egand F2g) are expected, which
cor-respond to the observed features at 101 and 384 cm−1 (F
2g),
760 cm−1(E
g) and 838 cm−1(A1g), for the Y compound. These
assignments are in complete agreement with those of Ref.19
for the same ceramic. The results of the fits for the ceramics
with Yb and Ho are presented in Table 2, together with the
band characteristics for Y. We should also notice a relatively high luminescence of the Ho compound (corrected here) and the presence of one extra weak Raman feature for all samples,
located around 311 cm−1. As it will be shown in the sequence,
this band appears for all samples and is not characteristic of the cubic phase. Therefore, we believe that some locally induced lattice distortions of the cubic structure are present, originated from stresses generated during cooling or due to the presence of some extrinsic defects.
Let us now analyze the second group of samples, presented
in Fig. 4. For these materials, nine bands are clearly seen at
104, 311, 382, 411, 527, 557, 704, 749 and 828 cm−1 (for
the Eu compound). The fitting parameters for the Dy, Tb,
Gd and Eu samples are presented in Table 3. Now, we look
for the reduced representation for these materials at the Bril-louinŴ-point. For the tetragonalI4/m(C4h5 ) structure, the site
positions (and symmetries) for the atoms are10,15: Ba in 4d
(S4), RE in 2a (C4h), Ta in 2b (C4h), O1 in 8h (Cs) and
O2 in 4e (C4). Thus, by using the factor group method,27
one has: Ŵ= 3Ag+ 3Bg+ 3Eg+ 5Au+ Bu+ 6Eu. The
relation-ship between Oh and C4h groups allows us to establish the
correlation between modes of both structures.27Moreover, once
the volume of the primitive cell is the same for both phases, all modes of the lower symmetry phase come from vibrations at
the BrillouinŴ-point. However, the absence of useful
symme-try rules for the different irreducible representations (due to the polycrystalline nature of the sample) makes difficult and
prac-Table 2
Raman fitting parameters for Ba(RE1/2Ta1/2)O3ceramics with cubic structure
Band Yb Y Ho
1 109 (12) 101 (10) 103 (11)
2 392 (21) 384 (15) 390 (17)
3 769 (59) 760 (48) 764 (41)
4 841 (26) 838 (35) 841 (28)
Fig. 2. X-ray powder diffraction for the Ba(RE1/2Ta1/2)O3ceramics. (a) Detail for the range 67–72◦2θ, showing the splitting of the cubic (6 2 0) peak. Doubling of
the reflections for Yb, Y and Ho accounts for K␣1(1.54051 ˚A) and K␣2(1.54433 ˚A) lines. (b) Detail for the range 59.5–63.3◦2θ, around the cubic (4 4 0) peak. (c)
Detail for the range 41.0–43.5◦2θ, around the cubic (4 0 0) peak.
tically useless a complete mode assignment for the observed
bands. Anyway, it is clear the peak splitting of the cubic Eg
mode (leading to the band #7 of the tetragonal structure) and
F2gbands (new band #4). Finally, it is important to remark the
high coherence between the results from Raman spectra for the tetragonal phase with the observations of the splitting of Bragg peaks and the sign variations ofτf.
The latest group of samples presented a number of Raman modes clearly higher than 9 (Fig. 5). In particular, we can
see the peak splitting for the two cubic F2g modes around
105 and 380 cm−1, which transform each one in three modes,
respectively, numbers 1, 2, 3 and 8, 9, 10 inTable 4. This table
Fig. 3. Micro-Raman spectra of the Ba(RE1/2Ta1/2)O3ceramics [RE = Yb, Y,
and Ho] with cubic symmetry.
since we have avoided bands that are not clearly seen. Now, if we consider the two lower symmetry structures proposed
for these materials, i.e., orthorhombic15and monoclinic21(we
discard the tetragonal proposition for Nd of Refs.18,19), it is
Fig. 4. Micro-Raman spectra for tetragonal Ba(RE1/2Ta1/2)O3 ceramics
[RE = Dy, Tb, Gd and Eu].
Fig. 5. Micro-Raman spectra of the Ba(RE1/2Ta1/2)O3ceramics with RE = Sm,
Nd and La (orthorhombic symmetry).
possible to calculate the number of Raman predicted modes for each case. We found 24 non-degenerated Raman-active modes
for both, orthorhombic Pbnm (D162h) and monoclinic P21/n
(C52h) structures, with the following reducible representations at the Brillouin zone centre (Wyckoff sites taken from Refs.15,21):
Ŵortho= 7Ag+ 5B1g+ 7B2g+ 5B3g+ 8Au+ 10B1u+ 8B2u+ 10B3u
andŴmono= 12Ag+ 12Bg+ 18Au+ 18Bu(all g =gerademodes
are Raman active). If we were dealing with single crystalline samples, it would be quite simple to decide above the two groups above by using polarized Raman spectra, since the totally symmetric vibrations would be seen only in parallel polarizations and also cross-polarized spectra would be very different for different scattering symmetries. However, for our case, where unpolarized spectra of polycrystalline samples are obtained, it is not possible to take benefit of such symmetry rules.
Table 3
Raman fitting parameters for Ba(RE1/2Ta1/2)O3 ceramics with tetragonal
symmetry
Band Dy Tb Gd Eu
1 103 (7) 104 (9) 102 (10) 104 (14)
2 318 (34) 316 (20) 315 (25) 311 (17)
3 386 (17) 385 (25) 384 (18) 382 (22)
4 416 (50) 415 (37) 413 (25) 411 (29)
5 548 (52) 545 (45) 533 (27) 527 (22)
6 572 (49) 571 (48) 569 (16) 557 (40)
7 720 (44) 725 (32) 711 (37) 704 (22)
8 758 (42) 759 (32) 751 (30) 749 (25)
9 837 (30) 834 (34) 832 (36) 828 (28)
Table 4
Raman fitting parameters for Ba(RE1/2Ta1/2)O3 ceramics with orthorhombic
structure
Band Sm Nd La
1 97 (5) 99 (6) 104 (8)
2 104 (10) 110 (11) 112 (16)
3 116 (7) 118 (11) 121 (13)
4 145 (22) 147 (13) 145 (25)
5 172 (28) 176 (15) 167 (20)
6 275 (45) 278 (40) 278 (35)
7 310 (21) 311 (22) 311 (19)
8 369 (14) 372 (12) 363 (13)
9 384 (20) 385 (24) 385 (22)
10 418 (39) 421 (38) 425 (31)
11 524 (34) 523 (27) 502 (31)
12 558 (25) 553 (22) 535 (42)
13 639 (38) 639 (20) 630 (40)
14 702 (35) 697 (36) 683 (38)
15 744 (22) 742 (19) 730 (21)
16 824 (32) 821 (34) 808 (40)
Position and full width at half-maximum (in parentheses) are in cm−1.
Although the Raman spectra alone are not enough to allow us to conclude about the correct space group for samples with Sm, Nd and La, it is believed that the correct one would be
Pbnm, similarly to Ba(RE1/2Nb1/2)O3compounds with the same
lanthanides.22 Indeed, as it was shown in that work, X-ray
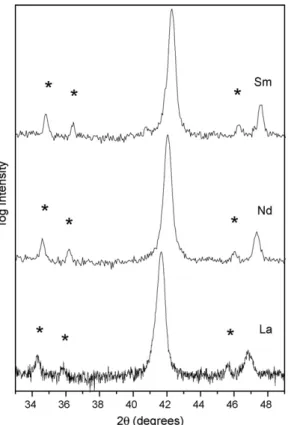
diffraction of these higher ionic radius lanthanides showed small reflections around 34◦, 36◦and 46◦ 2θ, which are compatible
with the orthorhombic structure, but not with the monoclinic
Fig. 6. X-ray diffractograms for the Ba(RE1/2Ta1/2)O3ceramics with RE = Sm,
Nd and La, in the 33–49◦ 2θ range, in which peaks with asterisks are only
compatible with an orthorhombic symmetry.
one. The presence of these peaks for Ba(RE1/2Ta1/2)O3
com-pounds (RE = Sm, Nd and La) was also observed, as it is shown in Fig. 6.22Based on these results, it is reasonable to assume that an
orthorhombicPbnmstructure accounts for the observed Raman
modes in Sm, Nd and La ceramics. This is in perfect agreement with X-ray diffraction and microwave dielectric results for these materials.
As a general trend, for frequencies above 600 cm−1a shift
to lower frequencies was observed as a function of ionic radii of the rare-earth ions (from Yb to La). This frequency range represents the vibrations of the oxygen octahedra, with RE/Ta in their interior. Changing the cations will affect the modes in
the region 600–900 cm−1, especially the A
1g(O) peak (totally
symmetric stretching of the TaO6 octahedra). For this mode,
the frequency decreased from 841 cm−1for Yb to 808 cm−1for
ceramics with lanthanum. This result agree with the observations of Dias et al.,22who showed a clear correlation between the ionic radii of lanthanides and yttrium cations and the frequencies of
the A1g mode, which decreased with increasing ionic radii (or
unit cell volume).
4. Conclusions
Complex Ba(RE1/2Ta1/2)O3 [RE = Y, Yb, Ho–Nd, and La]
ceramics have been obtained by solid state ceramic route aim-ing applications as dielectric resonators. The materials presented high dielectric constants and quality factors and good thermal stability of the resonance frequency in the GHz range. The vari-ations of the temperature coefficient of the resonance frequency with increasing RE atomic number was explained by lower-ing of symmetry, demonstrated by the peak splittlower-ing of Bragg reflections as well as the appearing of ferroelastic domains. Raman spectra allowed us to identify the symmetry groups of the samples: samples with Yb, Y and Ho are cubic and presented 4 intense Raman bands; ceramics with Dy, Tb, Gd and Eu are tetragonal, showing 9 bands; and, finally, materi-als with Sm, Nd and La are compatible with a orthorhombic group symmetry with 16 observed bands of the 24 predicted ones.
Acknowledgements
We are grateful to Prof. Marcos A. Pimenta and Prof. Ado Jorio (UFMG) for receiving us in their Raman laboratory and to Alexandre M. Moreira for the X-ray diffraction measurements. This work was partially supported by CNPq and FAPEMIG (Brazil) and CSIR (India).
References
1. Wersing, W.,Electronic Ceramics. Elsevier, London, UK, 1991. 2. Wersing, W., Microwave ceramics for resonators and filters.Curr. Opin.
Solid State Mater. Sci., 1996,1, 715–731.
3. Plourde, J. K., Linn, D. F., O’Bryan, H. M. and Thomson, J., Ba2Ti9O20as
a microwave dielectric resonator.J. Am. Ceram. Soc., 1975,58, 418–420. 4. Wolfram, G. and Gobel, H. E., Existence range, structural and
dielec-tric properties of ZrxTiySnzO4 (x+y+z= 2).Mater. Res. Bull., 1981,16,
5. Kamba, S., Petzelt, J., Buixaderas, E., Haubrich, D., Vanek, P., Kuzel, P.et al., High-frequency dielectric properties of A5B4O15microwave ceramics.
J. Appl. Phys., 2001,89, 3900–3906.
6. Tamura, H., Konoike, T., Sakabe, Y. and Wakino, K., Improved high-Q dielectric resonator with complex perovskite structure.J. Am. Ceram. Soc., 1984,67, C59–C61.
7. Sagala, D. A. and Koyasu, S., Infrared reflection of Ba(Mg1/3Ta2/3)O3
ceramics.J. Am. Ceram. Soc., 1993,76, 2433–2436.
8. Hughes, H., Iddles, D. M. and Reaney, I. M., Niobate-based microwave dielectrics suitable for third generation mobile phone base stations.Appl. Phys. Lett., 2001,79, 2952–2954.
9. Smolenskii, G. A., Isupov, V. A. and Agranovskaya, A. I., Dielectric polar-ization of solid solutions in the system (Ba, Sr)2(Ta, Nb)O6.Soviet Phys.
Solid State, 1959,1, 909–911.
10. Galasso, F. S.,Structure, Properties and Preparation of Perovskite Type Compounds(1st ed.). Pergamon Press, Headington Hill Hall, Oxford, 1969, pp. 11–17.
11. Takata, M. and Kageyama, K., Microwave characteristics of A(B1/23+B1/25+)O3ceramics.J. Am. Ceram. Soc., 1989,72, 1955–1959.
12. Sreemoolanathan, H., Ratheesh, R., Sebastian, M. T. and Mohanan, P., Ba(Tb1/2Nb1/2)O3: a new ceramic microwave dielectric resonator.Mater.
Lett., 1997,33, 161–165.
13. Khalam, L. A., Sreemoolanathan, H., Ratheesh, R., Mohanan, P. and Sebas-tian, M. T., Preparation, characterization and microwave dielectric properties of Ba(B′
1/2Nb1/2)O3[B′= La, Pr, Nd, Sm, Eu, Gd, Tb, Dy, Ho, Y, Yb and
In] ceramics.Mater. Sci. Eng. B, 2004,107, 264–270.
14. Korchagina, S. K. and Shevchuk, Y. A., Low-frequency and microwave dielectric properties of Ba2LnTaO6[Ln = La, Pr, Sm, Dy, Ce, Gd, Nd, Tm,
Tb] ceramics.Inorg. Mater., 2006,42, 66–69.
15. Galasso, F. S., Layden, G. K. and Flinchbaugh, D. E., Ba(B0.5Ta0.5)O3
ordered perovskite-type compounds, possible new laser host materials.J. Chem. Phys., 1966,44, 2703–2707.
16. Koshy, J., Kurian, J., Thomas, J. K., Yadava, Y. P. and Damodaran, A. D., Rare-earth barium niobates. Jpn. J. Appl. Phys., 1994,33, 117– 121.
17. Zurm¨uhlen, R., Colla, E., Dube, D. C., Petzelt, J., Reaney, I. M., Bell, A. et al., Structure of Ba(Y1/23+Ta1/25+)O3and its dielectric properties in the
range 102–1014Hz, 20–600 K.J. Appl. Phys., 1994,76, 5864–5873.
18. Zurm¨uhlen, R., Petzelt, J., Kamba, S., Voitsekhovskii, C., Colla, E. and Setter, N., Dielectric spectroscopy of Ba(B′
1/2B′′1/2)O3ceramics:
correla-tion between ionic parameters and microwave dielectric properties.J. Appl. Phys., 1995,77, 5341–5350.
19. Gregora, I., Petzelt, J., Pokorny, J., Vorlicek, V., Zikmund, Z., Zurm¨uhlen, R.et al., Raman spectroscopy of the zone centre improper ferroelastic tran-sition in ordered Ba(Y1/2Ta1/2)O3complex perovskite ceramic.Solid State
Commun., 1995,94, 899–903.
20. Henmi, K., Hinatsu, Y. and Masaki, N. M., Crystal structures and magnetic properties of ordered perovskites Ba2LnNbO6(Ln = Lanthanide elements).
J. Solid State Chem., 1999,148, 353–360.
21. Doi, Y. and Hinatsu, Y., Magnetic properties of ordered perovskites Ba2LnTaO6 (Ln = Y, lanthanides). J. Phys.: Condens. Matter, 2001,13,
4191–4202.
22. Dias, A., Khalam, L. A., Sebastian, M. T., Paschoal, C. W. A. and Moreira, R. L., Chemical substitution in Ba(RE1/2Nb1/2)O3(RE = La, Nd, Sm, Gd,
Tb, Y) microwave ceramics and its influence on the crystal structure and phonon modes.Chem. Mater., 2006,18, 214–220.
23. Hakki, B. W. and Coleman, P. D., A dielectric resonator method of measuring inductive capacitance in the millimeter range.IRE Trans. Microw. Theory Tech., 1960,MTT-8, 402–410.
24. Krupka, J., Derzakowski, K., Riddle, B. and Jarvis, J. B., A dielectric resonator for measurements of complex permittivity of low loss dielec-tric materials as function of temperature.Meas. Sci. Technol., 1998,9, 1751–1756.
25. Hayes, W. and Loudon, R.,Scattering of Light by Crystals. Wiley, New York, NY, 1978, p. 7, 31.
26. Reaney, I. M., Colla, E. and Setter, N., Dielectric and structural character-istics of Ba- and Sr-based complex perovskites as a function of tolerance factor.Jpn. J. Appl. Phys., 1994,33, 3984–3990.
![Fig. 3. Micro-Raman spectra of the Ba(RE 1/2 Ta 1/2 )O 3 ceramics [RE = Yb, Y, and Ho] with cubic symmetry.](https://thumb-eu.123doks.com/thumbv2/123dok_br/15706675.630071/5.892.513.798.97.501/fig-micro-raman-spectra-ba-ceramics-cubic-symmetry.webp)