Assessing genetic variability in bat species
of Emballonuridae, Phyllostomidae,
Vespertilionidae and Molossidae families
(Chiroptera) by RFLP-PCR
S.R.C. Marchesin1, M.R. Beguelini1, K.C. Faria2, P.R.L. Moreira1 and E. Morielle-Versute1
1Departamento de Zoologia e Botânica, Instituto de Biociências, Letras e Ciências Exatas, Universidade Estadual Paulista, São José do Rio Preto, SP, Brasil
2Departamento de Biologia, Universidade do Estado do Mato Grosso, Nova Xavantina, MT, Brasil
Corresponding author: S.R.C. Marchesin E-mail: sandra_marchesin@yahoo.com.br
Genet. Mol. Res. 7 (4): 1164-1178 (2008) Received July 31, 2008
Accepted August 18, 2008 Published October 28, 2008
Genetics and Molecular Research 7 (4): 1164-1178 (2008)
were low for both sequences (0.13 for RAG2 and 0.15 for 12S/16S) and reflected their conservative feature, reinforced by high values of inter- and intraspecies genetic identity (70-100%). The species with a high gene divergence were variable in the analyses of RAG2 (Eumops perotis, Artibeus lituratus, and Carollia perspicillata) and of 12S/16S (Nyctinomops laticaudatus, C. perspicillata, and Cy-nomops abrasus), and furthermore, one of them, C. perspicillata,
also showed the highest intraspecific variation. The species that exhibited the lowest variation for both genes was Molossus rufus. In the families, the highest variation was observed in the Molossi-dae and this can be attributed to variation exhibited by Eumops and
Nyctinomops species. The variations observed were interpreted as a natural variability within the species and genus that exhibited a conserved pattern in the two gene sequences in different species and family analyzed. Our data reinforce the idea that the analyses of mitochondrial and nuclear genes contribute to our knowledge of the diversity of New World bats. The genetic variability found in different taxa suggests that an additional diversity, unnoticed by other methods, can be revealed with the use of different molecular strategies.
Key words: Gene variation; RAG2 gene; 12S/16S gene; PCR-RFLP; Microchiroptera
IntRoduCtIon
The order Chiroptera is the second largest order in Mammalia, accounting for about 1116 species (Simmons, 2005a,b; Simmons et al., 2008). They are recorded from all areas of the world except the Arctic and Antarctic and few isolated oceanic islands (Koop-man, 1993; Nowak, 1999; Simmons, 2005a,b).
The classification of the highest level of Chiroptera was based on morphological data. More recently, Simmons and collaborators (Simmons, 1998; Simmons and Geisler, 1998, 2002) conducted phylogenetic analyses of family-level relationships based on a variety of different methods for treating taxonomic polymorphisms. They recognized Mi-crochiroptera comprising two infraorders (Yinochiroptera and Yangochiroptera) and sev-en superfamilies (Emballonuroidea, Rhinopomatoidea, Rhinolophoidea, Noctilionoidea, Nataloidea, Molossoidea, and Vespertilionoidea). However, some other studies includ-ing molecular analysis have strongly contradicted many of these groupinclud-ings (Hutcheon et al., 1998; Kirsch et al., 1998; Van Den Bussche and Hoofer, 2000; Hoofer and Van Den Bussche, 2001; Murphy et al., 2001; Springer et al., 2001; Teeling et al., 2000, 2002, 2003).
The greatest bat diversity is in the Neotropics, with at least 83 genera and 288 species recorded (Mickleburgh et al., 2002; Simmons, 2005a,b; Reis et al., 2007), and despite the large number of morphological characters currently used for the classification and phylogenetic reconstruction of the species of bats, the results of most studies are still incongruent (Koopman, 1970; Nowak, 1999; Simmons, 1998, 2000; Wetterer et al., 2000; Jones et al., 2002). Because of this, many comparative studies to identify the evolution-ary patterns within the order have been conducted, and among them the molecular studies have been prominent.
The development of techniques to study DNA gave rise to an enormous advance-ment in our knowledge of the evolution and genetics of several groups of animals. Al-though direct DNA sequencing in the past few years has been largely used to detect poly-morphisms, the studies with restriction fragment length polymorphism (RFLP) are useful in the detection of polymorphisms for a larger number of individuals, which is sometimes not possible in DNA sequencing.
RFLP of mitochondrial DNA (mtDNA) and nuclear DNA has proved to be a valu-able tool for population genetic and systematic studies in several mammal groups includ-ing bats (Morales and Bickham, 1995; Wetterer et al., 2000; Papasotiropoulos et al., 2002; Hartl et al., 2005).
The knowledge of the variation and behavior of variable molecular characters, and the identification of genetic markers for a particular species, provide the estimation of the evolutionary history of the species, such as the size of the population, origin, mating structure, and the establishment of a biological clock (molecular), and play a significant role in the population studies of several organisms and their biogeography.
For this reason, the present study aimed to investigate 23 species of bats belong-ing to the Molossidae, Phyllostomidae, Vespertilionidae and Emballonuridae families, applying the RFLP-polymerase chain reaction (PCR) technique, with mitochondrial and nuclear gene segments, to evaluate the structure and genetic behavior of the sequences in specimens of these complex families of bats.
MAtERIAL And MEthodS
Examined taxa
A total of 88 specimens representing 13 genera and 23 bat species belonging to the Molossidae (Cynomops abrasus, C. planirostris, Eumops auripendulus, E. bonariensis,
E. glaucinus, E. perotis, Molossops temminckii, Molossus rufus, M. molossus, Nyctino-mops laticaudatus, and N. macrotis), Phyllostomidae (Artibeus lituratus, A. planirostris,
Carollia perspicillata,and Phyllostomus discolor), Vespertilionidae (Eptesicus furinalis,
Genetics and Molecular Research 7 (4): 1164-1178 (2008)
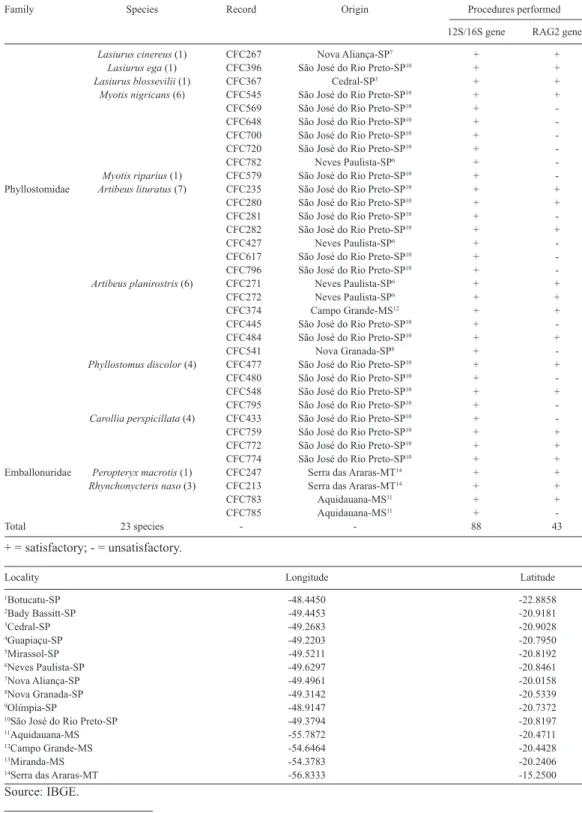
Family Species Record Origin Procedures performed
12S/16S gene RAG2 gene
Molossidae Cynomops abrasus (5) CFC270 São José do Rio Preto-SP10 +
-CFC787 São José do Rio Preto-SP10 +
-CFC788 São José do Rio Preto-SP10 +
-CFC789 São José do Rio Preto-SP10 +
-CFC790 São José do Rio Preto-SP10 +
-Cynomops planirostris (1) CFC212 Serra das Araras-MT14 +
-Eumops auripendulus (3) CFC392 São José do Rio Preto-SP10 + +
CFC399 Botucatu-SP1 +
-CFC414 São José do Rio Preto-SP10 + +
Eumops bonariensis (1) CFC459 Caiman-Miranda-MS13 + +
Eumops glaucinus (5) CFC441 Nova Aliança-SP7 + +
CFC444 São José do Rio Preto-SP10 +
-CFC539 São José do Rio Preto-SP10 +
-CFC556 Nova Granada-SP8 + +
CFC676 São José do Rio Preto-SP10 + +
Eumops perotis (5) CFC384 Bady Bassitt-SP2 + +
CFC413 São José do Rio Preto-SP10 + +
CFC508 Mirassol-SP5 + +
CFC630 Mirassol-SP5 +
-CFC633 São José do Rio Preto-SP10 +
-Molossops temminckii (7) CFC347 São José do Rio Preto-SP10 +
-CFC373 Campo Grande-MS12 +
-CFC528 Mirassol-SP5 +
-CFC546 Mirassol-SP5 +
-CFC631 Mirassol-SP5 +
-CFC653 Olímpia-SP9 +
-CFC654 Mirassol-SP5 +
-Molossus rufus (5) CFC391 São José do Rio Preto-SP10 + +
CFC434 São José do Rio Preto-SP10 + +
CFC436 São José do Rio Preto-SP10 +
-CFC609 Nova Aliança-SP7 + +
CFC675 Guapiaçu-SP4 + +
Molossus molossus (5) CFC558 São José do Rio Preto-SP10 + +
CFC560 Bady Bassitt-SP2 + +
CFC677 São José do Rio Preto-SP10 +
-CFC726 São José do Rio Preto-SP10 + +
CFC805 São José do Rio Preto-SP10 + +
Nyctinomops laticaudatus (6) CFC251 São José do Rio Preto-SP10 + +
CFC298 São José do Rio Preto-SP10 +
-CFC393 São José do Rio Preto-SP10 + +
CFC397 São José do Rio Preto-SP10 + +
CFC737 São José do Rio Preto-SP10 + +
CFC768 São José do Rio Preto-SP10 + +
Nyctinomops macrotis (6) CFC519 Campo Grande-MS12 +
-CFC520 Campo Grande-MS12 +
-CFC521 Campo Grande-MS12 +
-CFC601 Campo Grande-MS12 +
-CFC602 Campo Grande-MS12 +
-CFC624 Campo Grande-MS12 +
-Vespertilionidae Eptesicus furinalis (4) CFC294 São José do Rio Preto-SP10 + +
CFC295 São José do Rio Preto-SP10 +
-CFC297 Cedral-SP3 +
-CFC299 São José do Rio Preto-SP10 + + table 1. Discrimination of the animals analyzed in the present study by family, species, record number, origin, and procedures performed.
Family Species Record Origin Procedures performed
12S/16S gene RAG2 gene
Lasiurus cinereus (1) CFC267 Nova Aliança-SP7 + +
Lasiurus ega (1) CFC396 São José do Rio Preto-SP10 + +
Lasiurus blossevilii (1) CFC367 Cedral-SP3 + +
Myotis nigricans (6) CFC545 São José do Rio Preto-SP10 + +
CFC569 São José do Rio Preto-SP10 +
-CFC648 São José do Rio Preto-SP10 +
-CFC700 São José do Rio Preto-SP10 +
-CFC720 São José do Rio Preto-SP10 +
-CFC782 Neves Paulista-SP6 +
-Myotis riparius (1) CFC579 São José do Rio Preto-SP10 +
-Phyllostomidae Artibeus lituratus (7) CFC235 São José do Rio Preto-SP10 + +
CFC280 São José do Rio Preto-SP10 + +
CFC281 São José do Rio Preto-SP10 +
-CFC282 São José do Rio Preto-SP10 + +
CFC427 Neves Paulista-SP6 +
-CFC617 São José do Rio Preto-SP10 +
-CFC796 São José do Rio Preto-SP10 +
-Artibeus planirostris (6) CFC271 Neves Paulista-SP6 + +
CFC272 Neves Paulista-SP6 + +
CFC374 Campo Grande-MS12 + +
CFC445 São José do Rio Preto-SP10 +
-CFC484 São José do Rio Preto-SP10 + +
CFC541 Nova Granada-SP8 +
-Phyllostomus discolor (4) CFC477 São José do Rio Preto-SP10 + +
CFC480 São José do Rio Preto-SP10 +
-CFC548 São José do Rio Preto-SP10 + +
CFC795 São José do Rio Preto-SP10 +
-Carollia perspicillata (4) CFC433 São José do Rio Preto-SP10 +
-CFC759 São José do Rio Preto-SP10 + +
CFC772 São José do Rio Preto-SP10 + +
CFC774 São José do Rio Preto-SP10 + +
Emballonuridae Peropteryx macrotis (1) CFC247 Serra das Araras-MT14 + +
Rhynchonycteris naso (3) CFC213 Serra das Araras-MT14 + +
CFC783 Aquidauana-MS11 + +
CFC785 Aquidauana-MS11 +
-Total 23 species - - 88 43
table 1. Continued.
+ = satisfactory; - = unsatisfactory.
Locality Longitude Latitude
1Botucatu-SP -48.4450 -22.8858
2Bady Bassitt-SP -49.4453 -20.9181
3Cedral-SP -49.2683 -20.9028
4Guapiaçu-SP -49.2203 -20.7950
5Mirassol-SP -49.5211 -20.8192
6Neves Paulista-SP -49.6297 -20.8461
7Nova Aliança-SP -49.4961 -20.0158
8Nova Granada-SP -49.3142 -20.5339
9Olímpia-SP -48.9147 -20.7372
10São José do Rio Preto-SP -49.3794 -20.8197
11Aquidauana-MS -55.7872 -20.4711
12Campo Grande-MS -54.6464 -20.4428
13Miranda-MS -54.3783 -20.2406
14Serra das Araras-MT -56.8333 -15.2500
Genetics and Molecular Research 7 (4): 1164-1178 (2008)
Genomic DNA extraction and amplifications
Nuclear and mtDNA variation was analyzed by RFLP, performed on PCR am-plified products.
Genomic DNA was extracted from 5 to 12 g liver, kidney, lung or muscles, fresh or stored frozen following the protocol described by Sambrook et al. (1989), without phenol.
The nuclear RAG2 segments were amplified using the primers RAG2 R1 (5’ GGC TGG CCC AA(AG) AGA TCC TG 3’) and RAG2 F1 (5’ G(AG)A AGG ATT TCT TGG CAG GAG T 3’), according to Lewis-Oritt et al. (2001), and the mitochondrial sequence 12S/16S with primers 12S/16S F (5’ TGG GAT TAG ATA CCC CAC TAT 3’) and 12S/16S R (5’ TGA TTA TGC TAC CTT TGC ACG GT 3’), according to Morales et al. (1993). PCR amplifica -tions were performed in a Perkin Elmer - Gene Amp PCR System thermocycler.
Restriction digests
Digests with 10 restriction endonucleases were performed to determine the haplo-types in the sequences of 88 specimens. The PCR products were subjected to single (RsaI and EcoRI) and double digestions(EcoRI plus HaeIII, HindIII, PstI, XhoI, DraI, ScaI, DdeI, or BglII) on 6-µL aliquots of PCR products and 3 U restriction enzyme, and the conditions and buffers used were those recommended by the manufacturers. The digested PCR products were separated on ethidium bromide-stained 1.5% agarose gels. A 100-bp ladder as molecular weight marker was used to determine fragment lengths.
Statistical and genealogical analysis
The resulting fragment patterns were used to identify the RAG2 and 12S/16S haplotypes and construct two binary matrices of presence (1) or absence (0) of fragments produced by the digestions. Genetic relationships among populations and species were estimated using the PopGene 1.31 software (Yeh et al., 1999) and unweighted pair group
method with arithmetic means algorithm (Sneath and Sokal, 1973), based on Nei’s math -ematical model (1978). The five following parameters were analyzed for the detection of gene variation (h) and genetic identity (I): 1) gene variation detected by 10 enzymes for the 88 specimens for the 12S/16S gene segment and 43 specimens for RAG2 gene segment; 2) diversity index (gene variation = h) of RAG2 and 12S/16S genes for species with three or more specimens analyzed; 3) frequency of polymorphic loci; 4) genetic identity in individu-als from the species that had at least three specimens analyzed, and 5) genetic identity in 18 species for the RAG2 gene and 23 species for the 12S/16S gene, without considering the number of specimens.
RESuLtS
The amplified segments of the nuclear gene RAG2 were 1400 bp and of the 12S/16S mi
RFLP patterns of RAG2 and 12S/16S genes
The fragments obtained after digestions of PCR products with the 10 endonucleases showed different sizes and variation in the intensity of bands, even in the ones with the same molecular weight. Furthermore, a different cut pattern was observed for the RAG2 gene, which exhibited a smaller number of fragments, when compared to the 12S/16S gene. The digestion pattern of the gene segments was similar in the majority of the individuals from the same spe-cies. The comparisons of the patterns among different species revealed a variation in the size of fragments, showing evidence of differences in position and/or number of the restriction sites. However, in specimens of congeneric species, the restriction pattern was similar.
In all digestions, there were 107 different fragments combined in 139 haplotypes for the RAG2 gene and 155 fragments combined in 402 haplotypes for the 12S/16S gene (Table 2).
The assessment of the data meeting in binary matrices evaluated by the Popgene software showed the variation of the haplotypes within and among species. The mean index of gene diver-sity in the nuclear gene (h: 0.13) was lower than in the mitochondrial gene (h: 0.15) (Table 2).
Gene Number of specimens NF NH h
RAG2 43 107 139 0.13
12S/16S 88 155 402 0.15
table 2. Number of fragments (NF) and haplotypes (NH) and Nei’s (1973) genetic variation (h) produced by 10 endonucleases in single- plus double-digestions of the nuclear RAG2 and mitochondrial 12S/16S gene segments.
The values of h, frequency of polymorphic loci and I for species with three or more speci-mens analyzed in the RAG2 gene and in the 12S/16S gene are presented in Tables 3 and 4, respec-tively. It resulted in analyses of 8 species for the RAG2 gene and 16 species for the 12S/16S gene.
When individual species are considered, the values of gene variation and frequency of polymorphic loci were variable for the same gene among species and in two different genes within the species.
The highest index of gene diversity and frequency of polymorphisms for the RAG2 gene was exhibited by E. perotis (h: 0.12; 28%), followed by A. lituratus and C. perspicillata, which showed the same frequency of polymorphic loci (h: 0.12; 26%). The lowest index of diversity and frequency of polymorphisms was observed in M. rufus (h: 0.06; 17%). The spe-cies with the highest diversity and polymorphisms for the 12S/16S gene was N. laticaudatus
(h: 0.16; 44%), followed by C. perspicillata (h: 0.15; 35%) and C. abrasus (h = 0.13, 35%). The lowest variation was in M. rufus (h: 0.06; 17%) followed by P. discolor (h: 0.07; 15%).
The value of I observed in the species was high, and varied in the species and genes from 81 to 91% for RAG2 and from 80 to 92% for 12S/16S (Tables 3 and 4). The highest variation frequency in the identity was shown by C. perspicillata, in which they ranged from 74 to 97% for the RAG2 gene and by N. laticaudatus, ranging from 70 to 97% for the 12S/16S gene, followed by the specimens of M. nigricans (Vespertilionidae) ranging from 74 to 95%.
The smallest variation was exhibited by A. lituratus (I: 80-84%), followed by M. mo-lossus (I: 87-92%) in the RAG2 gene, and E. auripendulus (I: 84-88%) followed by M. rufus
(I: 90-95%) in the 12S/16S mitochondrial gene.
Genetics and Molecular Research 7 (4): 1164-1178 (2008)
the highest and lowest values of genetic identity, as observed for N. macrotis (82-100%, 12S/16S gene), in which all individuals were collected in Campo Grande, MS, for N. laticaudatus (85-100%, RAG2 gene and 70-97%, 12S/16S gene), in which all specimens were captured in São José do Rio Preto, SP, for M. temminckii (87-97%, 12S/16S gene), with individuals from São José do Rio Preto, SP, Mirassol, SP, Olímpia, SP and Campo Grande, MS, and for E. glaucinus (82-96%, 12S/16S gene), collected in São José do Rio Preto, SP, Nova Aliança, SP and Nova Granada, SP.
Family Species Number of h Percent of Mean I specimens analyzed polymorphic loci
Higher Lower
Molossidae Eumops glaucinus 3 0.09 20% 0.86 0.91 0.82
Eumops perotis 3 0.12 28% 0.81 0.90 0.74
Molossus rufus 4 0.06 17% 0.91 0.98 0.84
Molossus molossus 4 0.08 20% 0.89 0.92 0.87
Nyctinomops laticaudatus 5 0.09 23% 0.88 1.00 0.85 Phyllostomidae Artibeus lituratus 3 0.12 26% 0.82 0.84 0.80
Artibeus planirostris 4 0.07 19% 0.90 0.95 0.85
Carollia perspicillata 3 0.12 26% 0.83 0.97 0.74
Total 8 species 29 0.13 91% - -
-table 3. Gene variation (h) and genetic identity (I) values found in the 8 species with three or more specimens based on the analysis of fragments produced for the RAG2 gene after single- and double-digestions.
Family Species Number of specimens h Percent of Mean I analyzed polymorphic loci
Higher Lower
Molossidae Cynomops abrasus 5 0.13 35% 0.83 0.91 0.75
Eumops auripendulus 3 0.09 21% 0.86 0.88 0.84
Eumops glaucinus 5 0.09 23% 0.88 0.96 0.82
Eumops perotis 5 0.13 33% 0.84 0.90 0.80
Molossops temminckii 7 0.07 19% 0.92 0.97 0.87
Molossus rufus 5 0.06 17% 0.92 0.95 0.90
Molossus molossus 5 0.12 33% 0.85 0.93 0.75
Nyctinomops macrotis 6 0.07 19% 0.91 1.00 0.82
Nyctinomops laticaudatus 6 0.16 44% 0.81 0.97 0.70 Phyllostomidae Artibeus lituratus 7 0.13 35% 0.84 0.95 0.77
Artibeus planirostris 6 0.12 33% 0.86 0.92 0.77
Carollia perspicillata 4 0.15 35% 0.80 0.88 0.74
Phyllostomus discolor 4 0.07 15% 0.90 0.94 0.87 Vespertilionidae Myotis nigricans 6 0.13 34% 0.84 0.95 0.74
Eptesicus furinalis 4 0.06 19% 0.91 0.96 0.86 Emballonuridae Rhynchonycteris naso 3 0.11 24% 0.84 0.92 0.77
Total 16 species 81 0.15 99% - -
-table 4. Gene variation (h) and genetic identity (I) values found in the 16 species with three or more specimens based on the analysis of fragments produced for the 12S/16S gene after single- and double-digestions.
Molossidae Phyllostomidae Vespertilionidae Emballonuridae
ID 1 2 3 4 5 6 7 8 9 10 11 12 13 14 15 16 17 18
1 **** 0.84* 0.99 0.95 0.90 0.91 0.92 0.87 0.85 0.88 0.85 0.85 0.84 0.76* 0.87 0.81 0.87 0.87 2 **** 0.88 0.88 0.91 0.91 0.92 0.87 0.86 0.88 0.86 0.80 0.82 0.78 0.86 0.90 0.81 0.85 3 **** 0.97 0.90 0.90 0.92 0.86 0.85 0.87 0.83 0.84 0.823 0.78 0.85 0.81 0.85 0.87 4 **** 0.94 0.93 0.94 0.90 0.89 0.92 0.88 0.86 0.87 0.80 0.91 0.87 0.90 0.92 5 **** 0.99 0.99 0.95 0.93 0.96 0.94 0.88 0.91 0.80 0.95 0.90 0.90 0.93 6 **** 1.00* 0.96 0.94 0.97 0.94 0.90 0.94 0.81 0.97* 0.91 0.93 0.95 7 **** 0.95 0.94 0.97 0.93 0.90 0.92 0.82 0.95 0.90 0.92 0.95 8 **** 0.99* 0.98 0.97 0.91 0.94 0.86 0.95 0.91 0.93 0.95 9 **** 0.97 0.95* 0.89 0.93 0.85 0.95 0.91 0.92 0.95
10 **** 0.97 0.91 0.94 0.84 0.97 0.92 0.95 0.96*
11 **** 0.88 0.92 0.80 0.94 0.91 0.90* 0.92
12 **** 0.94* 0.83 0.91 0.83 0.88 0.89
13 **** 0.79* 0.94 0.87 0.93 0.92
14 **** 0.83 0.81 0.80 0.81
15 **** 0.89 0.93 0.95
16 **** 0.86 0.88
17 **** 0.93*
18 ****
table 5. Mean values of Nei’s (1978) genetic identity for the 18 species studied for the nuclear RAG2 gene.
1 - E. auripendulus; 2 - E. bonariensis; 3 - E. glaucinus; 4 - E. perotis; 5 - M. molossus; 6 - M. rufus; 7 - N. laticaudatus; 8 - A. lituratus; 9 - A. planirostris; 10 - C. perspicillata; 11 - P. discolor; 12 - M. nigricans; 13 - E. furinalis; 14 - L. ega; 15 - Lasiurus sp; 16 - L. cinereus; 17 - Peropteriyxmacrotis; 18 - R. naso. *Represent the lower and higher inter- and intrafamilial values.
Molossidae Vespertilionidae Phyllostomidae Emballonuridae
ID 1 2 3 4 5 6 7 8 9 10 11 12 13 14 15 16 17 18 19 20 21 22 23
1 **** 0.90 0.91 0.88 0.84 0.89 0.93 0.93 0.95 0.94 0.88 0.94 0.85 0.92 0.90 0.95 0.91 0.94 0.94 0.93 0.93 0.86 0.94 2 **** 0.88 0.86 0.79 0.85 0.89 0.91 0.91 0.89 0.84 0.89 0.82 0.88 0.86 0.90 0.82 0.89 0.89 0.88 0.88 0.79 0.91 3 **** 0.87 0.86 0.92 0.93 0.94 0.93 0.92 0.87 0.91 0.82 0.88 0.90 0.91 0.86 0.90 0.91 0.89 0.90 0.82 0.92 4 **** 0.79* 0.83 0.90 0.90 0.89 0.87 0.79 0.87 0.80 0.84 0.89 0.88 0.82 0.88 0.89 0.88 0.88 0.81 0.89 5 **** 0.94 0.88 0.87 0.89 0.90 0.88 0.88 0.79 0.84 0.85 0.88 0.84 0.88 0.88 0.87 0.87* 0.77 0.87 6 **** 0.93 0.93 0.95 0.95 0.93 0.93 0.83 0.89 0.89 0.93 0.88 0.92 0.92 0.91 0.91 0.79 0.91 7 **** 0.97 0.98 0.97 0.88 0.98 0.87 0.94 0.95 0.97 0.92 0.97 0.96 0.96 0.96 0.82 0.96 8 **** 0.98 0.95 0.90 0.96 0.84 0.92 0.93 0.95 0.88 0.94 0.94 0.93 0.94 0.81 0.94 9 **** 0.99* 0.93 0.97 0.86 0.94 0.94 0.98 0.91 0.96 0.97 0.94 0.97 0.83 0.96 10 **** 0.94 0.97 0.88 0.94 0.93 0.99 0.93 0.97* 0.97 0.95 0.97 0.82 0.97 11 **** 0.91 0.79 0.87 0.85 0.92 0.85 0.90 0.91 0.88 0.91 0.76 0.89 12 **** 0.89 0.95 0.95 0.98* 0.93 0.97 0.97 0.96 0.97 0.82 0.97 13 **** 0.84* 0.86 0.87 0.85 0.87 0.86 0.86 0.86 0.73* 0.87
14 **** 0.90 0.96 0.88 0.94 0.95 0.93 0.95 0.81 0.94
15 **** 0.94 0.89 0.93 0.93 0.93 0.92 0.79 0.94
16 **** 0.94 0.97 0.98 0.96 0.98 0.84 0.98*
17 **** 0.91 0.91 0.90 0.91 0.77 0.91
18 **** 0.98 0.99* 0.98 0.87 0.97
19 **** 0.98 0.98 0.85 0.97
20 **** 0.97* 0.84 0.97
21 **** 0.84 0.98
22 **** 0.86*
23 ****
table 6. Mean values of Nei’s (1978) genetic identity for the 23 species studied for the mitochondrial 12S/16S gene.
Genetics and Molecular Research 7 (4): 1164-1178 (2008)
The pairwise comparisons of the families demonstrated that the Molossidae and Ves-pertilionidae families were the most diverse for the RAG2 gene ranging from 76 to 97% and Vespertilionidae and Emballonuridae for the 12S/16S gene ranging from 73 to 98%. This diversity between species of the three families could be easily observed in the species L. ega
(Vespertilionidae) when compared to Eumops (Molossidae) where the identity indexes ranged from 76 to 80% for the RAG2 gene and when compared to P. macrotis (Emballonuridae) where the identity index was 73% for the 12S/16S gene. The families with the lowest variation were Phyllostomidae when compared to Emballonuridae for the RAG2 gene, ranging from 90 to 96%, and Phyllostomidae when compared to Molossidae, ranging from 87 to 97% for the 12S/16S gene (Tables 5 and 6).
dISCuSSIon
The difference in the number of haplotypes detected by RFLP analysis for RAG2 (139
haplotypes) and 12S/16S (402 haplotypes) genes was significant. It was very representative
considering the sequence size (approximately 1400 bp for RAG2 and 1500 bp for 12S/16S) along with the number of individuals analyzed for each sequence, demonstrating the
impor-tance and efficiency of the enzymes and gene sequence utilized.
The highest number of fragments and haplotypes generated by mtDNA when com-pared to the RAG2 nuclear gene can be attributed to a higher number of individuals analyzed for this gene, but not exclusively.
Different categories of sequences have distinct properties. In many groups, including mammals, the rate of nucleotide substitution among mitochondrial protein-coding genes is generally more rapid than the rate of nucleotide substitution among protein-coding regions of nuclear genes (Vawter and Brown, 1986). The rapid evolutionary rate exhibited by the mito-chondrial genome makes it quite sensitive in detecting recent genetic bottlenecks due to lack of recombination effects (Brown et al., 1982; Effemberger and Suchentrunk, 1999). Hence, it is fairly sensitive for historical population developments. However, it should be emphasized that this molecular marker represents only a small portion of the total genome diversity.
The nuclear genome is highly desirable as an alternative dataset to independently test mtDNA hypotheses and to essentially counteract criticisms of mtDNA. Nuclear DNA sequences have been used to address phylogenetic questions pertaining to relationships above the genus level (Perasso et al., 1989). The utility of the RAG2 gene for resolving higher-level
relationships and diversification patterns of bats has already been pointed out by some authors
(Baker et al., 2000; Van Den Bussche et al., 2002; Hoofer et al., 2003; Jones et al., 2005), as well as by Teeling et al. (2000) and Murphy et al. (2001) for other mammalian taxa. Some of
these studies verified that the value of mitochondrial sequences in phylogenetic analyses is
further enhanced when they are collected in conjunction with nuclear sequences, because they provide an independent estimate of phylogenetic relationships, which can be compared with estimates based on nuclear sequences (Lewis-Oritt et al., 2001; Springer et al., 2001).
Despite differences between the two genomes, the values of genetic variability de-tected by both genes (h: 0.13 for RAG2 and h: 0.15 for 12S/16S) were similar indicating that they are good markers for the evaluation of genetic variability in bat species.
conservatism in the cut pattern of congeneric species pointed to a molecular similarity in the sequences and fragments.
The values of I for the RAG2 and 12S/16S genes were high among individuals of the same species and in the majority of them. This feature indicates that haplotypes produced by different enzymes are conserved and display low variation. The same is observed in the analy-sis of gene variation among species, since the variation indexes were not more than 0.12 for the RAG2 gene (E. perotis, A. lituratus and C. perspicillata) and 0.16 for the 12S/16S gene (N. laticaudatus) when the 107 fragments for RAG2 gene segment and the 155 fragments for 12S/16S fragments were considered.
Despite the low values for gene variation and polymorphisms, they were different among species. The species with the highest gene variation for RAG2 and most polymorphic were E. perotis, A. lituratus, and C. perspicillata, whereas the most polymorphic species for 12S/16S were not necessarily the ones that showed the highest gene variation. N. laticaudatus was the most polymorphic and with the highest variation. C.perspicillata and C. abrasus were the second most polymorphic species; however, C. abrasus had the third highest value for gene variation.
Still, concerning the values of genetic identity within the species and considering the RAG2 gene, C. perspicillata had the highest variation, with identity indexes ranging from 74 to 97%, followed by E. perotis, ranging from 74 to 90%. The same was observed for the 12S/16S gene, in which N. laticaudatus had the highest variation in identity index, ranging from 70 to 97%. M. nigricans had the second highest variation, ranging from 74 to 95%.
These results indicate the occurrence of intraspecific variations that do not occur in the
same manner among different species of bats. Apparently, the variations are not related to the origin
of the specimens, since five of the six C. perspicillata specimens used in our study were collected in the same colony, in São José do Rio Preto, different from E. perotis, where specimens were cap-tured in different colonies, located in municipalities surrounding São José do Rio Preto.
In the present study, the small variations observed can be interpreted as a natural variability within the species and genus, which exhibited a conserved pattern in the two gene sequences in different species and families analyzed.
The conservation observed in the gene segments evaluated in the present study is shared by cytogenetic, morphologic and molecular data reported for some of the species ana-lyzed here (Eger, 1977; Patton and Baker, 1978; Freeman, 1981; Morielle-Versute et al., 1996;
Ditchfield, 2000; Leite-Silva et al., 2003; Rivers et al., 2005).
The study of Ditchfield (2000), which compared the phylogeographic patterns of
17 species of bats from the Phyllostomidae family (including A. lituratus, C. perspicillata,
Sturnira lilium, and Glossophaga soricina) and other small terrestrial mammals, using cyto-chrome b sequence revealed that the genetic variation in bats is 10 times lower than in other small mammals in the geographic variation feature and that the rate of molecular evolution is slower for bats, similar to what is described for birds.
In the present study, the highest variability was demonstrated by the Molossidae fam-ily, when only species and genus were considered for RAG2 and 12S/16S sequences. This variability can be attributed to the variation that is characteristic of some genera and species of the family, especially E.perotis and N. laticaudatus.
Genetics and Molecular Research 7 (4): 1164-1178 (2008)
a morphologically distinct group among the molossids, despite recognizing the genus as being monophyletic based on derived traces and similarities of the skull form. These variations in
Eumops are also observed in cytogenetic data, which have pointed out that the karyotypes of the Eumops are the most variable among the molossid species (Warner et al., 1974; Morielle-Versute et al., 1996; Finato et al., 2000).
The species of Vespertilionidae analyzed were similar to Molossidae species, and the differences must be related to the variations in the species of the three genera, espe-cially in Lasiurus species. L. ega had lower indexes of genetic identity when compared to other species.
Despite the little information for the Lasiurus genus, the number of species recog-nized for Lasiurus is highly variable, and reports on their evolutionary history have used cytogenetic and molecular analyses for the characterization of different species (Morales and Bickham, 1995; Marchesin and Morielle-Versute, 2004). The genus has been divided into three subgroups in accordance with fur color: hoary (L. cinereus); red (L. blossevillii,
L. borealis, L. pfeifferi), and yellow (L. xanthinus, L. ega, and L. intermedius). The yellow bats were considered so morphologically divergent that some authors proposed placing these species in the new genus Dasypterus (Tate, 1942; Hill and Harison, 1987), where this group includes L. ega.
The situation observed by the Phyllostomidae, in which the four species of three different genera had little variation, is certainly related to the small number of taxa in-cluded in our study, since the family is taxonomically diverse and, despite being karyo-typically conserved, displays morphological and molecular variability among and within different genera (Van Den Bussche, 1992; Baker et al., 1979, 2000, 2003; de Faria and Morielle-Versute, 2006; Martins et al., 2007).
Carollia perspicillata, had the second largest index of genetic variability, and can be representive of the complexity of the group. Although only four species of Carollia
had been recognized until the research by Koopman (1993), eight species are currently recognized (Wright et al., 1999; Solari and Baker, 2006), and the recognition of these spe-cies has been possible by combined analysis of different sets of data, especially molecular (mtDNA) sequences and cytogenetic data (Baker et al., 2002; Solari and Baker, 2006).
The analyses in the present study indicate a higher genetic homogeneity for the nuclear gene. The polymorphisms generated by the RAG2 gene seem to be more informa-tive than the ones generated by 12S/16S, at least for the taxa studied. These results are in accordance with Springer et al. (2001) who compared the performance of mitochondrial and nuclear datasets and observed that nuclear genes are more efficient in clade recon-struction than are mitochondrial genes. The authors claimed that nuclear genes are less affected by nucleotide substitutions.
strategies, reinforcing the importance of this methodology in the evolutionary analysis of the group.
ACKnowLEdGMEntS
The authors are grateful to CAPES (Coordenadoria de Aperfeiçoamento de Pessoal de Ensino Superior), FAPESP (Fundação de Amparo à Pesquisa do Estado de São Paulo) and
FUNDUNESP (Fundação para o Desenvolvimento da UNESP) for financial support.
REFEREnCES
Baker RJ, Bass RA and Johnson MA (1979). Evolutionary implications of chromosomal homology in four genera of stenodermine bats (Phyllostomidae, Chiroptera). Evolution 33: 220-226.
Baker RJ, Porter CA, Patton JC and Van Den Bussche RA (2000). Systematics of bats of the family Phyllostomidae based on RAG2 DNA sequences. Occas. Pap. Tex. Tech Univ. Mus. 200: 1-16.
Baker RJ, Solari S and Hoffman FG (2002). A new Central American species from the Carollia brevicauda complex.
Occas. Pap. Tex. Tech Univ. Mus. 217: 1-11.
Baker RJ, Hoofer SR, Porter CA and Van-Den-Bussche RA (2003). Diversification among New World leaf-nosed bats: an evolutionary hypothesis and classification inferred from digenomic congruence of DNA sequence. Occas. Pap. Tex. Tech Univ. Mus. 230: 1-32.
Brown WM, Prager EM, Wang A and Wilson AC (1982). Mitochondrial DNA sequences of primates: tempo and mode of evolution. J. Mol. Evol. 18: 225-239.
de Faria KC and Morielle-Versute E (2006). Genetic relationships between Brazilian species of Molossidae and Phyllostomidae (Chiroptera, Mammalia). Genetica 126: 215-225.
Ditchfield AD (2000). The comparative phylogeography of Neotropical mammals: patterns of intraspecific mitochondrial DNA variation among bats contrasted to nonvolant small mammals. Mol. Ecol. 9: 1307-1318.
Effemberger S and Suchentrunk F (1999). RFLP analysis of the mitochondrial DNA of otters (Lutra lutra) from Europe implications for conservation of a flagship species. Biol. Conserv. 90: 229-234.
Eger JL (1977). Systematics of the genus Eumops (Chiroptera: Molossidae). Life Sci. Contrib. Royal Ontario Mus. 110: 1-69.
Finato AO, Varella-Garcia M, Tajara EH, Taddei VA, et al. (2000). Intrachromosomal distribution of telomeric repeats in
Eumops glaucinus and Eumops perotis (Molossidae, Chiroptera). Chromosome Res. 8: 563-569.
Freeman PW (1981). A multivariate study of the family Molossidae (Mammalia, Chiroptera): Morphology, ecology, evolution (Fieldiana). Field. Zool. 7: 1-105.
Hartl GB, Zachos FE, Nadlinger K, Ratkiewicz M, et al. (2005). Allozyme and mitochondrial DNA analysis of French red deer (Cervus elaphus) populations: genetic structure and its implications for management and conservation. Mamm. Biol. 70: 24-34.
Hill JE and Harrison DL (1987). The baculum in the Vespertilioninae (Chiroptera: Vespertilionidae) with a systematic review, a synopsis of Pipistrellus and Eptesicus, and the descriptions of a new genus and subgenus. Bull. Br. Mus.
(Nat. Hist.) Zool. 52: 225-305.
Hoofer SR and Van Den Bussche RA (2001). Phylogenetic relationships of Plecotine bats and allies based on mitochondrial ribosomal sequences. J. Mamm. 82: 131-137.
Hoofer SR, Reeder SA, Hansen EW and Van Den Bussche RA (2003). Molecular phylogenetics and taxonomic review of Noctilionoid and Vespertilionoid bats (Chiroptera: Yangochiroptera). J. Mamm. 84: 809-821.
Hutcheon JM, Kirsch JA and Pettigrew JD (1998). Base-compositional biases and the bat problem. III. The questions of microchiropteran monophyly. Philos. Trans. R. Soc. Lond. B Biol. Sci. 353: 607-617.
Jones KE, Purvis A, MacLarnon A, Bininda-Emonds OR, et al. (2002). A phylogenetic supertree of the bats (Mammalia: Chiroptera). Biol. Rev. Camb. Philos. Soc. 77: 223-259.
Jones KE, Bininda-Emonds ORP and Gittleman JL (2005). Bats, clocks, and rocks: diversification patterns in Chiroptera.
Evolution 59: 2243-2255.
Kirsch JAW, Hutcheon JM, Byrnes GP and Lloyd BD (1998). Affinities and historical zoogeography of the New Zealand short-tailed bat, Mystacina tuberculata Gray 1843, inferred from DNA-hybridization comparison. J. Mamm. Evol.
Genetics and Molecular Research 7 (4): 1164-1178 (2008)
Koopman KF (1970). Zoogeography of Bats. In: About Bats: a Chiropteran Biology Symposium (Slaughter BH and Walton DW, eds.). Southern Methodist University Press, Dallas, 29-46.
Koopman KF (1993). Order Chiroptera. In: Mammals Species of the World: a Taxonomic and Geographic Reference (Wilson DE and Reeder DM, eds.). Smithsonian Institution Press, Washington and London, 137-241.
Leite-Silva C, Santos N, Fagundes V, Yonenaga-Yassuda Y, et al. (2003). Karyotypic characterization of the bat species
Molossus ater, M. molossus and Molossops planirostris (Chiroptera, Molossidae) using FISH and banding techniques.
Hereditas 138: 94-100.
Lewis-Oritt N, Van Den Bussche RA and Baker RJ (2001). Molecular evidence for the evolution of piscivory in the genus
Noctilio (Chiroptera: Noctilionidae) during the last three million years. J. Mamm. 82: 748-759.
Marchesin SRC and Morielle-Versute E (2004). Chromosome studies of Brazilian vespertilionid Lasiurus cinereus and
Lasiurus ega (Mammalia-Chiroptera). Iheringia Ser. Zool. 94: 443-446.
Martins FM, Ditchfield AD, Meyer D and Morgante JS (2007). Mitochondrial DNA phylogeography reveals marked population structure in the common vampire bat, Desmodus rotundus (Phyllostomidae). J. Zool. Sys. Evol. Res. 45: 372-378.
Mickleburgh S, Phuston AM and Racey PA (2002). A review of the global conservation status of bats. Oryx 36: 18-34. Morales JC and Bickham JW (1995). Molecular systematics of the genus Lasiurus (Chiroptera: Vespertilionidae) based on
restriction-site maps of the mitochondrial ribosomal genes. J. Mamm. 76: 730-749.
Morales JC, Patton JC and Bickham JW (1993). Partial endonuclease digestion mapping of restriction sites using PCR-amplified DNA. PCR Methods Appl. 2: 228-233.
Morielle-Versute E, Varella-Garcia M and Taddei VA (1996). Karyotypic patterns of seven species of molossid bats (Molossidae, Chiroptera). Cytogenet. Cell Genet. 72: 26-33.
Murphy WJ, Eizirik E, Johnson WE, Zhang YP, et al. (2001). Molecular phylogenetics and the origins of placental mammals. Nature 409: 614-618.
Nei M (1973). Analysis of gene diversity in subdivided populations. Proc. Natl. Acad. Sci. U.S.A. 70: 3321-3323. Nei M (1978). Estimation of average heterozygosity and genetic distance from a small number of individuals. Genetics
89: 583-590.
Novacek M (1980). Phylogenetic Analysis of the Chiropteran Auditory Region. In: International Bat Research Conference (5, 1978, Albuquerque) (Wilson DE and Gardner AL, eds.). Texas Tech Press, Lubbock, 317-330.
Nowak RM (1999). Walker’s Mammals of the World. The Johns Hopkins University Press, Baltimore and London. Papasotiropoulos V, Klossa-Kilia E, Kilias G and Alahiotis S (2002). Genetic divergence and phylogenetic relationships in
grey mullets (Teleostei: Mugilidae) based on PCR-RFLP analysis of mtDNA segments. Biochem. Genet. 40: 71-86. Patton JC and Baker RJ (1978). Chromosomal homology and evolution of phyllostomatoid bats. Sys. Zool. 27: 449-462. Perasso R, Baroin A, Qu LH, Bachellerie JP, et al. (1989). Origin of the algae. Nature 339: 142-144.
Pierson ED, Sarich VM, Lowenstein JM, Daniel MJ, et al. (1986). A molecular link between the bats of New Zealand and South America. Nature 323: 60-63.
Reis NR, Shibatta OA, Peracchi AL, Pedro WA, et al (2007). Sobre Morcegos Brasileiros. In: Morcegos do Brasil (Reis NR, Peracchi AL, Pedro WA and Lima IP, eds.). Universidade Estadual de Londrina, Londrina, 17-25.
Rivers NM, Butlin RK and Altringham JD (2005). Genetic population structure of Natterer’s bats explained by mating at swarming sites and philopatry. Mol. Ecol. 14: 4299-4312.
Sambrook J, Fritsch F and Maniatis T (1989). Molecular Cloning. Cold Spring Harbor Laboratory Press, New York. Simmons NB (1998). A Reappraisal of Interfamilial Relationships of Bats. In: Bat: Biology and Conservation (Kunz TH
and Racey PA, eds.). Smithsonian Institution Press, London, 3-26.
Simmons NB (2000). Bat Phylogeny: an Evolutionary Context for Comparative Studies. In: Ontogeny, Functional Ecology and Evolution of Bats (Adams RA and Pedersen SC, eds.). Cambridge University Press, Cambridge, 9-58. Simmons NB (2005a). Chiroptera. In: The Rise of Placental Mammals (Rose KD and Archibald D, eds.). Johns Hopkins
University, Baltimore, 159-174.
Simmons NB (2005b). Order Chiroptera. In: Mammal Species of the World: a Taxonomic and Geographic Reference (Wilson DE and Reeder DM, eds.). 3rd edn. Johns Hopkins University Press, Baltimore, 312-529.
Simmons NB and Geisler JH (1998). Phylogenetic relationships of Icaronycteris, Archaeonycteris, Hassianycteris, and
Palaeochiropteryx to extant bat lineages, with comments on the evolution of echolocation and foraging strategies in Microchiroptera. Bull. Am. Mus. Nat. Hist. 235: 1-182.
Simmons NB and Geisler JH (2002). Sensitivity analysis of different methods of coding taxonomic polymorphism: an example from higher-level bat phylogeny. Cladistics 18: 571-584.
Smith JD (1976). Chiropteran Evolution. In: Biology of Bats of the New World Family Phyllostomidae, Part I (Baker RJ, Jones JK Jr and Carter DC, eds.). Spec. Publ. Mus. Texas Tech Univ., Lubbock, 49-69.
Sneath PHA and Sokal RR (1973). Numerical Taxonomy: the Principles and Practice of Numerical Classification. W.H. Freeman, San Francisco.
Solari S and Baker RJ (2006). Mitochondrial DNA sequence, karyotypic and morphological variations in the Corollia castanea species group complex (Chiroptera-Phyllostomidae), with description of a new species. Occas. Pap. Mus. Texas Tech Univ. 254: 1-16.
Springer MS, DeBry RW, Douady C, Amrine HM, et al. (2001). Mitochondrial versus nuclear gene sequences in deep-level mammalian phylogeny reconstruction. Mol. Biol. Evol. 18: 132-143.
Tate GHH (1942). Results of the Archbold Expeditions. No. 47. Review of the vespertilionine bats with special attention to the genera and species in the Archbold Collection. Bull. Am. Mus. Nat. Hist. 80: 221-297.
Teeling EC, Scally M, Kao DJ, Romagnoli ML, et al. (2000). Molecular evidence regarding the origin of echolocation and flight in bats. Nature 403: 188-192.
Teeling EC, Madsen O, Van den Bussche RA, de Jong WW, et al. (2002). Microbat paraphyly and the convergent evolution of a key innovation in Old World rhinolophoid microbats. Proc. Natl. Acad. Sci. U. S. A. 99: 1431-1436.
Teeling EC, Madsen O, Murphy WJ, Springer MS, et al. (2003). Nuclear gene sequences confirm an ancient link between New Zealand’s short-tailed bat and South American noctilionoid bats. Mol. Phylogenet. Evol. 28: 308-319. Teeling EC, Springer MS, Madsen O, Bates P, et al. (2005). A molecular phylogeny for bats illuminates biogeography and
the fossil record. Science 307: 580-584.
Van Den Bussche RA (1992). Restriction-site variation and molecular systematics of New world leaf-nosed bats. J. Mamm. 73: 29-42.
Van Den Bussche RA and Hoofer SR (2000). Further evidence for inclusion of the New Zealand short-tailed bat (Mystacina tuberculata) within Noctilionoidea. J. Mamm. 81: 865-874.
Van Den Bussche RA, Hoofer SR and Simmons NB (2002). Phylogenetic relationships of mormoopid bats using mitochondrial gene sequences and morphology. J. Mamm. 83: 40-48.
Van Valen TA (1979). The evolution of bats. Evol. Theor. 4: 104-121.
Vawter L and Brown WM (1986). Nuclear and mitochondrial DNA comparisons reveal extreme rate variation in the molecular clock. Science 234: 194-196.
Warner JW, Patton JL, Gardner AL and Baker RJ (1974). Karyotypic analyses of twenty-one species of molossid bats (Molossidae: Chiroptera). Can. J. Genet. Cytol. 16: 165-176.
Wetterer AL, Rockman MV and Simmons NB (2000). Phylogeny of phyllostomid bats (Mammalia, Chiroptera): data from diverse morphological systems, sex chromosomes, and restriction sites. Bull. Am. Mus. Natl. Hist. 248: 173-184. Wright AJ, Van Den Bussche RA, Lim BK, Engstrom MD, et al. (1999). Systematics of the genera Carollia and Rhinophylla
based on the cytochrome-B gene. J. Mamm. 80: 1202-1213.