www.the-cryosphere.net/9/1025/2015/ doi:10.5194/tc-9-1025-2015
© Author(s) 2015. CC Attribution 3.0 License.
The influence of surface characteristics, topography and
continentality on mountain permafrost in British Columbia
A. Hasler1,2, M. Geertsema1, V. Foord1, S. Gruber3, and J. Noetzli4
1Ministry of Forest, Land and Natural Resources Operation of British Columbia, 1044 Fifth Avenue, Prince George, BC V2L 5G4, Canada
2Department of Geosciences, University of Fribourg, Chemin du Musee 4, 1700 Fribourg, Switzerland 3Department of Geography and Environmental Studies, Carleton University, 1125 Colonel By Drive, Ottawa, ON K1S 5B6, Canada
4Glaciology, Geomorphodynamics and Geochronology, Department of Geography, University of Zurich, Winterthurerstr 190, 8057 Zurich, Switzerland
Correspondence to: A. Hasler (andreas.hasler@unifr.ch)
Received: 2 July 2014 – Published in The Cryosphere Discuss.: 5 September 2014 Revised: 16 April 2015 – Accepted: 20 April 2015 – Published: 20 May 2015
Abstract. Thermal and surface offsets describe mean an-nual ground temperature relative to mean anan-nual air tem-perature, and for permafrost modelling they are often pre-dicted as a function of surface characteristics and topog-raphy. As macroclimatic conditions influence the effective-ness of the underlying processes, knowledge of surface- and topography-specific offsets is not easily transferable between regions, limiting the applicability of empirical permafrost distribution models over areas with strong macroclimatic gradients.
In this paper we describe surface and thermal offsets derived from distributed measurements at seven field sites in British Columbia. Key findings are (i) a surprisingly small variation of the surface offsets between different sur-face types; (ii) small thermal offsets at all sites (exclud-ing wetlands and peat); (iii) a clear influence of the micro-topography at wind exposed sites (snow-cover erosion); (iv) a north–south difference of the surface offset of 4◦C in ver-tical bedrock and of 1.5–3◦C on open (no canopy) gentle slopes; (v) only small macroclimatic differences possibly caused by the inverse influence of snow cover and annual air temperature amplitude. These findings suggest that topocli-matic factors strongly influence the mountain permafrost dis-tribution in British Columbia.
1 Introduction
For mountain permafrost the influence of (steep) topogra-phy is well described for some mid-latitude mountain ranges considering mesoscale variability in solar radiation (insola-tion), air temperature, snow deposition and snow redistribu-tion (cf. Harris et al., 2009 for a literature review on this sub-ject). The influence of surface characteristics on mountain permafrost is addressed in some case studies (Gubler et al., 2011; Schneider et al., 2012) for high-alpine surface types. British Columbia’s higher latitude with mountain permafrost extending below treeline, however, alters the influence of the surface characteristics and topography compared to the per-mafrost in the Alps or other mid-latitude mountain ranges. Studies elsewhere in Canada (Harris, 2008; Bonnaventure et al., 2012) are either not spatially distributed or rely on the basal temperature of snow measurements so they can not be easily extrapolated (without local permafrost evidences) to our study region. Hence, we aim to estimate the region-specific variation of the temperature offsets (SO, TO) depen-dent at micro- and mesoscale gradients in surface character-istics and topography.
At the macroclimatic scale, variations in MAAT are the primary determinant of permafrost occurrence (Throop et al., 2012). While MAAT variations are relatively easily cap-tured in flat terrain with interpolation products or climate re-analysis data sets, mountain topography adds large uncer-tainties to such estimates due to variations in the air temper-ature lapse rate (Fiddes and Gruber, 2014). Furthermore, an important issue when estimating the permafrost conditions on a large scale is whether the surface offset is strongly in-fluenced by macroclimatic parameters (e.g. precipitation and continentality). These macroclimatic parameters are thought to modify the effectiveness of the physical processes respon-sible for the surface offsets and cause, together with vari-ations in MAAT alone, meridional gradients on the conti-nental scale of the lower limit of mountain permafrost (cf. King, 1986; Harris, 1989) and the southern extent of lowland permafrost (Harris, 1986). Guodong and Dramis (1992) re-port different dependencies of the lower limit of mountain permafrost on continentality found for different latitudes in China. A recent study on the Alpine-wide permafrost distri-bution found a slightly positive dependency on precipitation of the probability of rock glaciers being active (Boeckli et al., 2012). A field investigation from different sites in Nor-way attributed the decrease of the lower limit of mountain permafrost to the decrease in snow water equivalent with in-creasing continentality as well as to effects of predominant surface types (Farbrot et al., 2011). This question is another focus of this study because British Columbia and our field sites span a large gradient in macroclimatic conditions.
Due to the patchy characteristics of our data, this pa-per comprises a description of the data processing and re-sulting uncertainties in SO and TO (Sects. 3.1 and 3.2). In Sect. 4.1 we present the field data and discuss them re-garding the three mentioned gradients (surface characteris-tics in Sect. 4.2, topography in Sect. 4.3 and macroclimate in
Sect. 4.4). These three gradients are important for the moun-tain permafrost distribution and the interpretation of its pre-diction (permafrost maps) in British Columbia.
2 Field sites and instrumentation 2.1 General site description
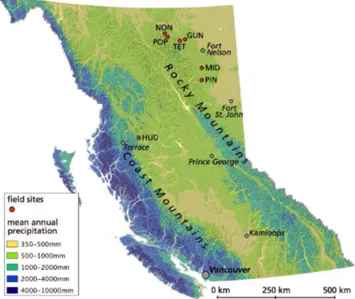
The macrotopography of British Columbia is characterized by two major mountain systems, the Coast Mountains and the Rocky Mountains, with plateaus and lesser ranges be-tween them (Fig. 1). Being at mid-latitude (49–60◦N) within the west-drift zone, the general meridional orientation (NNW to SSE) of these mountain systems is responsible for pro-nounced differences in climatic conditions between their coastal and continental sides. Large gradients in precipita-tion and continentality (annual temperature amplitude for a given latitude) characterise the climate of British Columbia (Fig. 1). These differences exist both at a macroclimatic scale with continentality increasing with distance from the Pacific Ocean and at a mesoscale with orographic effects such as pronounced temperature inversions in the interior valleys. Hence, an extreme west–east precipitation gradient exists in the Coast Mountains and continentality is particularly pro-nounced at lower elevations in, and east of, the Rocky Moun-tains (Wang et al., 2012).
The seven field sites of this study are located in northern BC between 54◦45′and 59◦N. One is in the Coast Mountains (HUD: Hudson Bay Mountain), two are in the Rocky Moun-tains (NON: Nonda, POP: Poplars) and four are at the occi-dental edge of the Rocky Mountains (GUN: Mount Gunnel, TET: Tetsa, PIN: Pink Mountain, MID: Middlefork) (Fig. 1). HUD, NON, GUN and PIN are high-elevation sites, which means they are above the treeline and at or near mountain-tops while the other sites are below treeline and close to the valley floor or in relatively flat areas. The climate at the field sites ranges from moderate-humid alpine (Coast Moun-tains) to subarctic continental (low-land north-eastern BC). The mean annual air temperature at all sites is in the range of
−5 to+1◦C (Wang et al., 2012); hence all sites lie close to the climatic boundary for permafrost to exist.
The Nonda (1670 m a.s.l.), Pink Mountain (1750 m a.s.l.) and Hudson Bay Mountain sites (∼1950–2150 m a.s.l.) are clearly within the Alpine Tundra biogeoclimatic zone (Mei-dinger and Pojar, 1991) above treeline. The Mount Gunnel sites (1470 m a.s.l.) are at the lower boundary of the Alpine Tundra zone above treeline, but transitioning into the forested Black and White Boreal Spruce zone. With the exception of Hudson Bay Mountain, all of these alpine sites are strongly windswept, resulting in very little snow cover.
Figure 1. Overview of the field sites on a precipitation map of
British Columbia. The field sites span a latitudinal range from 54◦45′to 59◦N and are located within or close to the Coast Moun-tains and Rocky MounMoun-tains. These two main mountain ranges cause large gradients in precipitation and continentality within short dis-tance (precipitation data from Wang et al., 2012).
spruce (Picea mariana)), a treeless cold air drainage meadow and a zonal forest of white spruce (Picea glauca) and as-pen (Populus tremuloides). The Poplars (750–940 m a.s.l.) and Tetsa (1000 m a.s.l.) sites are forested and fall within the Spruce Willow Birch zone. Both are instrumented along elevation gradients on north- and south-facing exposures. There is striking aspect control on vegetation here. South-facing slopes host trembling aspen (Populus tremuloides) and lodgepole pine (Pinus contorta) and may have a grassy understory. Forest floors have relatively thin humus forms. North-facing slopes tend to have a sparse cover of black spruce (Picea mariana) and very thick mor (mossy) humus forms. In the latter forest type, permafrost can usually be found some 60 cm below the forest floor.
Using instrumental data from nearby Environment Canada weather stations, climate trends (1912–2003) for the region containing the Hudson Bay Mountain field site have in-creased significantly by 0.8◦C in MAAT (Egginton, 2005). Climate trends (1937–2003) for the region containing the re-maining field sites in north-east BC have a statistically sig-nificant increase of 1.3◦C in MAAT, 3.3◦C significant in-crease in extreme minimum temperature and a 42 % signif-icant decrease in winter precipitation (Egginton, 2005). The large part of this warming trend occurred between 1970 and 1990. A brief analysis with updated time series from two En-vironment Canada weather stations in the two regions shows no further warming trend in MAAT for the last 2 decades (1991–2012). For the observation period (2008–2012), the
Water Supply and Snow Survey Bulletin shows snow indices
in the range of 75 to 140 % from the long-term mean (1981– 2010) in the two regions closest to our field sites (River Fore-cast Center, 2012a, b).
2.2 Measurement parameters and instrumentation The seven field sites vary regarding the sampling of the local conditions (topographic situation and surface charac-teristics) and so does the measurement setup. This non-standardised and not strictly systematic design is on one side due to absence/presence of various local conditions between field sites: e.g. steep bedrock is present only at some high-elevation sites whereas surface characteristics such as thick moss layers or forests are not present there (Table 1). How-ever, some parameters are challenging to obtain and of lim-ited use due to extreme small-scale variability (e.g. air tem-perature in rock faces or direct radiation in forests). The dis-tance between individual measurement locations ranges from some decametres (e.g. GUN and NON site) to a few kilome-tres (low-elevation sites POP, TET and MID). For these rea-sons, meteorological parameters are measured at one central location (wx) per high-elevation site. The low-elevation sites have air temperature measurements at each location similar to the setup of comparable studies in north-western Canada (Karunaratne and Burn, 2003).
The measured parameters are the temperatures of the air (Tair), the ground-surface (Tsurf) and the ground (Tground). The ground temperatures are sensed at a depth between 0.3 and 1.3 m for soils and debris but at 0.1 m depth for bedrock. At the central weather stations (wx) other parameters such as rainfall, relative humidity, direct short wave irradiation, wind direction and speed and barometric pressure are mea-sured but used only in the Supplement in the present anal-ysis. The weather stations are HOBO weather station (H-21 or U30; Onset) and air temperature is measured in a solar radiation shield at 1.4 m above ground with a S-THB-M002 Temperature/RH Smart Sensor (Tempcon), which provides an accuracy of ±0.2◦C above 0◦C and of ±0.4◦C above
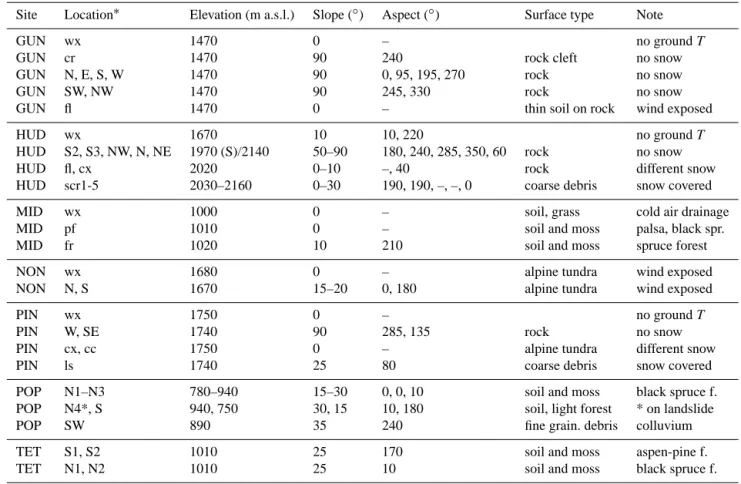
Table 1. Measurement locations at all field sites. Locations with common parameters are summarised.
Site Location∗ Elevation (m a.s.l.) Slope (◦) Aspect (◦) Surface type Note
GUN wx 1470 0 – no groundT
GUN cr 1470 90 240 rock cleft no snow
GUN N, E, S, W 1470 90 0, 95, 195, 270 rock no snow
GUN SW, NW 1470 90 245, 330 rock no snow
GUN fl 1470 0 – thin soil on rock wind exposed
HUD wx 1670 10 10, 220 no groundT
HUD S2, S3, NW, N, NE 1970 (S)/2140 50–90 180, 240, 285, 350, 60 rock no snow
HUD fl, cx 2020 0–10 –, 40 rock different snow
HUD scr1-5 2030–2160 0–30 190, 190, –, –, 0 coarse debris snow covered
MID wx 1000 0 – soil, grass cold air drainage
MID pf 1010 0 – soil and moss palsa, black spr.
MID fr 1020 10 210 soil and moss spruce forest
NON wx 1680 0 – alpine tundra wind exposed
NON N, S 1670 15–20 0, 180 alpine tundra wind exposed
PIN wx 1750 0 – no groundT
PIN W, SE 1740 90 285, 135 rock no snow
PIN cx, cc 1750 0 – alpine tundra different snow
PIN ls 1740 25 80 coarse debris snow covered
POP N1–N3 780–940 15–30 0, 0, 10 soil and moss black spruce f.
POP N4*, S 940, 750 30, 15 10, 180 soil, light forest * on landslide
POP SW 890 35 240 fine grain. debris colluvium
TET S1, S2 1010 25 170 soil and moss aspen-pine f.
TET N1, N2 1010 25 10 soil and moss black spruce f.
∗Location labels: wx is weather station; cr is crack; N, E, S, W are aspects; fl is flat; cx is convex; cc is concave; scr is scree; pf is permafrost; fr is forest; ls is landslide.
in hydrological conditions (wetlands, peats, etc.) are barely considered in this study despite their important role for the permafrost distribution in low-land areas. Furthermore, de-tailed air temperature and surface temperature lapse rates, which are important for permafrost in valley bottoms in the very north of BC (Lewkowicz and Bonnaventure, 2011), can-not be extracted from our data (but a brief comparison of nearby high- and low-elevation sites indicates pronounced winter inversions). Table 1 summarises the topographic sit-uations and surface characteristics of the 41 locations with ground temperature measurements and the three weather sta-tions analysed in this study. In the discussion in Sect. 4.2 we will refer to these local conditions in more detail.
3 Data processing and analysis methods
3.1 Pre-processing of raw temperature time series At the field sites MID, NON and POP measurements were initiated in summer 2007, whereas data acquisition started in 2008 for the other field sites. The data time series for this analysis were retrieved between summer 2011 and 2013 for the last time. In the Supplement a detailed description of
fil-tering and an overview of the data completeness is given. The filtering produces gaps of different characteristics: (a) auto-mated filtering of invalid/corrupted values (not numeric or out of realistic range) cause short gaps (single values); (b) manual filtering of values from broken sensors (e.g. water damage or cable disruption) are applied over long time peri-ods and cause long gaps (weeks to months). Because of these gaps it is not possible to directly compare all time series and simply calculate annual means for the same years. To ac-count for this data characteristic we applied the processing described in Sect. 3.2.
For all the data analysed in this study there is at least 1 continuous year of valid data. One exception is the air tem-perature measurement of the weather station at Mount Gun-nel. The very good correlation of 11 months of existing data with the surface temperature recorded in a nearby rock cleft allows a reliable estimation of the mean annual air tempera-tures (cf. Supplement).
3.2 Calculation of mean annual temperatures and their inter-comparability
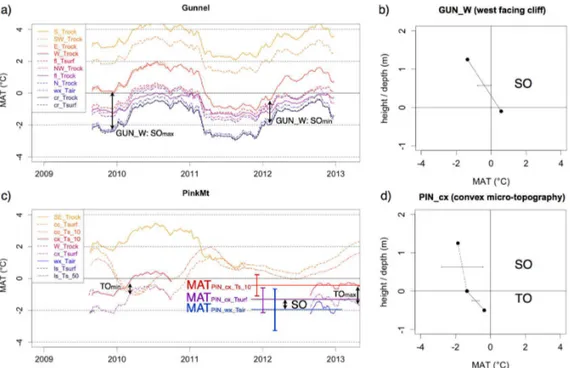
Sur-Figure 2. The running mean annual temperatures (running MAT) at two field sites and two profile plots of the MAT. (a) Mount Gunnel: all
near-surface MAT from vertical rock faces have a development parallel to the mean annual air temperature (MAAT); indications of maximum and minimum surface offset are explained in text. (b) Example of the surface offset (SO) shown in the MAT profile of a west-facing cliff at Mount Gunnel; the temperature at 1.4 m height is the MAAT. (c) Pink Mountain; the MAT from convex (cx) and concave (cc) landforms show inverse development. Offsets strongly depend on the point in time of the comparison of instantaneous MATs. This example is a worst case in terms of data completeness. (d) MAT profile with spreads indicating the uncertainties of the surface and thermal offsets at Pink Mountain. The solid lines indicates an offset that is larger than the spread (TO), and the dashed line is used when offset is equal or smaller than the spread (SO).
face and thermal offsets, the differences between such an-nual means, are sensitive to errors in this mean calculation caused by data gaps. The surface offset has a pronounced inter-annual variability at locations with variable snow condi-tions. To minimise errors introduced by the data aggregation and to avoid misinterpretations of the resulting offsets due to temporal variations, we conduct the following process-ing steps: (1) calculate daily mean temperature; (2) calculate running mean annual temperature; and (3)compute MAT, SO and TO statistics.
The hourly data are aggregated to daily means. Gaps up to two missing values per day are interpolated; when more values are missing, no daily mean is calculated.
Then, running MAT are calculated for a 365-day window with 99 % of data available (Fig. 2a, c). Where sufficient data are present the offsets (SO, TO) for each point in time can be directly calculated and the minimum and maximum offset (e.g. SOmin, SOmax in Fig. 2a) are subtracted and the mea-surement error (±0.3◦C) is added to get a measure of the uncertainty of the SO. This SO uncertainty is expressed with the spread in Fig. 2b).
The example of Pink Mountain (Fig. 2c) illustrates possi-ble propossi-blems with the inter-comparability of annual means when time series are incomplete or when the running means
are asynchronous: MATs from different points in time cannot be easily compared and offsets between running MATs vary strongly for some locations. This is considered with the next step of the data processing, which is described in detail in the Supplement or in the discussion paper of this article (Hasler et al., 2014).
For the Hudson Bay Mountain field site, where the air tem-perature is measured at a weather station at 300 to 500 m lower elevation (Table 1), an air temperature lapse rate of
the last 2 decades). In Fig. 2d an example of a temperature profile shows the SO and TO at one location at Pink Moun-tain. In the further analysis, offsets are treated as significant (solid lines) when they are larger than the (inner) half of the uncertainties of both considered MATs. The uncertainty of the offset is indicated by the spreads in Fig. 2d. This cal-culation of mean annual temperatures and the conservative estimate of the uncertainties allows a comparison of incon-sistent data for a “quasi-static” surface offset/thermal-offset analysis.
3.3 Annual temperature amplitudes and seasonal N factors
The annual temperature amplitudes used in this article are the differences between mean July and mean January tem-peratures divided by 2. The N factors used in the discussion of the snow-cover influence are calculated on a seasonal and biweekly (15-day) basis by dividing the freezing or thawing index of the surface by the respective index of the air temper-ature (Ifsurf /Ifairor Itsurf /Itair). For seasonal indices and N factors, only days with complete data (Tairand GST present) are considered. The distinction between thawing and freez-ing season is made by the 15-day runnfreez-ing average air tem-perature (Tair≥0◦C is thawing season;Tair<◦C is freezing season). Whereas other studies (cf. Karunaratne and Burn, 2003) used the cumulative index from the start of the season, the biweekly integration shows the contribution of each time period to the seasonal N factor with similar weight. The 15-day averaging window is chosen for optimal visual represen-tation but a slightly shorter or longer window (3–30 days) has similar results. Because the relative errors of all these calcu-lations are much smaller than for the SO and TO calculation, we do not detail their uncertainties here.
4 Results and discussion
4.1 Overview of the mean annual temperatures and offsets
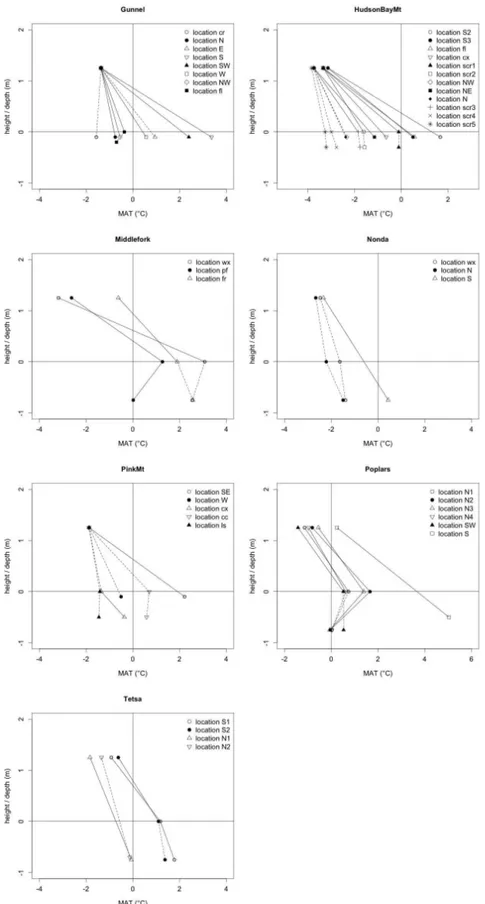
Figure 3 gives an overview of all MAT profiles and the sig-nificance of the surface and thermal offsets. For all loca-tions with snow accumulation (non-vertical), the SO has a temporal variability depending on the snow-cover evolution. Because the observation period covers years with different snow-cover build-up (cf. Sect. 2.1), these few years cover a large part of the variability in SO of the last 30 years. However, the particular situation for one location considering snow redistribution effects and data gaps does not allow us to precisely quantify the SO and its uncertainty. Therefore the estimation of the uncertainty is very conservative (Sect. 3.2) and SOs indicated as significant (solid lines in Fig. 3) are likely to prevail for most of the last 30 years. The TOs are often not significant due to their small offset or due to a pro-nounced variability because the lower ground is isothermal at
0◦C but not the ground surface (cf. Poplars in Fig. 3). These isothermal conditions are discussed in Sect. 4.2.
All sites show MAATs below 0◦C except south-facing slope at Poplars (POP_S), which has a particularly warm mi-croclimate (Fig. 3). In contrast, half of the locations show positive mean annual ground and ground-surface tempera-tures. Hence the SOs are generally positive and range from 0.5 to 7◦C. The TOs (thermal offsets or “temperature offsets in the near-surface” where the ground temperature is mea-sured above the permafrost table) are often not significant and range from−2 to+1◦C.
The SOs are important for permafrost distribution and dominate the effects of TOs in these climatic conditions and surface types (mountain permafrost). In the following, the results, and in particular the surface offsets, are presented and discussed regarding variations in surface characteristics, topography and macroclimate which may be related to the micro-, meso- and macroscale (Gruber, 2012). The variation in the parameters of interest (surface type, snow accumula-tion, slope, aspect, elevaaccumula-tion, macroclimate, etc.) is not suf-ficiently systematic and the sample is too small to quantify the difference in the offsets along all potential gradients with statistical methods. Accordingly, the approach we use is an exemplary comparison of the offsets at locations that differ mainly in the parameter of interest but are as similar as pos-sible in the other parameters.
4.2 Surface and thermal offsets classified by surface characteristics
First, we discuss the offsets of the mean annual temperatures regarding different surface characteristics. With surface char-acteristics we denote classes of near-surface ground proper-ties (surface type), micro-topography and vegetation cover regarding their thermal influence. A brief description of sur-face characteristics for all measurement locations is given in Table 1 in the columns “surface type” and “note”. These characteristics can vary over short distances and are respon-sible for a pronounced small-scale variability of ground tem-peratures (Gubler et al., 2011; Gisnås et al., 2014); however, their degree of influence may vary between sites with dif-ferent macroclimatic conditions. In this section we quantify the effect of different surface characteristics on the surface and thermal offset at our field sites. Even if the sample is too small and not systematic, as described above, we get a first estimate of the influence of surface characteristics on per-mafrost occurrence in British Columbia and compare these influences between sites.
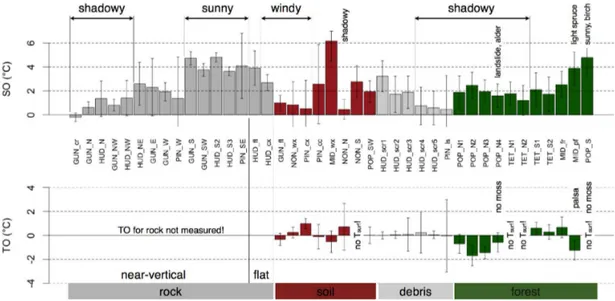
Figure 3. Overview of all thermal profiles measured at 44 locations within the seven field sites. The temperatures at 1.4 m height are the mean
Figure 4. Surface and thermal offsets grouped by different surface types (substrate and vegetation) and with indication of microtopographic
situation and forest type.
and Pink Mountain or herbaceous meadows at Middlefork (MID_wx). The class “debris” contains all surfaces with coarse debris cover that contain voids that may allow air circulation. Finally, “forest” comprises different forest types such as black spruce, pine and alder forests. These forests generally have mossy forest floors, overlying mineral soil horizons except as otherwise remarked (Fig. 4). In addition to the first order classes of surface type, we collected meta-data on the exposure to solar radiation and wind (Fig. 4; top). These factors are influenced by the (micro-) topography and affect the snow deposition (wind) and the radiation balance (mainly insolation) when snow free.
In general the SOs on flat locations with snow cover are in the range of 0.5 to 3◦C, which corresponds to similar set-tings in southern Norway (Farbrot et al., 2011; Isaksen et al., 2011). The average SO per class does not show a clear dependency on the surface type. For comparable irradiation and wind (snow redistribution) conditions the SOs on flat bare rock (2.5–4◦C) appear to be slightly higher than for the other surface types, which are in the range of 1.5 to 3◦C (Fig. 4). This difference may be caused by the low albedo of the rock additionally to a bias due to slightly different snow-cover influence. Interestingly, the SOs on coarse de-bris are not significantly smaller than for the other surface types. Within the first 30–50 cm of the block layer no sig-nificant offset (see TO) was observed. Obviously the ventila-tion (Haeberli, 1973; Harris and Pedersen, 1998) and reduced thermal conductivity (Gruber and Hoelzle, 2008) of the block layer have no large effect on the thermal regime of our field sites; however, a part of the TO may be missed due to the shallow measurement depth.
Within the class “near-vertical bedrock” a variation in the SOs of 4◦C (SO: 1–5◦C) indicates the influence of aspect-controlled irradiation on these snow-free surfaces, which is
discussed in more detail in the next section. Note that for this class no rock temperature at depth is measured and the near-surface temperature is used for the SO calculation (Fig. 4). In the classes “soil” and “debris”, which comprise more gentle slopes with snow accumulation, the aspect control is smaller. The north–south difference of the SOs is about 2◦C for the alpine tundra at Nonda (NON_S vs. NON_N) and 1.5 to 3◦C in the coarse debris at Hudson Bay Mountain (HUD_scr1–5 in Fig. 4). For coniferous forests with a dense canopy (spruce, pine), where the SOs are approximately 2◦C, there is no dif-ference between north and south slopes. However, the forest type, and correspondingly the canopy density, may be influ-enced by the aspect. This leads to significantly larger SOs where light forest and broadleaf trees allow higher incident solar radiation (e.g. POP_S in Fig. 4).
Wind-exposed locations with only a thin snow cover lead to a smaller SO than at sheltered locations at all field sites. Whereas the SO at the three wind exposed locations in the rock mountains is 1◦C or less, the wind-swept location at Hudson Bay Mountain has an SO of 2.7◦C (Fig. 4). This larger offset may be a result of more snow accumulation at wind-exposed locations of HUD due to more frequent warm snowfall in the Coast Mountains. Similar surface off-set (< 1◦C) at wind-swept locations has been reported from Norwegian mountain permafrost sites (Farbrot et al., 2011).
At the location with permafrost occurrence MID_pf, a clearly negative TO (−1.3◦C) is responsible for the permafrost oc-currence (Fig. 4). If this TO is caused by the seasonally vari-able thermal conductivity of the moss layer (thermal diode) or by a transient effect of the latent heat required to melt mas-sive ice within the degrading palsa is not clear based on these data alone. An additional cooling effect due to reduced snow depth on the palsa usually described in the literature could not be verified with our data because the smaller SO on the palsa compared to the weather station (MID_wx) is mainly caused by summer temperatures (perhaps shading from black spruce or different depths of probes). At the Poplars field site a clearly larger SO in contrast to the other locations is observed at the south slope location POP_S (Fig. 4). This large SO is caused by warmer ground temperatures in sum-mer. Hence, the higher transmissivity of the aspen forest al-lows more irradiative warming of the ground compared to the black spruce forest on the other locations. The three loca-tions with a thick (> 30 cm) moss layer in the northern slope of Poplars (POP_N1–3) show significant TOs between−0.8 and−1.7◦C. The ground temperatures of these locations are at 0◦C throughout the year, similar to the palsa at Middle-fork (MID_pf). Here as well, it is not clear whether these TOs reflect an equilibrium thermal offset effect of the organic soil layer or they indicate degrading permafrost with high ice content (cf. Isaksen et al., 2011).
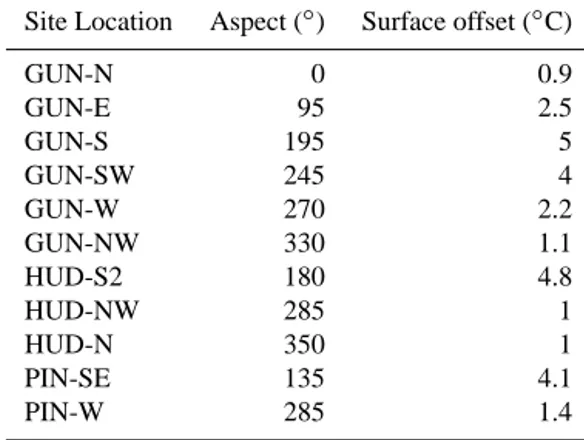
4.3 Aspect control of rock temperatures on the example of near-vertical cliffs
Near-vertical rock temperatures are a comparably good pa-rameter to investigate the aspect control of ground tempera-tures and to validate radiation algorithms in physically based permafrost models because no complex surface characteris-tics, thermal offsets or snow complicate the situation (Gruber et al., 2004). Gruber (2012) points out the importance of an extension of existing measurements to other environmental conditions for a better understanding of the drivers of these temperatures. In this section we describe the surface offsets in steep bedrock at the three high-elevation sites, GUN, PIN and HUD, and discuss them in comparison to near-vertical rock temperatures in other regions.
The mean annual rock temperatures from the near-surface (also referenced as MAGST in the following) at Mount Gun-nel illustrate the aspect control of ground surface tempera-tures by solar irradiation. At the shaded north side (GUN_N) MAGST is just 0.9◦C higher than MAAT, whereas this SO on the south side (GUN_S) is approximately 5◦C (Table 2). Subtracting these two north- and south-face SOs yields a dif-ference of 4.1◦C. A significant east–west difference does not exist (cf. GUN_E and GUN_W, Table 2). The N–S difference at Hudson Bay Mountain (HUD_S2 vs. HUD_N) is 3.8◦C. If not caused by differences in albedo or sky view factor, the slightly smaller N–S difference at HUD may be related to the higher cloudiness at Hudson Bay Mountain common in the
Table 2. Surface offsets for all monitored near-vertical cliffs.
Site Location Aspect (◦) Surface offset (◦C)
GUN-N 0 0.9
GUN-E 95 2.5
GUN-S 195 5
GUN-SW 245 4
GUN-W 270 2.2
GUN-NW 330 1.1
HUD-S2 180 4.8
HUD-NW 285 1
HUD-N 350 1
PIN-SE 135 4.1
PIN-W 285 1.4
more humid Coast Mountains. However, the difference is too small (not significant; cf. uncertainty in Fig. 4) to draw any conclusions on this macroclimatic effect. The effects were not detectible in other empirical studies (Gruber, 2012). For Pink Mountain we cannot calculate the north–south differ-ence because the corresponding aspects are not monitored. The SO values from the south-east and west cliffs (PIN-SE and PIN-W) correspond with similar aspects at Mount Gun-nel.
Compared with near-vertical rock temperatures in other mountain ranges, this influence of aspect falls between the values reported for mid-latitudes (Swiss Alps and New Zealand Southern Alps) and slightly higher latitudes (Nor-way). In the Swiss Alps N–S differences from 6 to 8◦C are reported (Gruber et al., 2004; PERMOS, 2010; Hasler et al., 2011) and in New Zealand this difference is about 6◦C (Allen et al., 2009), whereas in middle Norway differences of 3 to 3.5◦C were observed (Hipp et al., 2014). Strong (di-rectional) reflection in steep glacial environments amplifies the short-wave incoming radiation on southern rock faces (Allen et al., 2009; Hasler et al., 2011) and makes the high values not directly comparable to the situation in this study. A stronger decay of the expositional difference of potential incoming short-wave radiation occurs north of about 60◦N (Gruber, 2012) where expositional differences in the range of 0.5 to 1.5◦C are reported at 80◦N (Lewkowicz, 2001).
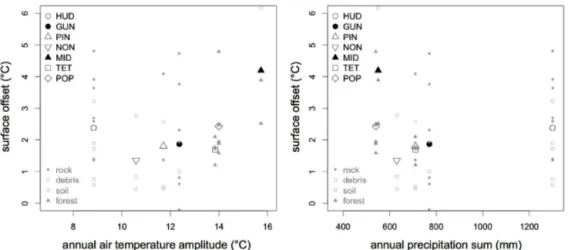
Com-Figure 5. Surface offsets (SO) against macroclimatic parameters. Large symbols are means per site and small symbols are individual locations
with symbol given by surface type. Left: SO against measured annual amplitude of air temperature (ATA=(Tjuly−Tjan)/2); right: SO against annual precipitation sum (precipitation estimate from Wang et al., 2012).
pact rock in E–S–W aspects and surfaces with snow accumu-lation (centre of plateaus, forest) are unlikely to contain per-mafrost. Hence, the rockfall that occurred at Mount Gunnel and the nearby Vanessa rockslide (Geertsema and Cruden, 2009) are possibly related to such local permafrost occur-rence.
4.4 The influence of continentality on snow-cover-induced surface offsets
Total annual precipitation, annual air temperature amplitude and average cloud cover are highly correlated on a large scale and distinguish humid maritime and dry continental climates (cf. Sect. 2). Continentality is usually defined as annual air temperature amplitude for a given latitude or simply half of the difference of January and July air temperature (cf. Sect. 3.3). With increasing continentality, less (winter) pre-cipitation and, on average, a thinner snow cover is expected. Even though snow can have diverse cooling and warming ef-fects, one of its major impacts is the thermal insulation of the ground from winter air temperature (Zhang, 2005). This affects the nival offset, that part of the SO which is caused by insulation of the snow cover and which is considered in N-factor models (e.g. Smith and Riseborough, 2002). How-ever, the correlation between mean snow-cover thickness and annual air temperature amplitude on the macroscale makes it difficult to predict how the SO depends on continentality. Ad-ditionally, the variability in snow-cover persistence further complicates the situation.
Because our measurements span large gradients in conti-nentality (cf. Sect. 2.1), they provide an opportunity to di-rectly evaluate the effect of continentality on SO (with field measurements of similar characteristics) and to estimate its role for the permafrost distribution in British Columbia. Gen-erally, the measured annual air temperature amplitude and the precipitation sum (Wang et al., 2012) correlate negatively
with each other; however, the high-elevation site in the inner Rocky Mountains (e.g. Nonda) shows a comparably low pre-cipitation sum but rather small annual air temperature ampli-tudes.
The aggregated data per field site show no clear difference between the Coast Mountains and the continental (east) side of the Rocky Mountains in terms of SOs (Fig. 5). Because the mean surface offsets per site are biased by the surface characteristics, the missing dependency on this aggregation level is not surprising. However, locations from the same sur-face class do not show a consistent dependency on either the annual air temperature amplitude or the annual precipitation (Fig. 5) because they are not present at all sites and topo-graphic effects (radiation and local snow redistribution) lead to strong variability within these classes (cf. Sect. 4.2).
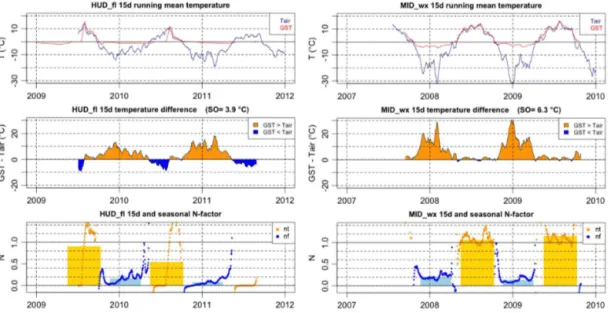
fac-Figure 6. Seasonal development of temperature differences and N factors at flat rock on Hudson Bay Mountain (left) and in a flat meadow at
Middlefork (right). Top: air and ground-surface temperature (15-day running mean); middle: temperature difference (GST–Tair)on 15-day running average; bottom: N factors on seasonal average (bars) and 15-day average (points). The SO is to partly controlled by the winter air temperature and is larger at MID_wx (orange area; middle). Negative differences in early summer (blue area; middle left) contribute to a smaller SO at HUD_fl. Freezing N factors (nf) are on a similar level (0.1–0.2), whereas thawing N factors (nt) differ due to the persistence of the snow during summer at HUD_fl.
tors at both sites correspond to the values observed for thick snow cover (> 0.8 m) in other studies (Smith and Risebor-ough, 2002; Juliussen and Humlum, 2007). The seasonal and biweekly freezing N factors (Fig. 6; bottomnf) are slightly smaller at MID_wx, indicating a less insulating snow cover. Despite this smaller insulation, the effect of the larger annual air temperature amplitude augments the nival offset. An addi-tional difference between the temperature regimes at the two locations is shown by the thawing N factors (Fig. 6; bottom
nt). At MID_wx, where the entire summer is snow free,ntis close to 1, whereas at HUD_fl the snow cover persists until August and leads to a strong reduction ofntlikely by albedo and latent heat effects (cf. Zhang, 2005). The resulting nega-tive summer offset at HUD (Fig. 6 middle; blue area) further reduces the SO. In this example the maritime humid climate leads to an SO of 3.9◦C due to a smaller temperature ampli-tude and a long-lasting snow cover while the drier continental climate results in a SO of 6.1◦C. A second example compar-ing two locations with thin snow cover is given in Fig. 7. These locations are a wind-exposed scree slope at Hudson Bay Mountain (HUD_scr2) and the wind-swept top of Mount Gunnel (GUN_fl). At both sites the GST generally follows the air temperature; hence, the SOs and temperature differ-ences are relatively small and have a less pronounced sea-sonal pattern (Fig. 7; middle) and freezing N factors closer to 1 than in the previous example (Fig. 7; bottom). A clear pos-itive offset is caused at HUD_scr2 in one winter (2010/2011) by a more developed snow cover. At this location GSTs be-low air temperature can be observed in early summer (blue
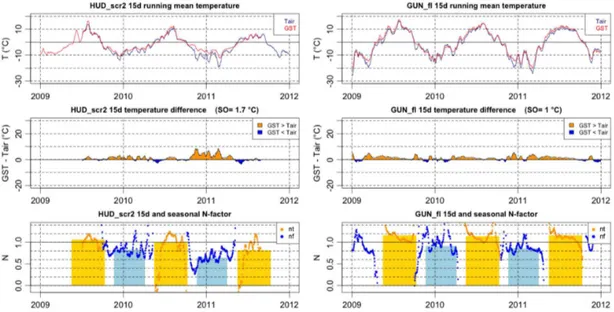
areas in Fig. 7; middle left). At GUN_fl a slightly positive temperature difference persists throughout the thawing sea-son (blue areas in Fig. 7; middle right). The related thaw-ing N factors (nt) are higher at the Gunnel location than at HUD_scr2 likely due to the effect of the short-wave radiation (cf. Juliussen and Humlum, 2007). Hence, the difference in annual temperature amplitude plays a minor role in this ex-ample and the slight difference in snow-cover thickness and duration affects both thawing and freezing N factors and re-sults in a just slightly higher SO at HUD_scr2 (Fig. 7). These two examples illustrate that several opposed effects tend to compensate each other on the macroclimatic scale. A com-plete set of figures showing the temperature differences and N factors is contained in the Supplement. The opposed ef-fects become small where the snow cover is eroded (but there SOs are small in general) and apparently increase for snow-rich local conditions (smallnf but also reducednt).
cli-Figure 7. Seasonal development of temperature differences and N factors in a windy scree slope at Hudson Bay Mountain (left) and on
a windy plateau at Mount Gunnel (right). Top: air and ground-surface temperature (15-day running mean); middle: temperature difference (GST–Tair)on 15-day running average; bottom: N factors on seasonal average (bars) and 15-day average (points). Note that the 2009 and 2011 seasonal thawing N factors (nt) at HUD_scr2 are slightly biased by the incomplete data. At both sites GST follows the air temperature. The snow cover is slightly more developed at HUD_scr2 and reduces both freezing and thawing N factors.
Figure 8. Qualitative sketch of the effect of snow cover and
con-tinentality on the surface offset (SO): the dashed red line indicates the dependency on a macroclimatic continentality gradient (annual air temperature amplitude) correlated with an increase in precipita-tion (and snow thickness; strong seasonality of precipitaprecipita-tion is ne-glected). The black line corresponds to the effect of local variations in snow accumulation (e.g. wind drift) with constant annual air tem-perature amplitude. While SO increases with snow-cover thickness for local variations until the effect of snow persistence reverses the trend, the continentality effect leads to a small variation of the SO for conditions with a seasonal snow cover.
mate than the SOs of the same snow cover but intermediate air temperature amplitude (Fig. 8).
This may be important for the application of empirical mountain permafrost models over large areas with
signifi-cant macroclimatic variations. A further consequence from the dependency shown in Fig. 8 is the strong sensitivity on snow-cover variations and temporal changes for continental climates due to the large annual air temperature amplitude.
5 Conclusions
This study comprises the analysis of an extensive data set of near-surface ground temperatures that is novel for the province of British Columbia. Despite the heterogeneous data characteristics, “quasi-static” values for the surface and thermal offsets could be achieved. The main focus of the pa-per is to analyse the surface and thermal offsets regarding the three groups of influencing factors: surface characteristics, topography and macroclimate. The respective key findings are listed separately as follows.
5.1 Surface characteristics
– In our measurements the average of the surface offsets per class of surface type (rock, fine soil, coarse debris, forest) is 2 to 2.5◦C with no clear difference between classes.
– Most wind-swept surfaces show a smaller surface offset (below 1◦C). In one case the offset is larger, possibly due to more frequent wet snowfall.
– Thermal offsets or offsets in the near-surface layer are negligible in our measurements, except at north-facing forest sites with a thick organic layer (moss) where they are−1 to−2◦C. It is not clear whether these latter ther-mal offsets represent equilibrium conditions because the temperature at the permafrost table is constantly at 0◦C and transient effects may be important under such conditions. This study only included one wetland (with peat) due to its focus in mountain permafrost.
5.2 Aspect control of insolation
– The north–south difference of the surface offset in near-vertical bedrock is 4◦C. No east–west difference was detected.
– On gentle slopes (angle < 30◦) on alpine tundra or debris the observed north–south difference is between 1.5 and 3◦C. In forests with a dense canopy this difference is negligible.
5.3 Macroclimate
– The aspect control of the surface offset in steep bedrock does not show significant differences between different macroclimatic regions.
– The comparison of two locations with a thick snow cover indicates that the effect of snow-cover insulation (nival offset) in the humid Coast Mountains and the much drier occidental side of the Rocky Mountains is similar for all locations. This is due to the reverse ef-fect of the continentality (annual air temperature ampli-tude), which compensates for the decreased insulation (smaller freezing N factor) with lower winter tempera-tures (larger freezing index) in the continental climate. – At the site in the Coast Mountains the long-lasting snow
cover further reduces the surface offset by albedo and latent heat effects during early summer.
Regarding future estimates of permafrost distribution in British Columbia, local variability of the surface offset caused by topographic and microtopographic effects is most important. This variability differs with vegetation and or-ganic soil layers (which also control the thermal offset) but seems to be influenced only to minor extent by the macrocli-matic variations.
The Supplement related to this article is available online at doi:10.5194/tc-9-1025-2015-supplement.
Author contributions. M. Geertsema, V. Foord, and S. Gruber
de-signed, deployed and maintained the field measurements of the present study. A. Hasler performed the data analysis. J. Noetzli con-tributed data processing routines as well as the numerical model in the discussion paper. A. Hasler prepared the manuscript with con-tributions and editing of all co-authors.
Acknowledgements. Thanks to two anonymous reviewers for
their useful comments that helped to improve the manuscript. Furthermore we would like to thank Hudson Stoffels for his active support in the field campaigns.
Edited by: A. Kääb
References
Allen, S. K., Gruber, S., and Owens, I. F.: Exploring steep bedrock permafrost and its relation- ship with recent slope failures in the Southern Alps of New Zealand, Permafrost Periglac., 20, 345– 356, 2009.
Boeckli, L., Brenning, A., Gruber, S., and Noetzli, J.: A statistical approach to modelling permafrost distribution in the European Alps or similar mountain ranges, The Cryosphere, 6, 125–140, doi:10.5194/tc-6-125-2012, 2012.
Bonnaventure, P. P., Lewkowicz, A. G., Kremer, M., and Sawada, M. C.: A permafrost probability model for the southern Yukon and northern British Columbia, Canada, Permafrost Periglac., 23, 52–68, 2012.
Egginton, V. N.: Historical climate variability from the instrumen-tal record in northern British Columbia and its influence on slope stability, Department of Earth Sciences – Simon Fraser Univer-sity, 2005.
Farbrot, H., Hipp, T. F., Etzelmüller, B., Isaksen, K., Ødegård, R. S., Schuler, T. V., und Humlum, O.: Air and ground temperature variations observed along elevation and continentality gradients in Southern Norway, Permafrost Periglac., 22, 343–360, 2011. Fiddes, J. and Gruber, S.: TopoSCALE v.1.0: downscaling gridded
climate data in complex terrain, Geosci. Model Dev., 7, 387–405, doi:10.5194/gmd-7-387-2014, 2014.
Geertsema, M. and Cruden, D. M.: Rock movements in northeastern British Columbia, in: Land- slide Processes: From Geomorpho-logic Mapping to Dynamic Modelling, Proceedings of the Land-slide Processes Conference: a tribute to Theo van Asch, edited by: Malet, J. P., Remaitre, A., and Bogaard, T., Strasbourg, 6–7 February, CERG, Strasbourg, France, 31–36, 2009.
Geertsema, M., Clague, J. J., Schwab, J. W., and Evans, S. G.: An overview of recent large catastrophic landslides in northern British Columbia, Canada, Eng. Geol., 83, 120–143, 2006. Gisnås, K., Westermann, S., Schuler, T. V., Litherland, T., Isaksen,
K., Boike, J., and Etzelmüller, B.: A statistical approach to rep-resent small-scale variability of permafrost temperatures due to snow cover, The Cryosphere, 8, 2063–2074, doi:10.5194/tc-8-2063-2014, 2014.
Gruber, S. and Hoelzle, M.: The cooling effect of coarse blocks re-visited: a Modeling Study of a Purely Conductive Mechanism, in: Proceedings of the Ninth International Conference on Per-mafrost, Fairbanks, Alaska, USA, 29 June–3 July 2008, 557– 561, 2008.
Gruber, S., Hoelzle, M., and Haeberli, W.: Rock-wall temperatures in the Alps: modelling their topographic distribution and regional differences, Permafrost Periglac., 15, 299–307, 2004.
Gubler, S., Fiddes, J., Keller, M., and Gruber, S.: Scale-dependent measurement and analysis of ground surface temper-ature variability in alpine terrain, The Cryosphere, 5, 431–443, doi:10.5194/tc-5-431-2011, 2011.
Guodong, C. and Dramis, F.: Distribution of mountain permafrost and climate, Permafrost Periglac., 3, 83–91, 1992.
Haeberli, W.: Die Basis-Temperatur der winterlichen Schneedecke als möglicher Indikator für die Verbreitung von Permafrost in den Alpen, Zeitschrift für Gletscherkunde and Glazialgeologie, 9, 221–227, 1973.
Harris, C., Arenson, L. U., Christiansen, H. H., Etzelmüller, B., Frauenfelder, R., Gruber, S., Haeberli, W., Hauck, C., Hölzle, M., and Humlum, O.: Permafrost and climate in Europe: Monitoring and modelling thermal, geomorphological and geotechnical re-sponses, Earth-Sci. Rev., 92, 117–171, 2009.
Harris, S. A.: Permafrost distribution, zonation and stability along the eastern ranges of the cordillera of North America, Arctic, 39, 29–38, 1986.
Harris, S. A.: Continentality Index: Its uses and limitations applied to permafrost in the Canadian Cordillera, Physi. Geogr., 10, 270– 284, 1989.
Harris, S. A.: Climatic change and permafrost stability in the eastern Canadian Cordillera, in: Extended Abstracts of the Ninth Inter-national Conference on Permafrost, Fairbanks, Alaska, USA, 29 June–3 July 2008, 93–94, 2008.
Harris, S. A. and Pedersen, D. E.: Thermal regimes beneath coarse blocky materials, Permafrost Periglac., 9, 107–120, 1998. Hasler, A., Gruber, S., and Haeberli, W.: Temperature variability
and offset in steep alpine rock and ice faces, The Cryosphere, 5, 977–988, doi:10.5194/tc-5-977-2011, 2011.
Hasler, A., Geertsema, M., Foord, V., Gruber, S., and Noetzli, J.: The influence of surface characteristics, topography, and con-tinentality on mountain permafrost in British Columbia, The Cryosphere Discuss., 8, 4779–4822, doi:10.5194/tcd-8-4779-2014, 2014.
Hipp, T., Etzelmüller, B., and Westermann, S.: Permafrost in alpine rock faces from Jotunheimen and Hurrungane, Southern Norway, Permafrost Periglac., 25, 1–13, 2014.
Isaksen, K., Ødegård, R. S., Etzelmüller, B., Hilbich, C., Hauck, C., Farbrot, H., Eiken, T., Hygen, H. O., und Hipp, T. F.: Degrading Mountain Permafrost in Southern Norway: Spatial and Tempo-ral Variability of Mean Ground Temperatures, 1999–2009, Per-mafrost Periglac., 22, 361–377, 2011.
Juliussen, H. and Humlum, O.: Towards a TTOP ground temper-ature model for mountainous terrain in central-eastern Norway, Permafrost Periglac., 18, 161–184, 2007.
Karunaratne, K. C. and Burn, C. R.: Freezing n factors in dis-continuous permafrost terrain, Takhini River, Yukon Territory, Canada, in: Proceedings of the 8th International Conference on Permafrost, Zurich, University of Zurich-Irchel. S., 519–524, 2003.
King, L.: Zonation and ecology of high mountain permafrost in Scandinavia, Geogr. Ann. A, 68, 131–139, 1986.
Lewkowicz, A. G.: Temperature regime of a small sandstone tor, latitude 80◦N, Ellesmere Is- land, Nunavut, Canada, Permafrost Periglac., 12, 351–366, 2001.
Lewkowicz, A. G. and Bonnaventure, P. P.: Equivalent elevation: a new method to incorporate variable surface lapse rates into mountain permafrost modelling, Permafrost Periglac., 22, 153– 162, 2011.
Meidinger, D. und Pojar, J.: Ecosystems of British Columbia, Spe-cial Report Series-Ministry of Forests, British Columbia, 6, 1991.
Nakamura, R. and Mahrt, L.: Air temperature measurement errors in naturally ventilated radiation shields, J. Atmos. Ocean. Tech., 22, 1046–1058, 2005.
PERMOS: Permafrost in Switzerland 2006/2007 and 2007/2008, Glaciological Report (Permafrost) No. 8/9, edited by: Noetzli, J. and Vonder Muehll, D., Cryospheric Commission of the Swiss Academy of Sciences, Zurich, Switzerland, 2010.
Riseborough, D., Shiklomanov, N., Etzelmuller, B., Gruber, S., and Marchenko, S.: Recent advances in permafrost modelling, Per-mafrost Periglac., 19, 137–156, 2008.
River Forecast Center: Water supply and snow survey bulletin – 1 January 2012, available at: http://bcrfc.env.gov.bc.ca/bulletins/ watersupply/archive/2012/2012_Jan1_SnowBulletin.pdf (last access: April 2015), 2012a.
River Forecast Center: Water supply and snow survey bulletin – 1 April 2012, available at: http://bcrfc.env.gov.bc.ca/bulletins/ watersupply/archive/2012/2012_Apr1_SnowBulletin.pdf (last access: April 2015), 2012b.
Schneider, S., Hoelzle, M., and Hauck, C.: Influence of surface and subsurface heterogeneity on observed borehole temperatures at a mountain permafrost site in the Upper Engadine, Swiss Alps, The Cryosphere, 6, 517–531, doi:10.5194/tc-6-517-2012, 2012. Smith, M. W. and Riseborough, D. W.: Climate and the limits of
per-mafrost: a zonal analysis, Permafrost Periglac., 13, 1–15, 2002. Throop, J., Lewkowicz, A. G., Smith, S. L., and Burn, C. R.:
Cli-mate and ground temperature relations at sites across the contin-uous and discontincontin-uous permafrost zones, northern Canada, Can. J. Earth Sci., 49, 865–876, 2012.
Wang, T., Hamann, A., Spittlehouse, D. L., and Murdock, T. Q.: ClimateWNA-High-resolution spatial climate data for western North America, J. Appl. Meteorol. Clim., 51, 16–29, 2012. Zhang, T.: Influence of the seasonal snow cover on the ground