www.biogeosciences.net/13/5333/2016/ doi:10.5194/bg-13-5333-2016
© Author(s) 2016. CC Attribution 3.0 License.
Anaerobic oxidation of methane alters sediment records of sulfur,
iron and phosphorus in the Black Sea
Matthias Egger1, Peter Kraal1, Tom Jilbert1,a, Fatimah Sulu-Gambari1, Célia J. Sapart2,3, Thomas Röckmann2, and Caroline P. Slomp1
1Department of Earth Sciences, Geochemistry, Faculty of Geosciences, Utrecht University, P.O. Box 80021,
3508 TA Utrecht, the Netherlands
2Institute for Marine and Atmospheric Research Utrecht (IMAU), Utrecht University, Princetonplein 5,
3584 CC Utrecht, the Netherlands
3Laboratoire de Glaciologie, Université Libre de Bruxelles, Brussels, Belgium
anow at: Department of Environmental Sciences, Faculty of Biological and Environmental Sciences,
University of Helsinki, P.O. Box 65 (Viikinkaari 2a), 00014 Helsinki, Finland
Correspondence to:Matthias Egger (m.j.egger@uu.nl)
Received: 22 February 2016 – Published in Biogeosciences Discuss.: 10 March 2016 Revised: 7 August 2016 – Accepted: 17 August 2016 – Published: 23 September 2016
Abstract. The surface sediments in the Black Sea are un-derlain by extensive deposits of iron (Fe)-oxide-rich lake sediments that were deposited prior to the inflow of ma-rine Mediterranean Sea waters ca. 9000 years ago. The subsequent downward diffusion of marine sulfate into the methane-bearing lake sediments has led to a multitude of diagenetic reactions in the sulfate-methane transition zone (SMTZ), including anaerobic oxidation of methane (AOM) with sulfate. While the sedimentary cycles of sulfur (S), methane and Fe in the SMTZ have been extensively stud-ied, relatively little is known about the diagenetic alterations of the sediment record occurring below the SMTZ.
Here we combine detailed geochemical analyses of the sediment and porewater with multicomponent diagenetic modeling to study the diagenetic alterations below the SMTZ at two sites in the western Black Sea. We focus on the dy-namics of Fe, S and phosphorus (P), and demonstrate that diagenesis has strongly overprinted the sedimentary burial records of these elements. In line with previous studies in the Black Sea, we show that sulfate-mediated AOM substan-tially enhances the downward diffusive flux of sulfide into the deep limnic deposits. During this downward sulfidization, Fe oxides, Fe carbonates and Fe phosphates (e.g., vivianite) are converted to sulfide phases, leading to an enrichment in solid-phase S and the release of phosphate to the porewater. Below the sulfidization front, high concentrations of dissolved
fer-rous Fe (Fe2+)lead to sequestration of downward-diffusing
phosphate as authigenic vivianite, resulting in a transient ac-cumulation of total P directly below the sulfidization front.
Our model results further demonstrate that downward-migrating sulfide becomes partly re-oxidized to sulfate due to reactions with oxidized Fe minerals, fueling a cryptic S cycle and thus stimulating slow rates of sulfate-driven AOM (∼1–100 pmol cm−3d−1)in the sulfate-depleted limnic de-posits. However, this process is unlikely to explain the ob-served release of dissolved Fe2+below the SMTZ. Instead, we suggest that besides organoclastic Fe oxide reduction and reactivation of less reactive Fe oxides by methanogens, AOM coupled to the reduction of Fe oxides may also provide a pos-sible mechanism for the high concentrations of Fe2+in the porewater at depth. Our results reveal that methane plays a key role in the diagenetic alterations of Fe, S and P records in Black Sea sediments. The downward sulfidization into the limnic deposits is enhanced through sulfate-driven AOM with sulfate, and AOM with Fe oxides may provide a deep source of dissolved Fe2+that drives the sequestration of P in
1 Introduction
Anaerobic oxidation of methane (AOM), a process initially regarded as a biogeochemical curiosity, functions as an important sink for oceanic methane (CH4) by consuming
> 90 % of all CH4 produced in marine sediments (Knittel
and Boetius, 2009; Reeburgh, 2007). Although recent stud-ies indicate that the biological oxidation of CH4 could be
coupled to various additional electron acceptors such as ni-trate and nitrite (Ettwig et al., 2010; Raghoebarsing et al., 2006) as well as metal oxides (Beal et al., 2009; Egger et al., 2015b; Riedinger et al., 2014; Scheller et al., 2016; Segarra et al., 2013; Sivan et al., 2011), sulfate (SO24−)is commonly thought to be the dominant electron acceptor in anoxic ma-rine systems (Knittel and Boetius, 2009; Reeburgh, 2007).
Nevertheless, a coupling between anaerobic CH4
oxida-tion and iron (Fe) oxide reducoxida-tion (Fe-AOM) could have a significant impact on sedimentary Fe cycling and related pro-cesses such as phosphorus (P) diagenesis, because of the 8:1 Fe–CH4stoichiometry of the reaction (Beal et al., 2009;
Eg-ger et al., 2015a; Rooze et al., 2016). Environmental condi-tions that favor Fe-AOM in marine systems are still poorly understood. The required co-occurrence of porewater CH4
and abundant reducible Fe oxides suggests that Fe-AOM may occur in sediments that receive a relatively high input of Fe oxides compared to the in situ production of sulfide, which could allow a portion of Fe oxides to escape the con-version to authigenic Fe sulfides and to remain preserved in the methanogenic sediments below the zone of SO24− reduc-tion (Egger et al., 2015b; Riedinger et al., 2014; Rooze et al., 2016). In addition, perturbations inducing transient diagen-esis such as anthropogenic eutrophication or climate change may also create diagenetic environments that are likely fa-vorable for Fe-AOM, as they provide a mechanism for the burial of Fe-oxide-rich deposits below sulfidic sediment lay-ers (Egger et al., 2015b; Riedinger et al., 2014).
The Black Sea represents a good example of a sedimentary system in which transient diagenesis associated with post-glacial sea-level rise has led to the accumulation of sulfidic sediments above Fe-oxide-rich deposits. Here, the establish-ment of a connection to the Mediterranean Sea through the shallow Bosporus around 9000 years ago (Degens and Ross, 1974; Soulet et al., 2011) led to the inflow of marine wa-ters into a freshwater basin, resulting in permanent salin-ity/density stratification and in the development of euxinic conditions (i.e., free dissolved sulfide present in the bottom water), making the current Black Sea the largest permanently anoxic basin on Earth.
In the absence of oxygen and metal oxides, SO24− re-duction is the dominant benthic mineralization process of organic matter in Black Sea surface sediments below the chemocline (∼100 m depth; Jørgensen et al., 2001; Tham-drup et al., 2000). At present, SO24− penetrates through the modern coccolith ooze (Unit I) and the marine sapropel (Unit II) sediments and a few meters into the Upper Pleistocene
freshwater deposits (Unit III; Arthur and Dean, 1998; De-gens and Ross, 1974; JørDe-gensen et al., 2004). Below the SO24−-bearing zone, methanogenesis takes over as the dom-inant process of organic matter degradation, resulting in the buildup of CH4in the porewater at depth.
Interactions between the cycles of sulfur (S) and CH4in
Black Sea sediments have been extensively studied during recent years (Holmkvist et al., 2011b; Jørgensen et al., 2001, 2004; Knab et al., 2009; Leloup et al., 2007) and AOM cou-pled to SO24− reduction (SO4-AOM) was found to account
for an estimated 7–18 % of total SO24− reduction in these sediments (Jørgensen et al., 2001). The production of sulfide in the sulfate-methane transition zone (SMTZ) as a result of SO4-AOM represents the main source of porewater sulfide
at depth in the sediment. This intensified production of sul-fide drives an enhanced downward diffusive flux of sulsul-fide into the deep limnic deposits of Unit III, forming a distinct diagenetic sulfidization front recognized as a black band or a series of bands owing to the conversion of Fe oxides to Fe sulfides (Berner, 1974; Jørgensen et al., 2004; Neretin et al., 2004).
At present, the impact of the downward-migrating sul-fidization front on sedimentary P, a key nutrient for marine phytoplankton, and the potential role of Fe-mediated AOM in the deep limnic deposits remain largely unknown. A buildup of ferrous Fe (Fe2+)in the porewater at depth, as found in
previous studies (Holmkvist et al., 2011b; Jørgensen et al., 2004; Knab et al., 2009), could indicate ongoing Fe reduction in the CH4-bearing deep limnic sediments and thus a
poten-tial coupling between AOM and Fe oxide reduction. The sed-iment records investigated up to now, however, do not extend deep enough to allow the sedimentary cycling of Fe and re-lated biogeochemical processes below the sulfidization front to be investigated. In particular, the presence of abundant dis-solved Fe2+combined with a potential release of porewater phosphate (HPO24−)during reductive dissolution of Fe ox-ides may be conducive to the formation of reduced Fe(II)–P minerals such as vivianite (Fe3(PO)4×8H2O) below the
sul-fidization front (Egger et al., 2015a; Hsu et al., 2014; März et al., 2008; Sivan et al., 2011). Post-depositional diagenetic alterations as a result of downward sulfidization could there-fore overprint burial records of P in the Upper Pleistocene deposits.
In this study, we combine detailed geochemical analyses of the sediment and porewater with multicomponent diage-netic modeling to study the diagediage-netic alterations below the lake–marine transition at two sites in the western Black Sea. Focusing on the dynamics of S, Fe and P, we demonstrate that AOM coupled to SO24− reduction enhances the downward sulfidization and associated dissolution of Fe oxides, Fe car-bonates and vivianite, supporting earlier findings of an SO4
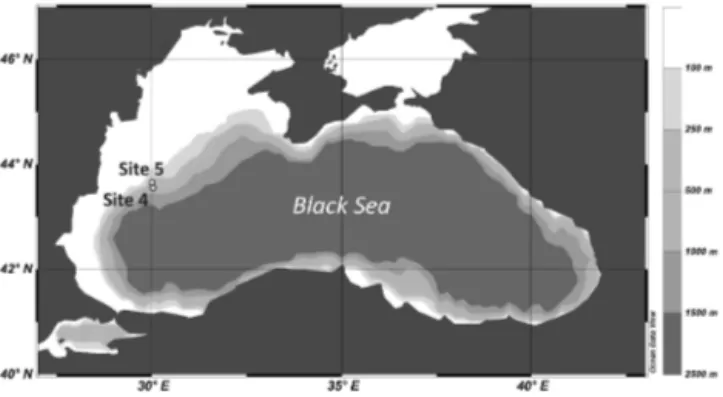
re-Figure 1. Map showing the locations of site 4 (43◦40.6′N, 30◦7.5′E; 377 m b.s.s.) and site 5 (43◦42.6′N, 30◦6.1′E; 178 m b.s.s.), sampled in June 2013.
action with the abundant dissolved Fe2+. We propose that organoclastic Fe oxide reduction, reactivation of less reactive Fe oxides by methanogens (Sivan et al., 2016) and/or AOM coupled to the reduction of Fe oxides are the key processes explaining the high concentrations of dissolved Fe2+at depth
in the sediment. Trends in total S and P with depth are signif-icantly altered by the above-mentioned reactions, highlight-ing that diagenesis may strongly overprint burial records of these elements below a lake–marine transition.
2 Materials and methods 2.1 Sample collection 2.1.1 Gravity core sampling
Sediment samples were taken at two slope sites in the west-ern Black Sea during a cruise in June 2013 with R/VPelagia. Gravity cores containing ∼7 m of sediment were collected at sites 4 (43◦40.6′N, 30◦7.5′E; 377 m below sea surface; m b.s.s.) and 5 (43◦42.6′N, 30◦6.1′E; 178 m b.s.s.; Fig. 1), both situated below the current chemocline (∼100 m water depth). The core liners were pre-drilled with 2 cm diameter holes in two rows of 10 cm resolution on opposing sides of the tube, offset by 5 cm and taped prior to coring. Upon re-covery, the liners were cut into 1 m sections, transferred to a temperature-controlled container set at in situ bottom water temperature (11◦C) and secured vertically. Subsequently, the
taped holes were cut open and a cut-off syringe was inserted horizontally directly after opening each hole.
From one series of holes, 10 mL of wet sediment was ex-tracted at 20 cm resolution and immediately transferred into a 65 mL glass bottle filled with saturated NaCl solution for CH4analysis. The NaCl solution was topped up after
addi-tion of the sample, ensuring that no air bubbles remained. Each bottle was sealed with a black rubber stopper and a screw cap and was subsequently stored upside down at room temperature. From the second series of holes, 20 mL
sedi-ment was extracted at 20 cm resolution, sealed with parafilm that was tightly closed with an elastic band, and directly in-serted into a nitrogen (N2)-purged glove box. Subsequently,
the sediment was transferred into a 50 mL centrifuge tube and centrifuged (4500 rpm; 30 min). The supernatant from each centrifuged sample was filtered through 0.45 µm pore size disposable filters via 20 mL plastic syringes in the glove box and collected in 15 mL centrifuge tubes. The sediment fraction was stored frozen (−20◦C) for solid-phase analy-sis. Filtered porewater samples were subsampled under N2
for analysis of dissolved HPO24−, ammonium (NH+4), dis-solved inorganic carbon (DIC), Fe, manganese (Mn), SO24− and sulfide (P
H2S=H2S+HS−; see Sect. 2.2). Additional
samples of 10 mL of sediment were collected at approxi-mately 50 cm resolution and transferred into pre-weighed 15 mL glass vials to determine porosity from gravimetric wa-ter loss.
2.1.2 Multicore sampling
To sample the surface sediment, sediment cores (30–60 cm of sediment and at least 10 cm of overlying water) were re-covered using an octopus multicorer (core diameter 10 cm). After recovery, the cores were stoppered at the base and at the top and immediately transported to a temperature-controlled container (11◦C). One multicore from each cast was
pre-drilled with 2 cm diameter holes in two rows at 10 cm res-olution on opposing sides of the tube, offset by 5 cm, and taped prior to coring. These holes were sampled for CH4as
described for the gravity cores. Another core was directly in-serted into a N2-purged glove box through an airtight hole in
the base. A bottom water sample was collected using a 20 mL plastic syringe and the remaining bottom water was removed with a Tygon tube. Subsequently, the core was sliced anox-ically with decreasing resolution at depth, i.e., 0.5 cm reso-lution for the first 0–2 cm, 1 cm resoreso-lution between 2–10 cm, 2 cm resolution between 10–20 cm and 4 cm resolution for the rest of the core (> 20 cm). For each slice a subsample was placed in a pre-weighed 15 mL glass vial for water content and solid-phase analysis and stored under N2in airtight jars
at−20◦C. A second subsample was transferred to a 50 mL
centrifuge tube and centrifuged (4500 rpm; 30 min). Both the supernatant water from each centrifuged sample and the bot-tom water sample were subsequently processed as described for the gravity cores.
Visual alignment of the porewater profiles from the mul-ticores with those of the gravity cores showed that the first
2.2 Porewater subsampling
A subsample of 0.5 mL was immediately transferred into a glass vial containing 1.5 mL of 8 M NaOH solution for anal-ysis of dissolved sulfide. Subsamples of total dissolved Fe and Mn, which are assumed to represent Fe(II) and Mn(II), were acidified with 10 µL 35 % Suprapur®HCl per mL of subsample. Note, however, that the dissolved (< 0.45 µm) Fe and Mn pools likely consist of a mixture of truly dis-solved (aqueous) Fe and Mn species, as well as organically complexed, colloidal and nanoparticulate Fe and Mn species (Raiswell and Canfield, 2012). Another 1 mL of porewater for HPO24−analysis was acidified with 4 µL 5 M HCl. Pore-water SO24−was analyzed with ion chromatography (IC) in a 10-fold diluted sample (0.15 mL of porewater with 1.35 mL of de-oxygenated UHQ water). Subsamples for DIC analy-sis (0.5 mL) were collected in glass vials (4.9 mL) to which 4.4 mL of 25 g L−1 NaCl solution was added, making sure that no headspace remained. Aliquots of the remaining pore-water were used for the measurement of alkalinity (deter-mined on board by titrating 1 mL of untreated subsample with 0.01 M HCl; results presented in the Supplement) and NH+4. All subsamples were stored at 4◦C and brought to
room temperature just before analysis. Subsampling for sul-fide was performed immediately after filtration, and all other subsampling was performed within 4 h of core recovery.
Porewater subsamples of HPO24−, DIC and sulfide were directly analyzed colorimetrically on board on two sepa-rate QuAAtro (SEAL Analytical, Germany) auto analyz-ers. HPO24− was measured at 880 nm after the formation of molybdophosphate complexes (Murphy and Riley, 1962). Samples for DIC were acidified online after being oxidized by H2O2and analyzed as described by Stoll et al. (2001). To
keep the dissolved sulfide in the nonvolatile HS− form un-der alkaline conditions, 1.5 mL of 8 mM NaOH was added to the sulfide samples, which were subsequently analyzed using the methylene blue method as described by Grasshoff (1969). Subsamples of dissolved Fe and Mn were analyzed onshore by ICP-OES (Perkin Elmer Optima 3000 Inductively Cou-pled Plasma – Optimal Emission Spectroscopy). For the analysis of porewater CH4, a volume of 10 mL N2 was
in-jected into the CH4 serum flasks (while a needle inserted
through the septum allowed 10 mL of water to escape) to create a headspace from which a subsample was collected with a gas-tight syringe. Subsequently, CH4 concentrations
were determined in the home laboratory after injection into a Thermo Finnigan TRACE™gas chromatograph (Flame Ion-ization Detector). δ13C–CH4 and δD–CH4 (D, deuterium)
were analyzed by Continuous Flow Isotope Ratio Mass Spec-trometry (CF-IRMS) as described in detail in Brass and Röckmann (2010) and Sapart et al. (2011).
2.3 Bulk sediment analysis
Sediment samples were freeze-dried, powdered and ground in an agate mortar in an argon (Ar)-filled glove box and split into oxic and anoxic fractions. Samples from the oxic fraction were used for total elemental and organic car-bon (Corg) analyses under normal atmospheric conditions,
whereas anoxic splits for sediment P and Fe speciation were kept under an inert, oxygen-free Ar or N2atmosphere at all
times to avoid oxidation artifacts (Kraal and Slomp, 2014; Kraal et al., 2009).
2.3.1 Total elemental composition and organic carbon A split of∼125 mg of freeze-dried sediment was dissolved overnight in 2.5 mL HF (40 %) and 2.5 mL of HClO4–HNO3
mixture, in a closed Teflon bomb at 90◦C. The acids were
then evaporated at 160◦C, and the resulting gel was
dis-solved overnight in 1 M HNO3at 90◦C. Total elemental
con-centrations in the 1 M HNO3solutions were determined by
ICP-OES. A second split of 0.3 g freeze-dried sediment was used to determine the Corg content using an elemental
an-alyzer (Fison Instruments model NA 1500 NCS) after car-bonate removal from the sediment with two washes with 1 M HCl (4 and 12 h) followed by two washes with UHQ wa-ter and subsequent drying of the samples (Van Santvoort et al., 2002).
2.3.2 Sediment P fractionation
To determine the solid-phase partitioning of P, aliquots of 0.1 g dried sediment were subjected to the SEDEX sequen-tial extraction procedure after Ruttenberg (1992), as modi-fied by Slomp et al. (1996b), but including the first MgCl2
step (Table 1). Sediment P was fractionated as follows: (i) ex-changeable P (“Pexch”, extracted by 1 M MgCl2, pH 8, 0.5 h),
(ii) Fe-associated P (“PFe”, extracted by citrate–bicarbonate–
dithionite (CDB), buffered to pH 7.5 with Na citrate/Na bi-carbonate, 8 h, followed by 1 M MgCl2, pH 8, 0.5 h), (iii)
au-thigenic Ca–P (“Pauthi Ca–P”, including carbonate
fluorap-atite, biogenic hydroxyapatite and CaCO3-bound P, extracted
by 1 M Na acetate solution, buffered to pH 4 with acetic acid, 6 h, followed by 1 M MgCl2, pH 8, 0.5 h), (iv) detrital
Ca–P (“Pdetr”, extracted by 1 M HCl, 24 h) and (v) organic P
(“Porg”, after ashing at 550◦C for 2 h, extracted by 1 M HCl,
24 h). The MgCl2washes in steps ii and iii were to ensure that
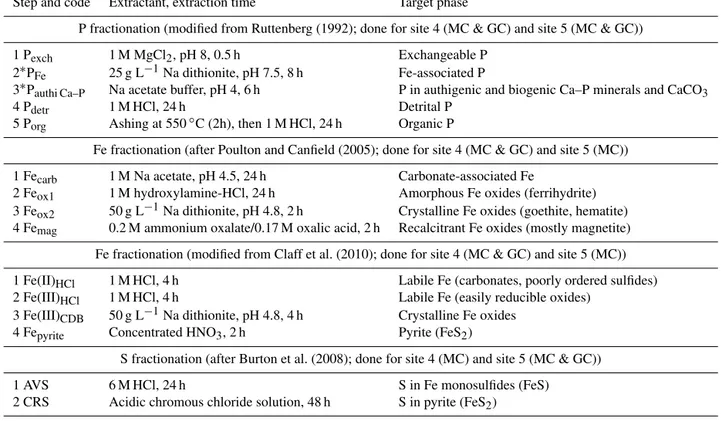
col-Table 1.Overview of the sequential P, Fe and S fractionation methods used in this study.
Step and code Extractant, extraction time Target phase
P fractionation (modified from Ruttenberg (1992); done for site 4 (MC & GC) and site 5 (MC & GC))
1 Pexch 1 M MgCl2, pH 8, 0.5 h Exchangeable P
2∗PFe 25 g L−1Na dithionite, pH 7.5, 8 h Fe-associated P
3∗Pauthi Ca–P Na acetate buffer, pH 4, 6 h P in authigenic and biogenic Ca–P minerals and CaCO3
4 Pdetr 1 M HCl, 24 h Detrital P
5 Porg Ashing at 550◦C (2h), then 1 M HCl, 24 h Organic P
Fe fractionation (after Poulton and Canfield (2005); done for site 4 (MC & GC) and site 5 (MC))
1 Fecarb 1 M Na acetate, pH 4.5, 24 h Carbonate-associated Fe
2 Feox1 1 M hydroxylamine-HCl, 24 h Amorphous Fe oxides (ferrihydrite)
3 Feox2 50 g L−1Na dithionite, pH 4.8, 2 h Crystalline Fe oxides (goethite, hematite)
4 Femag 0.2 M ammonium oxalate/0.17 M oxalic acid, 2 h Recalcitrant Fe oxides (mostly magnetite)
Fe fractionation (modified from Claff et al. (2010); done for site 4 (MC & GC) and site 5 (MC))
1 Fe(II)HCl 1 M HCl, 4 h Labile Fe (carbonates, poorly ordered sulfides)
2 Fe(III)HCl 1 M HCl, 4 h Labile Fe (easily reducible oxides)
3 Fe(III)CDB 50 g L−1Na dithionite, pH 4.8, 4 h Crystalline Fe oxides
4 Fepyrite Concentrated HNO3, 2 h Pyrite (FeS2)
S fractionation (after Burton et al. (2008); done for site 4 (MC) and site 5 (MC & GC))
1 AVS 6 M HCl, 24 h S in Fe monosulfides (FeS)
2 CRS Acidic chromous chloride solution, 48 h S in pyrite (FeS2)
∗These steps were followed by a wash step with 1 M MgCl
2, which was added to the corresponding step. MC is the multicore and GC is the gravity core.
orimetrically (Strickland and Parsons, 1972) on a Shimadzu spectrophotometer using the ammonium heptamolybdate – ascorbic acid method.
2.3.3 Sediment Fe fractionation
Sediment Fe was fractionated into (i) carbonate-associated Fe (“Fecarb”, including siderite and ankerite, extracted by 1 M
Na acetate brought to pH 4.5 with acetic acid, 24 h), (ii) eas-ily reducible (amorphous) oxides (“Feox1”, including
ferri-hydrite and lepidocrocite, extracted by 1 M hydroxylamine-HCl, 24 h), (iii) reducible (crystalline) oxides (“Feox2”,
in-cluding goethite, hematite and akagenéite, extracted by Na– dithionite buffer, pH 4.8, 2 h) and (iv) Fe in recalcitrant ox-ides (mostly magnetite, “Femag”, extracted by 0.2 M
ammo-nium oxalate/0.17 M oxalic acid solution, 2 h), according to Poulton and Canfield (2005), using a 50 mg aliquot of dried sediment (Table 1). An additional aliquot of 50 mg was sub-jected to an adapted sequential extraction procedure after Claff et al. (2010), separating labile Fe(II) (“Fe(II)HCl”) and
Fe(III) (“Fe(III)HCl”) using 1 M HCl (4 h) from crystalline Fe
oxide minerals (“Fe(II)CDB”, Na–dithionite buffer, pH 4.8,
4 h) and from pyrite (“Fepyrite”, concentrated nitric acid, 2 h),
for all multicores as well as for the long core at site 4 (Ta-ble 1).
At site 4 (multicore only) and 5 (multicore and grav-ity core), aliquots of 0.5 g dried sediment were used to
se-quentially determine the amount of FeS (acid volatile sulfur, “AVS”, using 6 M HCl) and FeS2(chromium reducible
sul-fur, “CRS”, using acidic chromous chloride solution) via the passive diffusion method described by Burton et al. (2008) using iodometric titration of the ZnS formed in the alkaline Zn acetate traps to quantify AVS and CRS (Table 1).
2.4 Diagenetic model
2.4.1 General form
A multicomponent transient diagenetic model was developed for site 4 based on existing diagenetic models (Reed et al., 2011a, b; Rooze et al., 2016) to gain a better understanding of the transient diagenesis in Black Sea sediments and to in-vestigate the potential for Fe-AOM as a source of porewater Fe2+at depth. The model describes the cycling of dissolved
Table 2.Chemical species included in the diagenetic model.
Species Notation Type
Organic mattera OMα,β,γ Solid
Iron oxidesa Fe(OH)α,β,γ3 Solid
Iron monosulfide FeS Solid
Pyrite FeS2 Solid
Siderite FeCO3 Solid
Elemental sulfur S0 Solid
Iron-oxide-bound phosphorus FeoxP Solid
Vivianite Fe3(PO4)2 Solid
Organic phosphorus Porg Solid
Authigenic (Ca) phosphorus Pauthi Ca-P Solid
Detrital phosphorus PDetr Solid
Chloride Cl− Solute
Oxygen O2 Solute
Sulfate SO24− Solute
Iron Fe2+ Solute
Hydrogen sulfideb P
H2S Solute
Methane CH4 Solute
Ammoniumb P
NH+4 Solute
Nitrate NO−3 Solute
Phosphate P
HPO24− Solute Dissolved inorganic carbon DIC Solute
aThere are three types of species: reactive (α), less reactive (β)and refractory (γ ).bP
denotes that all species of an acid are included.
species (Eq. 2) are, respectively, (1−φ)∂CS
∂t = −(1−φ)v ∂CS
∂x + X
RS (1)
φ∂Caq ∂t =φD
′∂ 2C
aq
∂x2 −φu
∂Caq
∂x + X
Raq, (2)
whereCSis the concentration of the solid species (mol L−1;
mass per unit volume of solids),Caqthe concentration of the
dissolved species (mol L−1; mass per unit volume of pore-water),tis time (yr),φthe sediment porosity,xthe distance from the sediment–water interface (cm),D′the diffusion co-efficients of dissolved species in the sediment (cm2yr−1) adjusted for the considered setting (Supplement Table S1; Boudreau, 1997) and corrected for the tortuosity in the porous medium (Boudreau, 1996; see Supplement). P
RS
and P
Raq are the net reaction rates of the solid and
dis-solved species from the chemical reactions they participate in (Table 3), andvanduthe advective velocities (cm yr−1)
of the solid and the dissolved species, respectively. Porosity and advective velocities were described by depth-dependent functions to account for sediment compaction (Meysman et al., 2005; Reed et al., 2011a; see Supplement Fig. S1).
Reactions considered by the model and corresponding re-action equations are given in Tables 3 and 4, respectively, and are divided into primary redox reactions and other bio-geochemical reactions, including various mineral formation and dissolution reactions (Reed et al., 2011a, b; Rooze et al.,
2016). Corresponding reaction parameters were mostly taken from the literature or, if these were not available or no fit to the data could be obtained with existing parameter ranges, constrained using the extensive geochemical dataset for site 4 (Table 5). A model sensitivity analysis for key parameters is provided in the Supplement (Figs. S2 and S3).
To account for differences in reactivity and crystallinity between different species, organic matter and Fe oxides are divided into three different pools, representing highly re-active (α), less reactive (β) and nonreactive (i.e., inert;γ ) phases. For the Fe oxides, only theαphase is used by organ-oclastic Fe reduction (Table 3), while theβphase is also used by Fe-AOM. This assumption was made to test whether the porewater and sediment profiles observed in the Black Sea can be reproduced with Fe-AOM as the main Fe reduction pathway at depth. In addition, it allows an assessment of the potential impact of Fe-AOM on sedimentary CH4 cycling.
Note that, as a consequence of the exclusion of organoclastic Fe reduction at depth, the model results should not be in-terpreted as proof for Fe-AOM but rather imply that it is a possible mechanism.
The succession of oxidants during organic matter decom-position (Froelich et al., 1979) is described by means of Monod kinetics (Table 4), whereby those oxidants with the highest metabolic free energy yield are used preferentially until they become limiting and the oxidant with the next highest energy yield is used (Berg et al., 2003; Boudreau, 1996; Reed et al., 2011b; Rooze et al., 2016; Wang and Van Cappellen, 1996). Oxidants considered by the model are (in descending order of energy yield) O2, nitrate (NO−3), Fe
ox-ides and SO24−. Once these oxidants are exhausted, organic matter remineralization occurs by methanogenesis. Corre-sponding limiting concentrations for the oxidants are taken from Reed et al. (2011a; Table 5). In addition, an attenua-tion factor,9, is used to slow down anaerobic organic mat-ter degradation through SO24−reduction and methanogenesis, thus allowing for better preservation of organic matter under anoxic bottom water conditions (Moodley et al., 2005; Reed et al., 2011a, b).
Cycling of S is simulated using five different chemical species, i.e., Fe monosulfides (FeS), pyrite (FeS2),
elemen-tal S (S0), dissolved sulfide and porewater SO24−(Table 2),
combined in a network of various biogeochemical reactions (Table 3). The CH4cycle includes CH4production from
or-ganic matter and from DIC (i.e., CO2), as well as CH4
ox-idation coupled to the reduction of O2, SO24− and Fe(OH)3
Table 3.Reaction pathways and stoichiometries implemented in the diagenetic model.
Primary redox reactions1
OMα,β+aO2→aCO2+bNH4++cH3PO4+aH2O R1
OMα,β+4a5NO−3 +4a5H+→aCO2+bNH+4 +cH3PO4+2a5N2+7a5H2O R2
OMα,β+4aFe(OH)α3+4aχαFeoxP+12aH+→aCO2+bNH+4 +(c+4aχα)H3PO4+4aFe2++13aH2O R3
OMα,β+a2SO42−+aH+→aCO2+bNH+4 +cH3PO4+2aH2S+aH2O R4
OMα,β→a2CO2+bNH+4+cH3PO4+a2CH4 R5
CO2+4H2→CH4+2H2O R6
Secondary redox and other reaction equations2
2O2+NH+4 +2HCO−3 →NO−3 +2CO2+3H2O R7
O2+4Fe2++8HCO−3 +2H2O+4χαH2PO−4 →4Fe(OH)α3+4χαFeoxP+8CO2 R8
2O2+FeS→SO24−+Fe2+ R9
7O2+2FeS2+2H2O→4SO42−+2Fe2++4H+ R10
2O2+H2S+2HCO−3 →SO 2−
4 +2CO2+2H2O R11
2O2+CH4→CO2+2H2O R12
2Fe(OH)α3+2χαFeoxP+H2S+4CO2→2Fe2++2χαH2PO−4 +S0+4HCO−3 +2H2O R13
2Fe(OH)β3+2χβFeoxP+H2S+4CO2→2Fe2++2χβH2PO−4 +S0+4HCO−3 +2H2O R14
Fe2++H2S→FeS+2H+ R15
FeS+H2S→FeS2+H2 R16
4S0+4H2O→3H2S+SO24−+2H+ R17
FeS+S0→FeS2 R18
SO24+CH4+CO2→2HCO−3 +H2S R19
CH4+8Fe(OH)α,β3 +8χα,βFeoxP+15H+→HCO−3 +8Fe2++8χα,βH2PO−4 +21H2O R20
Fe(OH)α3+
χα−χβ
FeoxP→Fe(OH)β3+
χα−χβ
H2PO−4 R21
Fe(OH)β3+
χβ−χγ
FeoxP→Fe(OH)γ3+
χβ−χγ
H2PO−4 R22
3Fe2++2HPO24−→Fe3(PO4)2+2H+ R23
Fe2++CO23−→FeCO3 R24
FeCO3+H2S→FeS+HCO−3 +H+ R25
Fe3(PO4)2+3H2S→3FeS+2HPO24−+4H
+ R26
1Organic matter (OM) is of the form (CH2O)a(NH+
4)b(H3PO4)c, with “a”=1, “b”=1/16 and “c”=1/106. Under anoxic bottom water conditions, “c” reduces to 0.25 to account for the preferential regeneration of P (e.g., Ingall et al., 1993).2χα,β,γrefers to the P : Fe ratio of Fe(OH)α,β,γ3 (see Table S1). R6 is the CH4production from DIC (i.e., CO2); R7 is the nitrification; R8 is the Fe(OH)3formation; R9 is the FeS oxidation; R10 is the FeS2oxidation; R11 is the H2S oxidation; R12 is the aerobic CH4oxidation; R13 and R14 are the Fe(OH)3reduction by H2S; R15 is the FeS formation; R16 is the pyrite formation (H2S pathway); R17 is the S0disproportionation; R18 is the pyrite formation (polysulfide pathway); R19 is the SO4-AOM; R20 is the Fe-AOM; R21 is the conversion (i.e., crystallization) fromαtoβphase; R22 is the crystallization fromβtoγphase; R23 is the vivianite formation; R24 is the siderite precipitation; R25 is the conversion from siderite to FeS; R26 is the vivianite dissolution by dissolved sulfide.
the relatively low Mn concentrations (∼15 µmol g−1for total sedimentary Mn and < 30 µM for dissolved Mn2+; Figs. S2 and S3) when compared to Fe and the likely presence of most of the Mn in the form of Mn carbonates.
The P forms included in the model are porewater HPO24−, authigenic Ca–P, organic P and detrital P, as well as Fe-bound P, i.e., P associated with Fe oxides and P in vivianite (Ta-ble 2). The removal of dissolved Fe2+through formation of
the Fe minerals FeS, siderite (FeCO3)and vivianite is also
included in the model (Table 3). Mass balances for all chem-ical species included in the model are given in Table S2.
The boundary conditions at the sediment surface were specified as time-dependent depositional fluxes for the par-ticulate components and as fixed bottom water
Table 4.Reaction equations implemented in the model.
Primary redox reaction equations
R1=kα,βOMα,β
[O
2]
KO2+[O2]
(E1)
R2=kα,βOMα,β
NO−3 K
NO−3+
NO−3
!
KO2
KO2+[O2]
(E2)
R3=kα,βOMα,β
Fe(OH)α3 KFe(OH)α
3+
Fe(OH)α3
! K
NO−3
K
NO−3+
NO−3
!
KO2
KO2+[O2]
(E3)
R4=9kα,βOMα,β
h SO24−i K
SO2− 4
+hSO24−i KFe(OH)α 3 KFe(OH)α 3+ Fe(OH)α
3
! K
NO−3
KNO−
3
+ NO−3
!
K
O2
KO2+[O2]
(E4)
R5=9kα,βOMα,β
K SO2− 4 K
SO24−+
h SO24−i
KFe(OH)α 3 KFe(OH)α 3+ Fe(OH)α3
!
KNO−
3
K
NO−3+
NO−3
!
K
O2
KO2+[O2]
(E5)
R6=k1DIC
K
SO24−
K
SO2− 4
+hSO24−i KFe(OH)α 3 KFe(OH)α 3+ Fe(OH)α3
! K
NO−3
K
NO−3+
NO−3
!
KO2
KO2+[O2]
(E6)
Secondary redox and other reaction equations
R7=k2[O2]NH+4] (E7)
R8=k3[O2]Fe2+] (E8)
R9=k4
O2
[FeS] (E9)
R10=k5[O2][FeS2] (E10)
R11=k6
O2 [P
H2S] (E11)
R12=k7O2[CH4] (E12)
R13=k8[Fe(OH)α3][PH2S] (E13)
R14=k9[Fe(OH)β3][PH2S] (E14)
R15=k10[Fe2+][PH2S] (E15)
R16=k11[FeS][PH2S] (E16)
R17=k12[S0] (E17)
R18=k13[FeS][S0] (E18)
R19=k14[SO24−][CH4] (E19)
R20=k15[Fe(OH)α,β3 ][CH4] (E20)
R21=k16[Fe(OH)α3] (E21)
R22=k17[Fe(OH)β3] (E22)
R23=k18 h
Fe2+i[HPO24−] (E23)
R24=k19 h
Fe2+i[DIC] (E24)
R25=k20FeCO3[PH2S] (E25)
R26=k21Fe3(PO4)2[PH2S] (E26)
(Soetaert and Meysman, 2012) to calculate the transport in porous media. The set of ordinary differential equations was subsequently solved numerically with the lsoda integrator al-gorithm (Hindmarsh, 1983; Petzoldt, 1983).
2.4.2 Transient scenario
The model applied in this study simulates the sediment deposition during the last 25000 years. A constant mass accumulation rate of 0.06 g cm−2yr−1 over the Holocene was assumed. In order to reduce the computing time for the freshwater period, a higher mass accumulation rate of
1 g cm−2yr−1was used between 25 000 and 10 000 years
be-fore present (B.P.) and all fluxes were corrected accordingly (i.e., multiplied by a factor of 16.67). Inflow of Mediter-ranean saltwater into the Black Sea basin was modeled as-suming an initial salinity of 1 for the freshwater lake and a linear increase to a salinity of 22 between 8500 and 1500 years B.P. (Fig. 2). Such a salinization scenario results in a good fit to the chloride (Cl−)profile (Fig. 3) and com-pares well with a previous salinity reconstruction, suggesting a linear increase in salinity of 1 to 22 between 9000±500 years B.P. and 2000±500 years B.P. (Soulet et al., 2010). Bottom water salinity was converted to Cl− and SO2−
us-Table 5.Reaction parameters used in the diagenetic model.
Parameter Symbol Value Units Values given in literature
Decay constant for OMα kα 0.05 yr−1 0.05–1.62a,b
Decay constant for OMβ kβ 0.0086 yr−1 0.0086b
Limiting concentration of O2 KO2 0.02 mM 0.001–0.03c
Limiting concentration of NO−3 KNO3- 0.004 mM 0.004–0.08
c
Limiting concentration of Fe(OH)3 KFe(OH)3 65 µmol g
−1 65–100c
Limiting concentration of SO24− KSO2−
4
1.6 mM 1.6c
Attenuation factor for SO24−and methanogenesis 9 0.0042 – 0.00157–0.075b,d
Rate constant for reaction E6 k1 0.0011 yr−1
Rate constant for reaction E7 k2 10 000 mM−1yr−1 5000–39 000c,d
Rate constant for reaction E8 k3 140 000 mM−1yr−1 140 000c
Rate constant for reaction E9 k4 300 mM−1yr−1 300c
Rate constant for reaction E10 k5 1 mM−1yr−1 1c
Rate constant for reaction E11 k6 160 mM−1yr−1 ≥160c
Rate constant for reaction E12 k7 10 000 000 mM−1yr−1 10 000 000c
Rate constant for reaction E13 k8 9.5 mM−1yr−1 ≤100c
Rate constant for reaction E14 k9 0.95 mM−1yr−1 Model constrained
Rate constant for reaction E15 k10 150 mM−1yr−1 100–14 800b, d
Rate constant for reaction E16 k11 0.0003 mM−1yr−1 3.15e
Rate constant for reaction E17 k12 3 yr−1 3f
Rate constant for reaction E18 k13 1 mM−1yr−1 7f
Rate constant for reaction E19 k14 0.14 mM−1yr−1 10c
Rate constant for reaction E20 k15 0.00000016 mM−1yr−1 0.0074g
Rate constant for reaction E21 k16 0.6 yr−1 0.6f
Rate constant for reaction E22 k17 0.000013 yr−1 Model constrained
Rate constant for reaction E23 k18 0.052 mM−1yr−1 Model constrained
Rate constant for reaction E24 k19 0.0027 mM−1yr−1 Model constrained
Rate constant for reaction E25 k20 0.0008 mM−1yr−1 Model constrained
Rate constant for reaction E26 k21 0.0008 mM−1yr−1 Model constrained
aMoodley et al. (2005).bReed et al. (2011a).cWang and Van Cappellen (1996).dReed et al. (2011b).eRickard and Luther (1997).fBerg et al. (2003). gRooze et al. (2016).
ing the molecular weights and seawater density derived from the marelac geochemical dataset package (Soetaert et al., 2010; Table S1). A shift from oxic towards euxinic condi-tions around 7600 years B.P., with a peak in organic matter loading around 5300 years B.P. and constant elevated organic matter fluxes after 2700 years B.P. was assumed, following a recent study comprising data from seven sediment cores collected from the Black Sea (Eckert et al., 2013; Fig. 2). In addition, the input of organic matter was assumed to increase again in the last century, reflecting anthropogenic eutrophica-tion of waters on the adjacent continental shelf as previously reported (Capet et al., 2013; Kemp et al., 2009). With the development of anoxic and sulfidic bottom water conditions, depositional fluxes of reactive Fe oxides were assumed to be zero (Fig. 2). In contrast, fluxes of Fe sulfides are high under euxinic conditions and dominated by FeS2.
3 Results
3.1 Porewater profiles
Porewater profiles of SO24− show a linear decrease from
∼17 mM at the sediment–water interface to a depth of
∼230 cm at both sites, below which CH4 starts to
accu-mulate in the porewater (Fig. 3). Bubble formation and de-gassing of CH4during gravity coring could not be avoided
because of the high concentrations of CH4in the limnic
de-posits above the saturation of ca 1.3 mM CH4at atmospheric
pressure (calculated for a salinity of 22 and a temperature of 25◦C using the algorithm from Mogollón et al., 2013).
Observations of increased outgassing with depth during cor-ing suggest that the low CH4 concentrations in the deeper
sediments at both sites are due to enhanced outgassing with increasing levels of CH4. Porewater profiles of NH+4 at both
sites are similar, and concentrations increase to∼3 mM at depth, suggesting that actual CH4concentrations at both sites
in-Figure 2.Transient evolution of salinity with a linear increase from 1 to 22 between 8500 and 1500 years B.P. (a), fluxes of organic matter (JCorg);(b)Fe oxides (JFe(OH)3);(c)and Fe sulfides (JFeSx); (d)as implemented in the diagenetic model (site 4).
dicate the presence or absence of CH4, and are not a
quanti-tative measure (indicated as open diamonds in Fig. 4). Note that the upper ∼300 cm of sediment at site 5 is likely less affected by CH4 outgassing. Modeled porewater
concentra-tions of CH4, on the other hand, show a steep increase below
the SMTZ, comparable to the gradient observed at site 5, and build up to concentrations of∼15 mM at depth (Fig. S5).
The SMTZ is located around 230 cm depth in the sedi-ment and is characterized by the removal of both porewater SO24−and dissolved CH4. In this zone, SO4-AOM drives the
production of dissolved sulfide, DIC and alkalinity (Fig. S5) and diffusion of these porewater constituents away from the SMTZ (Fig. 3). Below the sulfide diffusion front, Fe2+ accu-mulates in the porewater. Dissolved HPO24−reaches a max-imum around the depth where sulfide levels drop below the detection limit of 1 µmol L−1, followed by a steep decrease with depth. Concentrations of porewater Mn2+ are more than an order of magnitude lower than those of dissolved Fe2+, and decrease from the sediment surface until∼200 cm depth, below which they slightly increase again (Fig. S5).
The smooth porewater profiles of δ13C–CH4 and δD–
CH4suggest that the isotopic composition of porewater CH4
(available for site 5 only) is less affected by the CH4 loss
and reveals a biological origin in the limnic deposits, with hydrogenotrophic carbonate reduction, i.e., microbial reduc-tion of CO2 to CH4 as the main methanogenic pathway
for the range of CH4 isotope ratios observed in these
sedi-ments (Fig. 4; Whiticar, 1999). Upward-diffusing CH4shows
a gradual depletion in δ13C–CH4 from ∼ −74 at depth to ∼ −96 ‰ around the SMTZ, followed by subsequent pro-gressive 13C enrichment towards the sediment surface.δD– CH4 shows a small enrichment from −226 at depth to ∼ −208 ‰ at the SMTZ and a strong shift towards highδD– CH4values of up to∼113 ‰.
3.2 Solid-phase profiles
A pronounced excursion in sedimentary Corg at site 4 in
combination with a shift from gray clay deposits to micro-laminated black sediments indicates that the lake–marine transition, i.e., the transition between the marine sapropel Unit II and the deep limnic sediments of Unit III (Arthur and Dean, 1998; Degens and Ross, 1974), is located around a sediment depth of∼90 cm at site 4 (Fig. 5). At site 5, Unit I and Unit II were lost due to a turbidite, explaining the low concentrations of Corgin the upper sediments.
Concentrations of solid S increase with decreasing depth from 20 µmol g−1 below 300 cm (sulfidization front) to
∼400 µmol g−1 in the upper 100 cm at both sites and are dominated by FeS2 (Fig. 5). Iron oxides show a decrease
from∼100 µmol g−1 at depth to∼50 µmol g−1in the
sed-iments between 100 and 300 cm and a further decrease to
∼10 µmol g−1closer to the sediment surface. Amorphous Fe
oxides (Feox1)and more crystalline oxides (Feox2)both
ac-count for half the total amount of Fe oxides, with a small con-tribution of recalcitrant oxides (Femag; Fig. S4). The results
from the two different Fe extractions applied in this study (Table 1) generally compare well (Fig. S4). Note, however, that the Fe oxides in Fig. 5 represent the results from the ex-traction after Poulton and Canfield (2005). Results from the Fe extractions modified from Claff et al. (2010) are provided in the Supplement. Sedimentary Mn content is relatively low at all three sites, ranging from∼5 to 10 µmol g−1in the ma-rine sediments to∼15 µmol g−1in the deep limnic deposits of Unit III (Fig. S4).
Sediments below the sulfidization front are characterized by high Fe carbonate contents of∼100 µmol g−1. The sharp
depletion in Fe carbonate around the sulfidization front could only be reproduced in the model by assuming Fe carbonate dissolution by dissolved sulfide (Table 3). These results sug-gest a conversion of reactive Fe from carbonate toward sul-fide phases in the presence of abundant dissolved sulsul-fide.
Units I and II show high concentrations of organic P, which accounts for∼30 % of total P in these sediments (Fig. 5). Low organic P and high concentrations of detrital P in the upper sediments at site 5 are due to the turbidite. The limnic deposits of Unit III are generally depleted in organic P (< 6 % of total P) and enriched in detrital P. Authigenic Ca–P shows little variation in the sediments of Unit III, accounting for
∼20 to 30 % of total P at the two sites. The contribution of Fe-associated P, on the other hand, is reduced in the limnic deposits of Unit III exposed to the downward-diffusing sul-fide (∼20 %) when compared to the sediments below the sulfidization front (∼30 %). Concentrations of exchange-able P are < 2 µmol g−1for sediments above the SMTZ and
< 1 µmol g−1for sediments at depth (data not shown).
Figure 3.Porewater profiles of key components for site 4 (black diamonds) and site 5 (gray diamonds) and corresponding modeled profiles as calculated with the diagenetic model (black lines). Red dotted lines and roman numbers indicate the transitions between the lithological Unit I (modern coccolith ooze), Unit II (marine sapropel) and Unit III (limnic deposits). The orange bar represents the sulfate-methane transition zone (SMTZ), and the orange dashed line shows the current position of the downward-migrating sulfidization front (S front). The dashed vertical line indicates the CH4saturation concentration at atmospheric pressure (Mogollón et al., 2013). The open diamonds indicate CH4
concentrations that are likely underestimated due to outgassing of CH4during coring.
Figure 4.Porewater profiles of CH4for site 4 (black diamonds) and 5 (gray diamonds) and corresponding isotopic composition of dissolved
CH4(available for site 5 only).δ13C–CH4values are given in ‰ vs. VPDB (Vienna Pee Dee Belemnite), andδD–CH4values are given in ‰ vs. V-SMOW (Vienna Standard Mean Ocean Water). Red dotted lines and roman numbers indicate the transitions between the lithological Unit I (modern coccolith ooze), Unit II (marine sapropel) and Unit III (limnic deposits). The orange bar represents the sulfate-methane transition zone (SMTZ), and the orange dashed line shows the current position of the downward-migrating sulfidization front (S front). The dashed vertical line indicates the CH4saturation concentration at atmospheric pressure (Mogollón et al., 2013). The open diamonds indicate
Figure 5.Solid-phase sediment profiles for site 4 (black diamonds) and 5 (gray diamonds). Fe oxides represent the sum of amorphous, crystalline and recalcitrant oxides, i.e., Feox1, Feox2and Femag(Table 1, Fig. S4). Fecarbwas corrected for apparent AVS dissolution during
the Na acetate extraction step (the uncorrected Fecarbdata are given in Fig. S4). Black lines represent profiles derived from the diagenetic model. Red dotted lines and roman numbers indicate the transitions between the lithological Unit I (modern coccolith ooze), Unit II (marine sapropel) and Unit III (limnic deposits). The orange bar represents the sulfate-methane transition zone (SMTZ), and the orange dashed line shows the current position of the downward-migrating sulfidization front (S front).
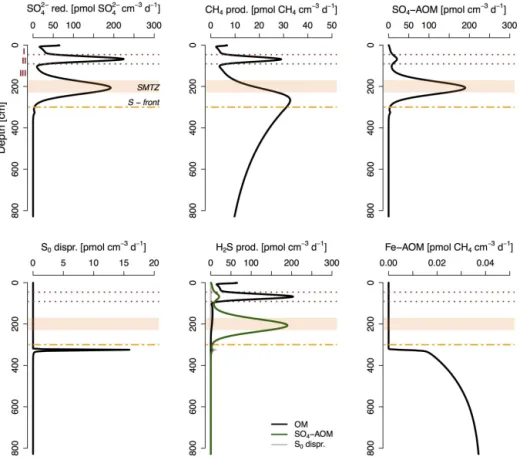
in the organic-rich marine deposits of Unit II and in the limnic deposits below the SMTZ. The sediments around the SMTZ are further characterized by high rates of SO4-AOM
(∼200 pmol cm−3d−1), whereas sediments directly below
the sulfidization front show enhanced rates of S0
dispropor-tionation (∼15 pmol cm−3d−1). Organoclastic SO2− 4
reduc-tion provides the main source for porewater sulfide in the organic-rich marine deposits, while SO4-AOM and S0
dis-proportionation are the dominant sources of dissolved sul-fide in sediments around the SMTZ and directly below the sulfidization front, respectively. Rates of Fe-AOM are gen-erally low (< 0.04 pmol CH4cm−3d−1)and restricted to the
limnic deposits only.
3.3 Temporal evolution
The temporal evolution in porewater and solid-phase con-stituents illustrates the impact of the lake–marine transition on the sediment geochemistry (Fig. 7). Concentrations of porewater Cl−and SO24−increase with the intrusion of ma-rine Mediterranean Sea waters, accompanied by a decrease in dissolved CH4 and accumulation of porewater sulfide in
the shallower sediments. Dissolved Fe2+becomes restricted to nonsulfidic porewaters at depth, while HPO24−and solid S
start to accumulate in the presence of dissolved sulfide. Iron oxides decrease in the surface sediments as well as in the sediments at depth. Vivianite, on the other hand, becomes increasingly enriched in sediments below the downward-diffusing sulfide front.
4 Discussion
4.1 Coupled S, CH4and Fe dynamics
4.1.1 Organoclastic SO2−4 reduction
Model-derived areal rates of total SO24− reduction of
reduc-Figure 6.Modeled rates of total SO24−reduction, total CH4production, SO4-AOM, S0disproportionation, sulfide production and Fe-AOM.
Red dotted lines and roman numbers indicate the transitions between the lithological Unit I (modern coccolith ooze), Unit II (marine sapropel) and Unit III (limnic deposits). The orange bar represents the sulfate-methane transition zone (SMTZ), and the orange dashed line shows the current position of the downward-migrating sulfidization front (S front).
Table 6.Depth-integrated rates of key processes for selected depth intervals in µmol m−2d−1.
Process 0–90 cma 90–300 cmb 300–800 cmc 0–800 cm
Organoclastic SO24−reductiond 68.9 5.3 0.003 74.2
CH4productione,f 10.21 37.7 91.8 139.8
SO4– AOM 9.4 151.6 1.2 162.2
Fe–AOMe 0 0 1.2 1.2
S0disproportionation 0 0 0.9 0.9
aMarine deposits.bLimnic sediments around the SMTZ with dissolved sulfide.cNonsulfidic limnic deposits.dPer mol of SO24−.ePer mol of CH4.fSum of CH4production from organic matter and from DIC (i.e., CO2).
tion represents the dominant mineralization process of or-ganic matter in sediments below the chemocline (Jørgensen et al., 2001; Thamdrup et al., 2000). The remaining < 25 % of organic matter remineralization is due to methanogenesis. The relative contribution of SO42-reduction to organic mat-ter remineralization, however, is likely significantly higher when taking into account the high SRR in the uppermost sed-iment layers (Jørgensen et al., 2001), which are not captured by our model.
The depth-dependent rate profile of SO24−reduction shows two distinct peaks of∼70 and 230 pmol SO24−cm−3d−1
as-sociated with organoclastic SO24− reduction in the organic-matter-rich marine deposits of Unit I and Unit II. These rates are at the low end of reported values from Black Sea sedi-ments (0.1–20 nmol cm−3d−1; Holmkvist et al., 2011b; Jør-gensen et al., 2001, 2004; Knab et al., 2009; Leloup et al., 2007). Our model further demonstrates that the two SRR peaks in the sediments of Unit I and Unit II are not reflected in the porewater profile of SO24−. This finding is in line with earlier work, showing that the SO24− gradient in Black Sea sediments is primarily affected by SO4-AOM in the SMTZ
Figure 7.Transient evolution of selected porewater and sediment profiles with depth as calculated for site 4 using the diagenetic model.
diffusion time to∼200 cm is about 5 times longer than to
∼90 cm, i.e.,∼300 years vs.∼60 years) and higher poros-ity in Unit I and II (Fig. S1) both dampen the effect of SO24− reduction in the marine deposits on the SO24−profile (see also Jørgensen et al., 2001). Thus, our results support previous conclusions that SRR estimates based on porewater profiles of SO24−(i.e., net SO24−consumption) alone may underesti-mate the actual SO24−turnover (i.e., gross SO24−reduction) in marine sediments (Jørgensen, 1978; Jørgensen et al., 2001). 4.1.2 SO4-AOM
Porewater profiles of SO24−, CH4, sulfide and DIC reveal
a distinct SMTZ around 230 cm depth at both sites, where SO4-AOM with upward-diffusing CH4 results in the
con-comitant removal of porewater SO24− and CH4 and in the
accumulation of dissolved sulfide and DIC in the porewa-ters of these sediments (Fig. 3). The depth of the SMTZ and the steep increase in CH4to > 3 mM below the SMTZ
found in this study are consistent with earlier observations in sediments of the western Black Sea (Henkel et al., 2012; Holmkvist et al., 2011b; Jørgensen et al., 2001, 2004; Knab et al., 2009; Leloup et al., 2007). The location of the SMTZ, however, has progressed downwards in the last ca. 9000 years, following the inflow of SO24−-rich saltwater into the Black Sea basin (Fig. 7; see also Henkel et al., 2012).
Calculated diffusive fluxes of SO24− and CH4 to the
SMTZ (∼0.2 mmol SO24− m−2 d−1 and 0.08 mmol
CH4 m−2 d−1) and modeled areal rates of SO4-AOM
(∼0.16 mmol m−2d−1)suggest that AOM accounts for∼40
to 70 % of the total SO24− reduction in these sediments, with the remaining∼30 to 60 % attributed to organoclastic SO24− reduction. Such a high contribution of AOM exceeds the range of previous estimates that included experimentally measured SRR close to the sediment surface (∼7 to 18 %; Jørgensen et al., 2001, 2004). Around the SMTZ, SO4-AOM
is responsible for∼97 % of the total SO24−reduction (Fig. 6 and Table 6), thus enhancing the downward diffusive flux of sulfide into the deep limnic deposits of Unit III. Our model suggests that without this additional source of sulfide through SO4-AOM, the sulfidization front would currently be located
around 150 cm depth in the sediment (Fig. 8).
The consumption of upward-diffusing CH4 by SO24−
-driven AOM leads to a progressive enrichment of13C and D in the residual CH4above the SMTZ (Fig. 4) due to the
preferential oxidation of isotopically light CH4during SO4
-AOM (Alperin et al., 1988; Martens et al., 1999; Whiticar, 1999). Interestingly, porewater CH4above the SMTZ shows
unusually highδD–CH4values that fall outside of the
com-mon range observed for porewaterδD–CH4 (e.g., Whiticar,
1999). Future studies, however, are needed to resolve the cause of the strong D enrichment of dissolved CH4 above
the SMTZ in Black Sea sediments.
Modeled concentrations of CH4 indicate that the
Figure 8.Porewater profiles of dissolved sulfide, Fe2+and HPO24−. The green dashed line represents the modeled sulfide profile without SO4-AOM, indicating that the latter significantly enhances the downward sulfidization. Blue dashed lines denote the modeled Fe2+ and
HPO24− profiles without ongoing Fe oxide reduction in the limnic deposits (i.e., no Fe-AOM). Note that concentrations of Fe2+ were multiplied 10 times in the model simulation without Fe oxide reduction to better visualize the potential release of Fe2+through a cryptic S cycle (correspondingxaxis at bottom). Red dotted lines and roman numbers indicate the transitions between the lithological Unit I (modern coccolith ooze), Unit II (marine sapropel) and Unit III (limnic deposits). The orange bar represents the sulfate-methane transition zone (SMTZ), and the orange dashed line shows the current position of the downward-migrating sulfidization front (S front).
and can thus be used to derive kinetic isotope fractiona-tion factors for carbon (εC)and hydrogen (εH)associated
with SO4-AOM at the SMTZ using the Rayleigh distillation
function (Crowe et al., 2011; Egger et al., 2015b; Rayleigh, 1896; Whiticar, 1999). Corresponding estimates for εC of ∼8 ‰ (R2=0.972) and εH of ∼58 ‰ (R2=0.982) are at
the lower end of previously documented values in marine and brackish–marine environments (8–38 ‰ forεCand 100–
324 ‰ for εH; Alperin et al., 1988; Egger et al., 2015b;
Holler et al., 2009; Martens et al., 1999; Reeburgh, 2007). Note, however, that the Rayleigh distillation function only applies to closed systems (Rayleigh, 1896). These estimates should therefore be interpreted as an approximation, as more accurate estimates would require isotope modeling (e.g., Alperin et al., 1988).
At the base of the SMTZ, upward-diffusing CH4reveals
an initial depletion in δ13C–CH4 (Fig. 4). Such a shift to 13C-depleted CH
4, together with a decrease in its
concentra-tion, could indicate an enzyme-mediated equilibrium C iso-tope exchange during SO4-AOM at low SO24−concentrations
(< 0.5 mM; Holler et al., 2012; Yoshinaga et al., 2014). The effect of such mechanisms on deuterated CH4is likely
lim-ited.
4.1.3 Cryptic S cycling
Earlier studies showed evidence for ongoing SO24−reduction (< 1 nmol cm−3d−1) within the SO24−-depleted (< 0.5 mM) limnic deposits below the SMTZ in sediments of the Black Sea (Holmkvist et al., 2011b; Knab et al., 2009; Leloup et
al., 2007), Baltic Sea (Holmkvist et al., 2011a, 2014; Leloup et al., 2009) and Alaskan Beaufort Sea (Treude et al., 2014), likely driven by SO24− production from re-oxidation of dis-solved sulfide with oxidized Fe minerals. In this mecha-nism, Fe oxides enhance the recycling of sulfide to SO24− in a cryptic S cycle (Holmkvist et al., 2011a; Treude et al., 2014), thereby fueling SO24−-driven AOM in Fe-oxide-rich sediments. In this cryptic S cycle, dissolved sulfide is oxi-dized to zerovalent sulfur (S0), a key intermediate in AOM,
which is subsequently disproportionated to SO24−and sulfide by associatedDeltaproteobacteria(Holmkvist et al., 2011a; Milucka et al., 2012; Sivan et al., 2014; Treude et al., 2014). The additional SO24−, produced during S0
disproportiona-tion, may then be re-used by the methanotrophic archaea as an electron acceptor for SO4-AOM (Milucka et al., 2012).
Our model results suggest slow rates of ongoing SO24− reduction of < 0.2 nmol cm−3d−1(Fig. 6) within the limnic deposits below the SMTZ exposed to dissolved sulfide (Ta-ble 6), in line with estimated SRR based on35SO2−
4
incu-bation experiments with Black Sea sediments from below the SMTZ of∼0.1–0.5 nmol cm−3d−1 (Knab et al., 2009;
Leloup et al., 2007). Below the sulfidization front, SRR show a distinct peak of∼5 pmol cm−3d−1. Active SO2−
4 reduction
in these SO24−-depleted sediments requires deep SO24− for-mation to maintain low net rates of SO24−reduction. In the model, S0disproportionation is the only potential source of
porewater SO24−at depth (Table 3). Formation of S0, in turn,
Figure 9.Schematic of the main diagenetic processes discussed in this study and their imprint on the geochemical solid-phase (left) and porewater profiles (right). Accumulation of marine sediments with time and the subsequent downward diffusion of SO24− into the CH4-bearing limnic sediment stimulate SO4-AOM around the sulfate-methane transition zone (SMTZ), thus enhancing the down-ward sulfidization of the Fe-oxide-rich lake deposits. Below the sul-fidization front (S front), HPO24−released during reductive dissolu-tion of Fe oxides is bound again in vivianite, leading to an enrich-ment in sedienrich-mentary P in these sedienrich-ments. Numbers on the right indicate the key reactions occurring in the corresponding sediment layers as described in Table 3. Note that in this study, Fe-AOM (R20) was assumed as the main source of porewater Fe2+below the S front to further test the potential impact of Fe-AOM on pore-water CH4. However, based on the geochemical data, we cannot exclude a potential role for organoclastic Fe reduction (R3) and/or reactivation of less reactive Fe oxides by methanogens.
S0 disproportionation peak of ∼15 pmol cm−3d−1 around
the sulfidization front (Fig. 6). Thus, based on the model as-sumptions, we conclude that Fe oxides increase the transfor-mation of sulfide to SO24−via formation and subsequent dis-proportionation of S0 in these sediments, as suggested
pre-viously (Holmkvist et al., 2011b; Knab et al., 2009; Leloup et al., 2007). Such recycling of SO24−stimulates slow rates of SO4-AOM in the sediments below the SMTZ, explaining
the low background rates of SO24− reduction in the SO24− -depleted limnic deposits. These results support recent find-ings of indirect Fe-stimulated SO24−-driven AOM in labora-tory experiments (Sivan et al., 2014), and highlight that Fe oxides could play a significant role as stimulators of AOM and S recycling in natural environments.
4.2 Fe reduction below the sulfidization front
Below the sulfidization front, Fe2+starts to accumulate in the porewater (Fig. 3). Although previous studies have also
re-ported an increase of dissolved Fe2+around the depth where
sulfide levels drop below the detection limit (Holmkvist et al., 2011b; Jørgensen et al., 2004; Knab et al., 2009), the source of this porewater Fe2+ has remained unknown. One possible explanation could be that the elevated Fe2+ concen-trations at depth represent remnant Fe2+ accumulated dur-ing the Black Sea “lake” phase (Knab et al., 2009). In our model, Fe2+shows a broad peak of∼300 µM until∼300 cm depth in the sediment during the initial lake phase, assum-ing organoclastic Fe reduction to be the only Fe reduction pathway (data not shown). The removal of Fe2+through
au-thigenic formation of reduced Fe(II) minerals, however, pre-vents the accumulation of substantial amounts of Fe2+in the
porewater below∼300 cm sediment depth during the lake phase (Fig. 8). We therefore conclude that the high concen-trations of dissolved Fe2+below the sulfidization front are
most likely indicative of active Fe reduction in these sedi-ments.
4.2.1 Fe reduction through cryptic S cycling
In theory, a cryptic S cycle, as described in Sect. 4.1.3, could result in net accumulation of dissolved Fe2+ if the sulfide consumption from reaction with ferric Fe outweighs the pro-duction of sulfide from SO24− reduction. Modeled Fe2+ in-deed shows a peak of < 100 µM directly below the sulfidiza-tion front, assuming no active Fe reducsulfidiza-tion in the limnic de-posits (Fig. 8). Model simulations further indicate that, based on the reaction network used in this study (Table 3), cryp-tic S cycling could result in a buildup of porewater Fe2+ of
∼300 µM at depth in the sediment provided there was no precipitation of reduced Fe(II) minerals (Fig. S2). However, concentrations of dissolved Fe2+are too low compared to the
measurements and are confined to sediments between 300 and 400 cm depths only. The diagenetic model developed in this study therefore suggests that cryptic S cycling is unlikely to explain the high concentrations (∼800 µM) of dissolved Fe2+observed in the deep limnic deposits.
4.2.2 Organoclastic Fe reduction
In the model, the reduction of Fe oxides coupled to organic matter degradation only occurs with the easily reducibleα phase in order to allow for the burial of the more crystalline β phase at depth (Table 3). Since theαphase is efficiently reduced in the upper few centimeters during organoclastic Fe reduction, no easily reducible Fe oxides are being buried into the deep sediments in the diagenetic model. Organoclas-tic Fe reduction therefore does not occur within the mod-eled deep limnic deposits that exclusively contain more crys-talline (β)and refractory (γ )Fe oxides (Fig. 5). Instead, we assume that CH4represents a plausible electron donor for the
depth in the model provides an estimate of an upper con-straint on the potential importance of Fe-AOM in Black Sea sediments. As a result of this assumption, however, the model results cannot be used to conclude whether Fe-AOM is more likely than organoclastic Fe reduction.
An increasing body of geochemical evidence and labo-ratory incubation experiments shows that Fe-AOM might be occurring in a variety of different aquatic environments (Amos et al., 2012; Beal et al., 2009; Crowe et al., 2011; Eg-ger et al., 2015b; RiedinEg-ger et al., 2014; Scheller et al., 2016; Segarra et al., 2013; Sivan et al., 2011; Wankel et al., 2012). In addition, several studies have shown that Fe-reducing mi-croorganisms are able to outcompete methanogens for com-mon substrates (e.g., acetate and H2), thus reducing the
con-centrations of these common primary electron donors to lev-els that are too low for methanogens to grow (Achtnich et al., 1995; Lovley and Phillips, 1987; Lovley et al., 1989). These results, together with the observed capability of methanogens to switch from CH4production to Fe reduction (Bodegom et
al., 2004; Bond and Lovley, 2002; Liu et al., 2011; Reiche et al., 2008; Sivan et al., 2016; Vargas et al., 1998), led to the common conclusion that Fe oxides exert a suppressive effect on methanogenesis. Ongoing CH4 production in the
Fe-oxide-rich limnic deposits, as deduced from the isotopic composition of porewater CH4(Fig. 4), could then indicate
limited organoclastic Fe reduction in these sediments. However, there is increasing evidence that (semi)conductive crystalline Fe oxides (e.g., hematite and magnetite) can, in fact, stimulate concurrent methano-genesis and organoclastic Fe reduction through direct interspecies electron transfer, by serving as electron conduits among syntrophic CH4-producing organisms at rates that
are substantially higher than those for interspecies electron transfer by H2 (Cruz Viggi et al., 2014; Kato et al., 2012;
Li et al., 2014; Zhou et al., 2014; Zhuang et al., 2015). The inhibitory effect of Fe reduction on methanogenesis thus appears to be lower for crystalline Fe oxides such as hematite and magnetite, which are less bioavailable to Fe-reducing organisms than poorly crystalline (amorphous) Fe oxides (e.g., ferrihydrite and lepidocrocite; Lovley, 1991; Qu et al., 2004; Zhuang et al., 2015). These findings indicate that the crystallinity and conductivity of Fe oxides may play a key role in determining whether methanogenesis is stimulated or suppressed in Fe-oxide-rich environments. In addition, the presence of methanogens that are able to rapidly switch between methanogenesis and reduction of Fe oxides could also result in a reactivation of less reactive Fe oxides that were not reduced during initial organoclastic Fe reduction in the deep methanogenic zone as suggested by Sivan et al. (2016). Thus, the deep limnic sediments may be characterized by a complex interplay of concurrent methanogenesis, Fe oxide reduction and methanotrophy, i.e., AOM.
4.2.3 Fe-AOM
Our model results indicate that Fe-AOM could also be a possible mechanism explaining the buildup of porewater Fe2+ below the sulfidization front. Previous studies have shown that in systems where production and oxidation of CH4take place concurrently, methanogenesis might conceal
the isotopic signature of AOM (Egger et al., 2015b; Seifert et al., 2006; Whiticar, 1999). Thus, unlike SO4-AOM,
Fe-dependent AOM likely only has little effect on the isotopic composition of porewater CH4due to the removal of small
amounts of CH4in sediments with ongoing methanogenesis.
This might explain why porewater CH4 does not show
en-richment in both heavy isotopes below the sulfidization front as would be expected if Fe-AOM would occur, but rather in-dicates antipathetic changes, i.e., depletion in13C–CH4and
enrichment in D–CH4, usually attributed to CH4production
from carbonate reduction (Chanton et al., 2005; Whiticar, 1999).
Model-derived rates for Fe-AOM of
∼0.04 pmol cm−3d−1 (Fig. 6) are significantly lower than potential Fe-AOM rates of ∼4 nmol cm−3d−1 es-timated from laboratory incubation studies (Egger et al., 2015b; Segarra et al., 2013; Sivan et al., 2011) with brackish and limnic sediment samples. This large deviation is likely due to an overestimation of Fe-AOM rates derived from stimulated microbial communities under laboratory condi-tions using freshly synthesized and thus easily bioavailable Fe oxides when compared to in situ conditions.
In the upper 800 cm of sediment, Fe-AOM accounts for < 1 % of total CH4 oxidation, with the remaining > 99 %
attributed to SO4-AOM (Table 6; see also Fig. S2).
How-ever, while high rates of SO4-AOM are mainly restricted to
the SMTZ, Fe-AOM might occur over a deep methanogenic zone, reaching far down into the sediment. To accurately as-sess the contribution of Fe-AOM to the total CH4
consump-tion in Black Sea sediments, addiconsump-tional knowledge about the vertical expansion of the Fe-oxirich limnic sediments de-posited during the Blake Sea lake phase would be required. 4.3 Impact of S–Fe–CH4dynamics on sedimentary P
diagenesis