UNIVERSIDADEFEDERALDO RIO GRANDE DO NORTE
UNIVERSIDADEFEDERAL DORIOGRANDE DO NORTE
CENTRO DECIÊNCIASEXATAS E DATERRA
PROGRAMA DEPÓS-GRADUAÇÃO EMCIÊNCIASCLIMÁTICAS
Impacts of the Madden–Julian Oscillation on
Intraseasonal Precipitation over
Northeast Brazil
Cati Elisa de Avila Valadão
Impacts of the Madden–Julian Oscillation on Intraseasonal
Precipitation over Northeast Brazil
Cati Elisa de Avila Valadão
Tese de Doutorado apresentada ao
Pro-grama de Pós-Graduação em Ciências Climáticas, do Centro de Ciências Exatas e da Terra da Universidade Federal do Rio Grande do Norte, como parte dos requisitos para obtenção do título de Doutor em Ciên-cias Climáticas.
Orientador: Prof. Dr. Paulo Sérgio Lucio
Co-orientadora: ProfaDra Rosane Rodrigues Chaves
Co-orientadora: ProfaDra Leila Maria Véspoli de Carvalho
Comissão Examinadora Prof. Dr. Paulo Sérgio Lucio (UFRN)
ProfaDraRosane Rodrigues Chaves (UFRN)
Prof. Dr. Everaldo Barreiros de Souza (UFPA) Prof. Dr. José Maria Brabo Alves (UECE)
Prof. Dr. David Mendes (UFRN)
Valadão, Cati Elisa de Avila.
Impacts of the Madden–Julian Oscillation on Intraseasonal Precipitation over Northeast Brazil / Cati Elisa de Avila Valadão. – Natal, RN, 2015.
111 f.: il.
Orientador: Prof. Dr. Paulo Sérgio Lucio.
Co-orientadora: ProfaDraRosane Rodrigues Chaves.
Co-orientadora: ProfaDraLeila Maria Véspoli de Carvalho.
Tese (Doutorado) – Universidade Federal do Rio Grande do Norte. Centro de Ciências Exatas e da Terra. Programa de Pós-Graduação em Ciências Climáticas.
1. Precipitação pluviométrica – Nordeste (Brasil) – Tese. 2. Precipitação pluviométrica – Seridó (RN) – Tese. 3. Sistema de Monção da América do Sul – Tese. 4. Zona de Convergência do Atlântico Sul – Tese. 5. Zona de Convergên-cia Intertropical do Atlântico – Tese. I. Lucio, Paulo Sérgio. II. Chaves, Rosane Rodrigues. III. Carvalho, Leila Maria Véspoli de. IV. Universidade Federal do Rio Grande do Norte. V. Título.
Acknowledgments
I wish to express my thanks to all those who have aided me during the doctoral process. I wish to thank my supervisory team: Paulo S. Lucio, Rosane R. Chaves and Leila M. V. Carvalho, for all their support and advice. I am deeply grateful to Leila for inviting me to the UCSB, and for her advice, assistance, encouragement and friendship.
I acknowledge the financial assistance of the CAPES Foundation through the PhD schol-arships (CAPES REUNI, DS and BEX 9108/12-2).
Many thanks to Brant Liebmann and Dave Allured for helping me with the quality control of the station precipitation data.
I am also grateful to the Earth Research Institute and the Department of Geography for the opportunity to develop part of my doctoral research at the UCSB as a visiting graduate student, and also for the friendly environment and technical support provided during my stay. In particular, thanks to Charles Jones for his assistance and for providing the MJO index; to Rodrigo, Márcia, Haline, Lumari, Carol and Cláudia for their friendship.
Thanks to the Programa de Pós-Graduação em Ciências Climáticas for the friendly envi-ronment and the opportunity.
I wish to thank to the agencies that provided the data that made this research possible. In particular, thanks to AESA, ANA, EMPARN, FUNCEME, INEMA, INMET, LabMet-UEMA, LAMEP/PE, SEMAR/PI, SEMARH/AL, SEMARH/SE, SUDENE, for provid-ing the station rainfall data; and to NASA and NOAA for providprovid-ing the gridded data.
I give my thanks and gratitude to Luciane and Alyppyo for their friendship, encourage-ment and for taken so good care of Loki during my one-year stay at the UCSB.
Resumo
Este estudo tem como objetivo investigar os impactos da Oscilação de Madden–Julian (OMJ) na precipitação da região Nordeste do Brasil (NEB). Para tanto, foram utiliza-dos dautiliza-dos diários de precipitação baseautiliza-dos em 492 pluviômetros distribuíutiliza-dos na região e
cobrindo um período de 30 anos (1981−2010). As análises de composições de
anoma-lias de precipitação, radiação de onda longa e fluxo de umidade foram obtidas com base no índice da OMJ desenvolvido por Jones–Carvalho. Para distinguir o sinal da OMJ de outros padrões de variabilidade climática, todos os dados diários foram filtrados na
es-cala de 20−90 dias; portanto, somente dias classificados como eventos da OMJ foram
considerados nas composições.
Uma análise preliminar baseada apenas nos dados de precipitação foi feita para uma pequena área localizada no interior semiárido do NEB, conhecida como Seridó. Essa microrregião é uma das áreas mais secas do NEB e foi reconhecida pela Convenção das Nações Unidas para o Combate à Desertificação e Mitigação dos Efeitos das Secas como particularmente vulnerável à desertificação. Composições de anomalias de precipitação foram feitas para cada uma das oito fases da OMJ durante Fevereiro–Maio (principal período chuvoso da microrregião). Os resultados mostraram a existência de variações significativas nos padrões de precipitação (de precipitação excessiva à deficiente) associ-ados à propagação da OMJ. A combinação dos sinais de precipitação obtidos durantes as
fases úmidas e secas da OMJ mostrou que a diferença corresponde cerca de 50−150%
de modulação das chuvas na microrregião.
Em seguida, uma investigação abrangente sobre o papel da OMJ sobre toda a região Nordeste foi feita considerando-se todas as quatro estações do ano. Os resultados mos-traram que os impactos da OMJ na precipitação intrassazonal do NEB apresentam forte sazonalidade. A maior coerência espacial dos sinais de precipitação ocorreram durante o verão austral, quando cerca de 80% das estações pluviométricas apresentaram
anoma-lias positivas de precipitação durante as fases 1−2 da OMJ e anomalias negativas de
precipitação nas fases 5−6 da oscilação.
Rossby acopladas convectivamente e as características climáticas predominantes sobre a região em cada estação do ano. O aumento de precipitação observado sobre a maior parte do NEB durante o verão e primavera austrais encontra-se associado com o fluxo de umi-dade de oeste (regime de oeste), o qual favorece a ativiumi-dade convectiva em amplas áreas da América do Sul tropical. Por outro lado, as anomalias de precipitação durante o in-verno e outono austrais apresentaram uma variabilidade espacial mais complexa. Durante estas estações do ano, as anomalias de precipitação observadas nas estações localizadas na costa leste do NEB dependem da intensidade do anticiclone do Atlântico Sul, o qual é modulado em grande parte por ondas de Rossby. As características topográficas do NEB parecem desempenhar um papel importante na variabilidade observada na precip-itação, principalmente nestas áreas costeiras. A intensificação do anticiclone aumenta a convergência dos ventos alísios na costa contribuindo para a ocorrência de precipitação observada à barlavento do planalto da Borborema. Por outro lado, o aumento da sub-sidência parece ser responsável pelos déficits de precipitação observados à sotavento. Tais condições mostraram-se típicas durante o predomínio do regime de leste sobre a região tropical da América do Sul e o NEB, durante o qual ocorre uma diminuição no fluxo de umidade proveniente da Amazônia.
Palavras-chave: OMJ; NEB; pluviômetro; Sistema de Monção da América do Sul;
Abstract
The impacts of the Madden–Julian Oscillation (MJO) on precipitation over North-east Brazil (NEB, also known as Nordeste) are evaluated based on daily raingauge data
from 492 stations over 30-year period (1981−2010). Composites of precipitation,
outgo-ing longwave radiation and moisture-flux anomalies are performed for each phase of the MJO based on the Jones–Carvalho MJO index. To distinguish the MJO signal from other
patterns of climate variability, daily data are filtered using a 20−90 day band-pass filter;
only days classified as MJO events are considered in the composites.
A preliminary analysis based on precipitation data was conducted for a small scale area located in NEB’s semiarid interior, in an area known as Seridó. The Seridó is one of the driest regions in NEB, and is recognized by the United Nations Convention to Combat Desertification as particularly vulnerable to desertification. Composites of rainfall anoma-lies were computed for each of the eight phases of the MJO during February-May, which is Seridó’s main rainy season. Results showed that the rainfall patterns in Seridó undergo substantial changes (from enhancement to suppression) as the convective center of the MJO propagates eastward. When combining the MJO signals for wet and dry phases, the
difference represents about 50−150% modulation of the mean rainfall over Seridó.
Then a comprehensive analysis of the role of the MJO in modulating the spatiotem-poral variation of NEB’s precipitation was performed, considering all four seasons. The results showed strong seasonality of the MJO impact on precipitation. The most spatially coherent signals of precipitation anomalies occurred in the austral summer, when about
80% of the raingauge stations showed increased precipitation during phases 1−2 and
suppressed precipitation in phases 5−6 of the oscillation.
coastal areas and precipitation windward of the coastal range. Conversely, the intensifi-cation of the subsidence was responsible for precipitation deficits in the lee side of the range. These conditions were typically observed when easterly regimes dominate over tropical South America and NEB, decreasing moisture flow from the Amazon.
Keywords: MJO; NEB; raingauge; South America Monsoon System; South Atlantic
Declarations
This thesis corresponds to an extension of two manuscripts submitted to two distinct journals. The first manuscript entitled "MJO Modulation of Station Rainfall in the
Semi-arid Seridó, Northeast Brazil" was published by the journal Atmospheric and Climate
Sciences (ACS). The second one entitled "Impacts of the Madden-Julian Oscillation on
Intraseasonal Precipitation over Northeast Brazil" was accepted for publication in the
Contents
Contents i
List of Figures iii
List of Tables v
List of Abbreviations vii
1 Introduction 1
2 Background 7
2.1 The Madden–Julian Oscillation . . . 7
2.2 Review of previous work . . . 10
3 Data and methods 13 3.1 Data . . . 13
3.1.1 Precipitation . . . 13
3.1.2 Convection and moisture transport . . . 14
3.1.3 The MJO index . . . 15
3.2 Methods . . . 18
4 Precipitation distribution over NEB 19 4.1 Annual and seasonal precipitation climatology . . . 19
4.2 Factors influencing precipitation regimes . . . 22
5 Impacts of the MJO on intraseasonal precipitation over NEB 25 5.1 Characteristics of the MJO . . . 25
5.2 A small scale study area . . . 27
5.3 Extent of the MJO influence on precipitation . . . 35
6 MJO–related changes in convection and moisture transport 45 6.1 Summer . . . 45
6.4 Spring . . . 66 6.5 Chapter summary . . . 72
7 Summary and conclusions 73
7.1 A summary of the thesis . . . 73 7.2 Recommendations for future studies . . . 75
List of Figures
2.1 Equatorial vertical cross-section of the MJO as it propagates from the
Indian Ocean to the western Pacific . . . 8
2.2 Schematic depiction of the large-scale wind structure of the MJO . . . 10
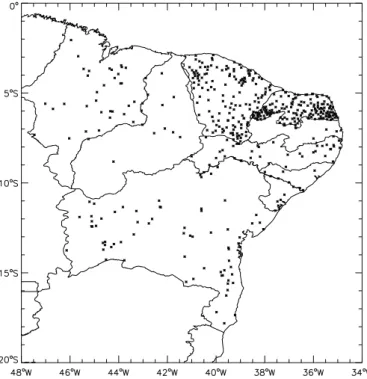
3.1 Raingauge station distribution over NEB used in this study. . . 14
3.2 Phase composites of band-filtered OLR anomalies (W m−2) for the
aus-tral summer . . . 17
4.1 Location of raingauge stations over NEB, annual precipitation, and to-pography . . . 20 4.2 Seasonal percentage of mean annual total precipitation . . . 21
5.1 Time series of the daily MJO phase from 1 January 2001−31 December
2005 . . . 26
5.2 Temporal distribution of the MJO activity for the 1981−2010 period . . . 27
5.3 Temporal distribution of the SST anomalies for the 1981−2010 period . 27
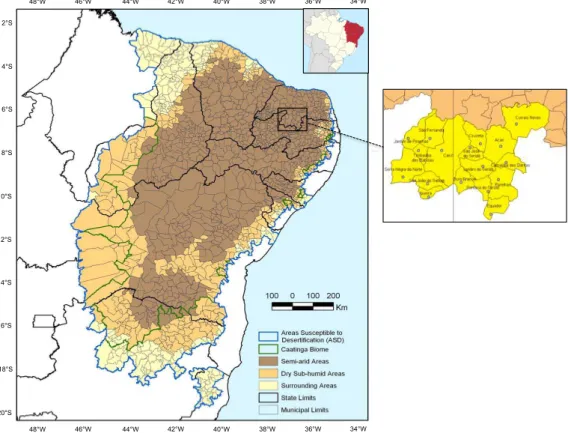
5.4 Location of the Seridó/RN and areas susceptible to desertification accord-ing to the UNCCD . . . 29 5.5 Time series of 3-day running-mean rainfall for four stations in the Seridó
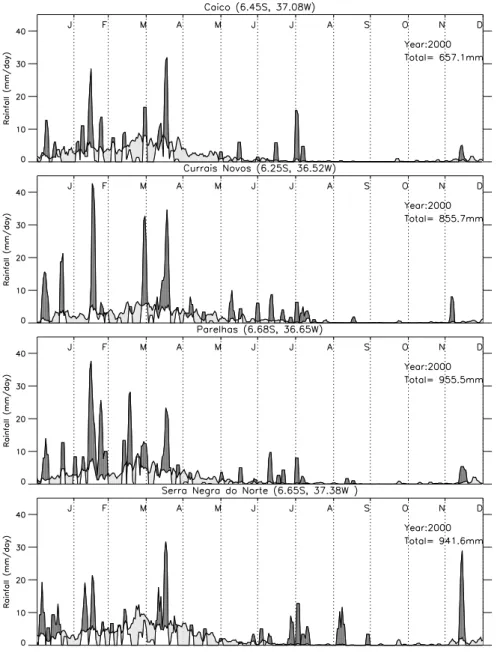
for the period of 1 January – 31 December, 2000 . . . 31 5.6 As in Fig. 5.5, but for the year 2001 . . . 32 5.7 MJO cycle of rainfall anomaly (mm/day) for 17 stations in the Seridó/RN
during February–May, 1981−2010 . . . 34
5.8 Sign and magnitude of individual station precipitation anomalies (mm/day) for each MJO phase during summer (DJF) . . . 37 5.9 Sign and magnitude of individual station precipitation anomalies (mm/day)
for each MJO phase during fall (MAM) . . . 39 5.10 Sign and magnitude of individual station precipitation anomalies (mm/day)
for each MJO phase during winter (JJA) . . . 41
6.1 DJF OLR anomalies (W m−2) for each MJO phase . . . 48
6.2 DJF moisture-flux anomalies (kg m−1s−1) for the MJO phases 1 and 2 . 49 6.3 As in Fig. 6.2, but for the DJF MJO phases 3 and 4 . . . 50
6.4 As in Fig. 6.2, but for the DJF MJO phases 5 and 6 . . . 51
6.5 As in Fig. 6.2, but for the DJF MJO phases 7 and 8 . . . 52
6.6 MAM OLR anomalies (W m−2) for each MJO phase . . . 55
6.7 MAM moisture-flux anomalies (kg m−1s−1) for the MJO phases 1 and 2 56 6.8 As in Fig. 6.7, but for the MAM MJO phases 3 and 4 . . . 57
6.9 As in Fig. 6.7, but for the MAM MJO phases 5 and 6 . . . 58
6.10 As in Fig. 6.7, but for the MAM MJO phases 7 and 8 . . . 59
6.11 JJA OLR anomalies (W m−2) for each MJO phase . . . 61
6.12 JJA moisture-flux anomalies (kg m−1s−1) for the MJO phases 1 and 2 . . 62
6.13 As in Fig. 6.12, but for the JJA MJO phases 3 and 4 . . . 63
6.14 As in Fig. 6.12, but for the JJA MJO phases 5 and 6 . . . 64
6.15 As in Fig. 6.12, but for the JJA MJO phases 7 and 8 . . . 65
6.16 SON OLR anomalies (W m−2) for each MJO phase . . . 67
6.17 SON moisture-flux anomalies (kg m−1s−1) for the MJO phases 1 and 2 . 68 6.18 As in Fig. 6.17, but for the SON MJO phases 3 and 4 . . . 69
6.19 As in Fig. 6.17, but for the SON MJO phases 5 and 6 . . . 70
List of Tables
5.1 Rainguage station details for the Seridó/RN microregion . . . 30 5.2 Seasonal distribution of MJO events as function of the MJO phases for
the 30-year period . . . 35
List of Abbreviations
AL Alagoas.
BA Bahia.
CE Ceará.
DJF December–January–February.
ENSO El Niño–Southern Oscillation.
FMAM Februry–March–April–May.
ITCZ Intertropical Convergence Zone.
JJA June–July–August.
MA Maranhão.
MAM March–April–May.
MJO Madden–Julian Oscillation.
NEB Northeast Brazil.
OLR Outgoing Longwave Radiation.
PB Paraíba.
PE Pernambuco.
PI Piauí.
PSA Pacific–South American.
RN Rio Grande do Norte.
SACZ South Atlantic Convergence Zone.
SAMS South American Monsoon System.
SE Sergipe.
SON September–October–November.
SST Sea Surface Temperature.
Chapter 1
Introduction
T
HIS THESISaims to show that the Madden–Julian Oscillation impacts on intraseasonalprecipitation over Northeast Brazil can be felt at raingauge station level in all four seasons.
Problem Description
Northeast Brazil (NEB) is the third-most-populous and the third largest region of Brazil. NEB is located in the easternmost corner of the South American continent,
ex-tending approximately from 1◦S–19◦S and 34
.5◦W–48◦W and is divided into nine states:
Maranhão (MA), Piauí (PI), Ceará (CE), Rio Grande do Norte (RN), Paraíba (PB), Per-nambuco (PE), Alagoas (AL), Sergipe (SE), and Bahia (BA). The region is characterized by a highly variable precipitation distribution both on spatial and temporal scales (e.g., Kousky and Chu, 1978; Kousky, 1979; Chu, 1983; Rao et al., 1993).
secondary maximum in precipitation, such as central and northern BA during December and March and coastal BA in December and May.
Rainfall distributes into several events (sometimes only a few days in length) that are separated by long intervals with reduced or no rain (breaks). For instance, Moron et al. (2007) pointed out that in CE the number of wet days varies from 23 to 35, reaching 50 days at the wettest locations. They found near-zero spatial correlations between individ-ual stations that are separated by distances larger than 100 km over CE. Silva et al. (2006) estimated the complexity of daily records of raingauge precipitation in CE using a hierar-chical approach based on sequences of precipitation events with different lengths. They showed that precipitation in the region exhibits more random than periodic sequences, indicating a large degree of complexity. Their auto-correlation analysis, for lags varying
from 0−25 days, showed that the lag-1 auto-correlation of daily precipitation is near zero
for most stations.
Over the last four decades, many observational and modeling studies have been con-ducted to understand the causes related to the severe recurrent droughts in the semiarid areas (e.g., Hastenrath and Heller, 1977; Moura and Shukla, 1981; Chu, 1983; Hastenrath and Greischar, 1993; Nobre and Shukla, 1996; Greischar and Hastenrath, 2000; Pezzi and Cavalcanti, 2001; Moura and Hastenrath, 2004; Souza et al., 2005; Andreoli and Kayano, 2006; Rodrigues et al., 2011). These studies have shown that, on interannual timescales, precipitation variability over the region is strongly related to the meridional displacements of the Atlantic Intertropical Convergence Zone (ITCZ) and changes in the zonally oriented Walker circulation associated with the El Niño–Southern Oscillation (ENSO). Motivated by the evidence that both the Pacific and Atlantic sea surface tem-perature (SST) influence precipitation over tropical Brazil, Souza et al. (2005) combined both effects to examine precipitation variability over eastern Amazon and NEB, during the
autumn rainy season (March–May, 1982−2001). Their unfavorable scenario was defined
3
On intraseasonal timescales, the MJO has been documented as a major source of vari-ability in the tropics (e.g., Madden and Julian, 1971; Madden and Julian, 1972; Madden and Julian, 1994; Zhang, 2005). Many studies have revealed that the propagation and evo-lution of the MJO events have great influence on weather and climate around the globe. Important relationships between the MJO and precipitation variability have also been found over South America (e.g., Nogués-Paegle et al., 2000; Carvalho et al., 2002; Car-valho et al., 2004; Liebmann et al., 2004; Souza and Ambrizzi, 2006; Muza et al., 2009),
Africa (Pohl and Camberlin, 2006), Mexico (Mo and Higgins, 1998a), United States (e.g.,
Mo and Higgins, 1998b; Jones, 2000; Jones and Carvalho, 2012; Zhou et al., 2012),
Canada (Lin et al., 2010), Australia (Wheeler et al., 2009), Indonesia (e.g. Kanamori et al., 2013; Peatman et al., 2014), and China (e.g., Zhang et al., 2009; Jia et al., 2011). The MJO also affects monsoon systems (e.g., Hartmann and Michelsen, 1989; Hendon and Liebmann, 1990; Jones and Carvalho, 2002; Matthews, 2004; Pohl et al., 2007; Pai et al., 2009).
Aims and organisation of the thesis
Motivated by these previous studies, and by the social and economic importance of the intraseasonal precipitation variability at local scales, this research hypothesizes that the MJO effect on daily rainfall could be felt at the individual station level. Therefore, the main purpose of this thesis is to provide a comprehensive analysis of the role of the MJO in modulating the spatiotemporal variation of precipitation in the region based on local raingauge precipitation. More specifically, this study addresses the following questions:
• Can the MJO impact be detected in small-area station rainfall data?
• Is there evidence of a wide MJO impact on precipitation over the region?
• Do all stations have the same precipitation anomaly signs and what are their
mag-nitudes?
• Are there distinct seasonal differences of the impacts?
• How are the precipitation anomalies related to changes in the convection and
mois-ture transport over the region?
The thesis is organized as follows. Chapter 2 begins with a description of the MJO, followed by a review of the current state of understanding of its influence on precipitation over tropical Brazil and providing a justification for the approaches taken later.
Chapter 3 describes the data and methodology used is this study. Firstly, it describes the acquisition of daily rainfall datasets from different Brazilian agencies, and the amal-gamation of these data into a final daily dataset based on raingauge stations. Secondly, it describes the gridded data used to investigate the MJO–related changes in convection and circulation over the region. Then, the MJO index used to identify the MJO events is de-scribed. Lastly, it describes the technique used to obtain the daily intraseasonal anomalies of rainfall, convection and moisture transport, the compositing process and significance tests.
Chapter 4 focuses on the characteristics of rainfall distribution over NEB. It describes annual total precipitation over the region, and seasonal distribution of precipitation as a percentage of the annual total. Then, attention is turned to discuss the main factors affecting rainfall distribution over the region.
5
Then, Chapter 6 focuses on the mechanisms whereby the MJO distinctly affect pre-cipitation anomalies over NEB, again considering the eight phases of the MJO and all four seasons.
Chapter 2
Background
This chapter provides a general description of the MJO, followed by a review of its influence on convection and precipitation over tropical South America.
2.1
The Madden–Julian Oscillation
As stated in the Introduction, the MJO has been documented as the dominant intrasea-sonal variability in the tropics. This intraseaintrasea-sonal oscillation was discovered in the begin-ning of the 1970s, through the pioneer studies of Madden and Julian (1971) and Madden and Julian (1972), who discovered it in the zonal wind, pressure, and temperature data.
In those studies, the authors initially called the phenomenon the "40−50 day oscillation"
due to its preferred timescale. After that, other authors have called it as the "30−60-day
oscillation" or "intraseasonal oscillation". Nowadays, it has been regularly called as the Madden–Julian Oscillation or MJO.
The MJO consists of a planetary-scale envelope of enhanced convection and rainfall
that originates over the tropical Indian Ocean and propagates slowly eastward (about 5−6
m s−1) along the Indo-Pacific warm pool region (e.g., Madden and Julian, 1971; Madden
and Julian, 1972; Madden and Julian, 1994; Zhang, 2005; Adames and Wallace, 2014), which is accompanied by coherent dynamical patterns in wind, pressure and tempera-ture (Matthews et al., 2013). The MJO is a natural component of the coupled
ocean-atmosphere system, with an intraseasonal period of 30−90 days. A simplified schematic
Figure 2.1: Equatorial vertical cross-section of the MJO as it propagates from the Indian Ocean to the western Pacific. Red arrows indicate wind direction and red (blue) SST labels indicate positive (negative) SST anomalies, respectively.
Source:http://www.cpc.ncep.noaa.gov/products/precip/CWlink/MJO.
reverse the directions, resulting in anomalous easterlies (westerlies) to the west (east) of the convection.
As described in many studies (e.g., Hendon and Liebmann, 1994; Salby and Hendon, 1994; Zhang, 2005; Adames and Wallace, 2014; Li, 2014), the MJO shows a baroclinic Rossby-Kelvin wave couplet structure, characterized by a phase reversal between upper and lower troposphere.
9
are characteristic of planetary-scale Rossby waves. To the east of the convective center, low-level easterlies and upper-level westerlies characterize the equatorial Kelvin wave.
Recently, Adames and Wallace (2014) investigated the structure and evolution of the zonal wind and geopotential height anomaly fields in the MJO cycle, and discussed the differences between the upper- and lower-tropospheric MJO signatures. They found that
at the upper levels the flanking Rossby waves are centered at about 28◦N/S, just
equator-ward of the axes of the climatological-mean westerly jet streams, which serve as waveg-uides. They showed that the contrasting upper- and lower-level patterns consisted of a deep baroclinic mode, with perturbations of opposing polarity above and below the
400−hPa level, which dominates the tropical signature, plus a barotropic residual field
consisting of extratropical wave trains emanating from the flanking Rossby waves. They argued that, at most longitudes, the jet stream seems to act as bookend, preventing the poleward propagation of the MJO-related wave activity. Nevertheless, they emphasized that when the flanking Rossby waves pass through the climatological-mean jet exit re-gions, the zonal wind anomalies poleward of the highs or lows in the flanking Rossby waves are capable of extracting kinetic energy from the mean flow to force the extratrop-ical wave trains. In the northern hemisphere, the wave trains resemble the Pacific–North America (PNA) pattern. The southern hemisphere wave trains resemble the northern hemisphere pattern, and are known as the Pacific–South American (PSA) modes (Mo and Nogués-Paegle, 2001).
Figure 2.2: Schematic depiction of the large-scale wind structure of the MJO. The cloud
symbol indicates the convective center. Arrows represent anomalous winds at 850−and
200−hPa and the vertical motions at 500 hPa. "A" and "C" mark the anticyclonic and
cyclonic circulation centers, respectively. Dashed lines mark troughs and ridges. Source: Rui and Wang (1990).
2.2
Review of previous work
Some previous studies have shown that the MJO influences convection and precip-itation over tropical South America, including NEB. For instance, Repelli et al. (1998) argued that the NEB’s intense rainfall events during March 1997 were influenced by the passage of the MJO’s active convection over the region.
Kayano and Kousky (1999) investigated the seasonal variation of the MJO. They showed that in the western hemisphere the MJO has the greatest impact on convection over NEB during November–March.
Jones, Waliser, Lau and Stern (2004) investigated the influence of the MJO on global occurrences of extreme precipitation during November–May. They showed, by using Global Precipitation Climatology Project (GPCP) data, that the eastern part of South America (including NEB) exhibited robust signals of increased frequency of precipita-tion extremes during active MJO events.
How-11
ever, the 95th percentile of daily rainfall decreased over the region when the convection was enhanced over Indonesia and suppressed over the central Pacific.
As mentioned in the Introduction, Souza et al. (2005) also suggested that the MJO played an important role in modulating convection and intraseasonal precipitation over eastern Amazon/NEB during years with extreme climatic conditions. Anomalously de-ficient and abundant precipitation events occurred alternately during both their favorable and unfavorable scenarios.
A more specific work on the influence of the MJO on the intraseasonal rainfall over eastern Amazon/NEB was conducted by Souza and Ambrizzi (2006) during January–
May. They showed, by using 15-years of daily gridded station precipitation data (1987−
2001), that intensified precipitation over those regions occurred during the establishment of a quasi-stationary deep convection band triggered by simultaneous occurrence of the ITCZ and a pattern similar to the South Atlantic Convergence Zone (SACZ), which were dynamically embedded within the propagation of the MJO’s active convective center over tropical South America and the Atlantic Ocean.
More recently, Mo et al. (2012) examined the influence of the MJO on Pan America
during December–March and June–September for the period 1979−2001. Analyzing the
evolution of the MJO cycle, they showed that in South America, as the tropical outgoing longwave radiation anomalies propagate eastward, the wave train propagates from the subtropics to the equator. In addition, they concluded that the largest influence during December–March was over northeastern Brazil.
The review carried out in this chapter has identified the previous work that investi-gated the MJO influence over tropical Brazil mostly during austral summer or autumn seasons, considering gridded precipitation datasets. Although these studies have greatly contributed to improve the understanding of the MJO’s influence over tropical Brazil, none of them focused specifically over NEB, or evaluated the MJO impact at individual station level. Even though a MJO signal may be difficult to detect at local scale, such information can be especially important for municipalities under water stress. Matthews et al. (2013) pointed out that it is generally at these local scales that the societal effects of precipitation are felt. For instance, when state of emergency are declared at these small scales due to floods or mud slides in areas with steep topography. Moreover, information on whether the MJO influence over NEB occurs during winter or spring seasons is also lacking.
Chapter 3
Data and methods
This chapter begins with a description of the raw precipitation data obtained for the study. It also describes the gridded data used to investigate the MJO–related changes in convection and circulation, followed by the analysis procedure.
3.1
Data
3.1.1
Precipitation
To properly identify local patterns of daily rainfall variability across NEB it was de-sirable to obtain the largest number of stations possible. Therefore, the raw precipitation data used were obtained from several Brazilian agencies:
• Agência Executiva de Gestão das Águas do Estado da Paraíba (AESA);
• Agência Nacional de Águas (ANA);
• Empresa de Pesquisa Agropecuária do Rio Grande do Norte (EMPARN);
• Fundação Cearense de Meteorologia e Recursos Hídricos (FUNCEME);
• Instituto do Meio Ambiente e Recursos Hídricos da Bahia (INEMA);
• Instituto Nacional da Meteorologia (INMET);
• Laboratório de Meteorologia/Universidade Estadual do Maranhão (LabMet/UEMA);
• Laboratório de Meteorologia do Instituto de Tecnologia de Pernambuco (LAMEP/PE);
• Secretaria do Estado do Meio Ambiente e dos Recursos Hídricos de Alagoas
(SE-MARH/AL);
• Secretaria do Estado do Meio Ambiente e dos Recursos Hídricos de Sergipe
(SE-MARH/SE);
• Secretaria Estadual de Meio Ambiente e Recursos Hídricos do Piauí (SEMAR/PI);
These data were available for different periods, and consisted of records with a variety of formats. A quality control procedure was performed to check for erroneous or missing data, and also for duplicate stations in all datasets. Some of the records contained only a few years of data, so they were discarded. Moreover, some of the records had received an initial quality control by their original providers. Combining these datasets and con-sidering only stations with less than 5% of missing data resulted in a total of 492 stations
located over the region (Fig. 3.1), from 1 January–31 December, 1981−2010.
The highest density of stations is located in CE and RN states, and the lowest in PB due to missing values within the available original records. The combination of these multiple precipitation datasets allowed to increase both the number of stations and the length of records (number of years) comparatively to previous studies based on raingauge data (e.g., Souza et al., 2005; Souza and Ambrizzi, 2006).
Figure 3.1: Raingauge station distribution over NEB used in this study.
3.1.2
Convection and moisture transport
Daily averages of interpolated outgoing longwave radiation (OLR) from the National
Oceanic and Atmospheric Administration (NOAA), with 2.5◦spatial-grid resolution were
15
by the NOAA’s Earth System Research Laboratory/Physical Sciences Division (www.
esrl.noaa.gov/psd).
To examine the moisture transport changes during the MJO propagation, daily av-erages of vertically integrated moisture-flux data were obtained from the Modern Era Retrospective-Analysis for Research and Applications (MERRA). These datasets were developed by the National Aeronautics and Space Administration (NASA), with
spa-tial resolution of 0.5◦ latitude and 0.67◦ longitude. MERRA uses an advanced data
assimilation system and was generated with the Goddard Earth Observing System at-mospheric general circulation model (Rienecker et al., 2011). These data were pro-vided by the NASA’s Goddard Earth Sciences Data and Information Services Center
(disc.sci.gsfc.nasa.gov).
3.1.3
The MJO index
The MJO index developed by Jones and Carvalho (2012) was used here to identify and diagnose the MJO activity. The index was available as daily time series. The index was constructed using daily averages of the zonal wind components at 850-hPa (U850) and 200-hPa (U200) from the National Centers for Environmental Prediction/National Center for Atmospheric Research (NCEP/NCAR) reanalysis and OLR (Liebmann and Smith, 1996). The daily climatology was removed and data was detrended and filtered in frequency domain to retain intraseasonal variations between 20 and 200 days. The MJO index was constructed by applying combined empirical orthogonal function (EOF)
analy-sis of equatorially daily averaged (15◦S–15◦N; all longitudes) U850 and U200
bandpass-filtered anomalies.
To identify the MJO events, they considered the phase diagram based on of the first two normalized principal components (PC1, PC2), similarly to Wheeler and Hendon (2004) (see the phase-space diagram in their Fig. 7). An MJO event was defined based on the following criteria:
1. the phase angle between PC1 and PC2 was required to systematically rotate coun-terclockwise to ensure the eastward propagation of the oscillation at least to the Maritime Continent (phase 5);
2. the amplitude√PC12+PC22should be always larger than 0
.35;
3. the mean amplitude during the event was larger than 0.9; and
4. the entire duration of the event should last between 30 and 90 days.
These same criteria were also used in Jones (2009), Jones and Carvalho (2011a) and
Matthews (2000) and Matthews (2008). Complete details of this approach can be found in Jones and Carvalho (2012). The Jones–Carvalho MJO index is a daily index, calculated for the entire calendar year, whether there was an MJO event or not. The index is divided into nine phases, with phase 0 representing quiescent days (or MJO inactive) and phases
from 1−8 corresponding to the geographical position of its active convective center. For
example, the time series of the MJO index [MJOI (t)] for the period of 1−28 February
2000 is
MJOI (t) = (0,0,0,0,0,0,0,2,1,1,1,1,1,1,2,2,2,2,2,2,2,3,3,3,3,3,3,3).
For this particular example, from 1−7 February there was no MJO activity. A MJO
event developed on 8 February over the Indian Ocean (phase 2), retrograded to eastern Africa (phase 1) on 9 February and stayed in this phase for 6 days, and then continued propagating eastward from then on.
Figure 3.2 illustrates the canonical life cycle of the MJO based on composites of band-filtered OLR anomalies for the austral summer. Negative OLR anomalies (active convec-tion) appear over eastern Africa (phase 1), and simultaneously, a region of positive OLR anomalies (suppressed convection) appears over the western Pacific, consistent with the convective "dipole" pattern which is a well-known feature of the MJO (e.g. Madden and Julian, 1972; Rui and Wang, 1990; Zhang, 2005) [see schematic depiction of Figure 2.1 in Chapter 2]. Then, the convective envelope slowly migrates eastward to the Indian Ocean
in phases 2−3, passing through the Maritime Continent in phases 4−5, continuing into
the western Pacific during phases 6−7, and circumnavigating into the western
17
0o 60oE 120oE 180oE 120oW 60oW 0o
20oS
10oS
0o
10o
N 20oN
Phase 1
0o 60oE 120oE 180oE 120oW 60oW 0o
20oS
10oS
0o
10o
N 20oN
Phase 2
0o 60oE 120oE 180oE 120oW 60oW 0o
20o
S 10oS
0o
10o
N 20oN
Phase 3
0o 60oE 120oE 180oE 120oW 60oW 0o
20o
S 10oS
0o
10oN
20oN
Phase 4
0o 60oE 120oE 180oE 120oW 60oW 0o
20o
S 10o
S 0o
10oN
20oN
Phase 5
0o 60oE 120oE 180oE 120oW 60oW 0o
20o
S 10o
S 0o
10oN
20oN
Phase 6
0o
60o
E 120o
E 180o
E 120o
W 60o
W 0o
20o
S 10o
S 0o
10oN
20oN
Phase 7
0o
60o
E 120o
E 180o
E 120o
W 60o
W 0o
20oS
10o
S 0o
10oN
20oN
Phase 8
Figure 3.2: Composites of band-filtered (20−90 days) OLR anomalies for each phase
of the MJO for the austral summer, based on 30-year period (1981−2010). Dark (light)
shading denotes negative (positive) anomalies that are statistically significant at the 5%
3.2
Methods
To evaluate the MJO impact on precipitation over NEB, firstly daily anomalies for all datasets were calculated by removing the 30-year daily climatology. Intraseasonal anoma-lies were obtained by bandpass-filtering the time series of daily anomaanoma-lies (1 January–31
December, 1981−2010) on frequency domain (20−90 days) by applying Fast Fourier
Transform (FFT).
Precipitation composites were then obtained by averaging the intraseasonal
anoma-lies at each station over days that fell in each MJO phase (1−8) and also days with
no MJO activity (phase 0), and separately for each season [December–January–February (DJF), March–April–May (MAM), June–July–August (JJA), and September–October– November (SON)]. Composites indicated as "daily anomalies" correspond to an average of the anomaly at the stations over the contemporaneous (that is, with zero lag) days that fell in each MJO phase during that season.
Chapter 4
Precipitation distribution over NEB
As discussed in the Introduction, NEB characterizes by highly spatiotemporal precip-itation variability. To further illustrate this point, this chapter focuses on NEB’s character-istics of precipitation distribution, reviewing some factors that influence the precipitation regimes over the region.
4.1
Annual and seasonal precipitation climatology
Figure 4.1 illustrates the mean annual total rainfall for each station and topography of NEB. The largest rainfall amounts are found over the NEB’s eastern coast, about 2000 mm or more annually (Fig. 4.1a), followed by the low-lying areas of the northern MA, PI and CE states, and over elevated terrains located at northwest portions of the CE (mean
altitudes ranging from 800−900 m), where precipitation varies between 1200−2000
mm/year. Precipitation decreases inland, with the driest areas located in the interior NEB,
where most stations receive between 400−800 mm/year. The highest elevations are
(a) Precipitation
48oW 46oW 44oW 42oW 40oW 38oW 36oW 34oW
20oS
15oS
10oS
5oS
0o
(2000 to 2270] (1600 to 2000] (1200 to 1600] ( 800 to 1200] [ 440 to 800]
(b) Topography
48oW 46oW 44oW 42oW 40oW 38oW 36oW 34oW 20oS
15oS 10oS 5oS 0o
MA PI
CE
RN
PB
PE
AL
SE
BA
Figure 4.1: (a) Distribution of the 492 raingauge stations used in this study (circles). Colors represent the mean annual total station precipitation (mm) in each station from 1
January – 31 December, 1981−2010. (b) Topography (m), 1 arc-minute spatial resolution
(Amante and Eakins, 2009), provided by the NOAA (www.ngdc.noaa.gov/mgg).
Acronyms represent the name of the states: MA (Maranhão), PI (Piauí), CE (Ceará), RN (Rio Grande do Norte), PB (Paraíba), PE (Pernambuco), AL (Alagoas), SE (Sergipe), and BA (Bahia).
The seasonal distribution of precipitation over NEB is illustrated in Figure 4.2 as a percentage of the mean annual total. During the austral summer (DJF; Fig. 4.2a), most
of the region receives about 30−50% of precipitation, with the largest percentages found
over western BA, while eastern coastal areas receive less than 20% of the annual total. The austral fall (MAM; Fig. 4.2b) is overall the NEB’s rainiest season. In this season,
rainfall spreads toward the eastern coast (about 30−50%), and increases over northern
areas, which receive more than 40% of the annual total. The largest amounts are observed
over CE and RN states, where some stations receive about 60−70% of the annual
rain-fall. During the austral winter (JJA; Fig. 4.2c), a transition occurs to a dry period with percentages below 10% throughout the region, except for eastern coastal areas receiving
about 30−50%. During the austral spring (SON; Fig. 4.2d), most of the region is
pre-dominantly dry. The majority of stations receive less than 20% of the mean annual total.
21
(a) DJF
48o
W 46o
W 44o
W 42o
W 40o
W 38o
W 36o
W 34o
W 20o S 15o S 10o S 5o S 0o
(60 to 70] (50 to 60] (40 to 50] (30 to 40] (20 to 30] (10 to 20] [ 0 to 10]
(b) MAM
48o
W 46o
W 44o
W 42o
W 40o
W 38o
W 36o
W 34o
W 20o S 15o S 10o S 5o S 0o
(60 to 70] (50 to 60] (40 to 50] (30 to 40] (20 to 30] (10 to 20] [ 0 to 10]
(c) JJA
48o
W 46o
W 44o
W 42o
W 40o
W 38o
W 36o
W 34o
W 20o S 15o S 10o S 5o S 0o
(60 to 70] (50 to 60] (40 to 50] (30 to 40] (20 to 30] (10 to 20] [ 0 to 10]
(d) SON
48o
W 46o
W 44o
W 42o
W 40o
W 38o
W 36o
W 34o
W 20o S 15o S 10o S 5o S 0o
(60 to 70] (50 to 60] (40 to 50] (30 to 40] (20 to 30] (10 to 20] [ 0 to 10]
4.2
Factors influencing precipitation regimes
The spatial and seasonal variation of precipitation shown in Figure 4.2 are consistent with previous studies that used a smaller number of stations and shorter periods or differ-ent 30-year climatology (e.g., Namias, 1972; Kousky and Chu, 1978; Kousky, 1979; Rao et al., 1993; Liebmann et al., 2010), and suggest a variety of factors influencing precipi-tation regimes over the region.
Among these climatic factors is the South American Monsoon System (SAMS). The monsoon system develops during the austral spring, reaching its peak in the summer and retreating by the fall (Vera et al., 2006), and is characterized by pronounced seasonal variation in precipitation and circulation anomalies that affect large areas of tropical South America (including NEB). Among the SAMS characteristics are the enhancement of the cross-equatorial northerly/northwesterly low-level flow over the Amazon basin and the intensification of low-level winds along the eastern side of the tropical and subtropical Andes, known as South American Low-Level jet (e.g. Vera et al., 2006; Liebmann and Mechoso, 2011).
A distinctive aspect of the SAMS is its upper-level circulation over the continent, characterized by an anticyclone over the Altiplano Plateau (known as the Bolivian High) and a trough over the tropical and subtropical South Atlantic, near the east cost of NEB (e.g., Zhou and Lau, 1998; Marengo et al., 2012). Another important component of SAMS is the SACZ, which is characterized by a northwest-southeast oriented zone of enhanced convective activity emanating from the Amazon basin toward southeast Brazil, extending into the adjacent subtropical South Atlantic Ocean.
23
or southward displacement of the SACZ, westward displacement of the Bolivian High, upper-level cyclonic vortex close or over the continent, intensification of the southeast trades, and low-level flow from the Amazon toward southeastern Brazil.
Frontal systems also affect NEB’s rainfall distribution. Kousky (1979) showed that northward-propagating frontal systems (or their remnants) in the southern hemisphere in-fluence precipitation during the summer over southern NEB (BA), as this area experiences its maximum monthly rainfall in December-January. These systems also help increasing rainfall over eastern NEB (along the coast, from BA to RN) during the fall and winter months. At times, they can affect rainfall as far north as northern NEB (Kousky, 1979).
As the ITCZ migrates south of the equator in December, the broad band of its strong convective activity begins influencing convection and rainfall over northern areas of trop-ical South America. Maximum precipitation observed in northern areas of NEB (see Fig. 4.2b) is usually attributed to the migration of the ITCZ reaching its southernmost position during March-April (e.g., Hastenrath and Heller, 1977; Hastenrath and Greis-char, 1993; Uvo et al., 1998; Silva et al., 2006). Souza et al. (2005) and Souza and Am-brizzi (2006) found evidence of an association between intensified intraseasonal rainfall over eastern Amazon/NEB and deep convection triggered by the simultaneous occurrence of the SACZ (or persistent frontal systems over NEB), ITCZ and the convective envelope of the MJO during the summer/fall seasons.
During the fall and winter, precipitation over NEB is also modulated by easterly wave disturbances that cross the south-equatorial Atlantic from the West Africa to the South America. When these disturbances propagate toward the eastern NEB they can generate large rainfall amounts specially over the eastern coastal areas (e.g. Gomes et al., 2015; Hounsou-gbo et al., 2015; Kouadio et al., 2012).
Rao et al. (1993) found that the seasonal variation of the intensity and position of the subtropical high in the South Atlantic Ocean modulates coastal winds during the fall and winter. They argued that the maximum rainfall occurring over the eastern NEB during these seasons is associated with southeasterly winds blowing perpendicularly to the coast. Kousky (1980) argued that the sea breeze circulation is another factor influencing precipitation over the region. He observed that the development and inland advance of the sea breeze was associated with a daytime maximum rainfall over areas approximately
100−300 km inland. He suggested that the inland penetration of the marine air in the
Topography also affects rainfall distribution over NEB (Kousky, 1980; Silva et al., 2006). For instance, Kousky (1980) observed that the Rio São Francisco valley (located in interior BA, Fig. 4.1b) experienced nocturnal maximum rainfall while the nearby higher terrain areas (São Francisco Western Plateau) experienced nocturnal minimum. The au-thor suggested that the maximum rainfall over the valley was produced by the convergence of downslope winds from nearby elevated terrain, which would also account for the min-imum rainfall over this area. Conversely, the diurnal minmin-imum found in the Rio São Francisco valley was probably due to the low-level divergence and sinking motion com-pensating for the rising motion over the slopes of the nearby plateau, which experienced a diurnal maximum. Silva et al. (2006) analyzed the complexity and predictability of daily precipitation over semiarid CE state. Their results showed that the highest precipitation totals occurred in the highest elevations located over the northwest CE (General Moun-tain Ridge), the southeast CE (Araripe Plateau) and also near the coast (Baturité Massive) [see Fig. 4.1b]. They conclude that the seasonal pattern of precipitation is very complex and results from the combination of multi-scale processes and interaction with topogra-phy. In addition to these factors, NEB also exhibits pronounced interannual precipitation variability, which has been associated with ENSO phases and respective changes in the Walker circulation, and the meridional displacements of the ITCZ.
Chapter 5
Impacts of the MJO on intraseasonal
precipitation over NEB
In this chapter some characteristics of the MJO are presented, then impacts of the MJO on rainfall over NEB are investigated.
5.1
Characteristics of the MJO
A total of 132 events were identified during the 30-year period using the Jones– Carvalho MJO index. Approximately 58% of all days analyzed here were associated with the MJO activity: 1798 days in austral summer, 1762 in austral fall, 1465 in aus-tral winter and 1312 days in ausaus-tral spring. The MJO events showed mean duration of 48 days, standard deviation of about 13 days, and minimum and maximum duration of 30 and 84 days, respectively. Quiescent periods had mean duration of 63 days, standard deviation of 58 days, minimum of 2 and maximum of 301 days.
Previous studies showed that an important characteristic of the MJO is its interannual variability (e.g. Madden and Julian, 1994; Zhang, 2005). Indeed, the characteristics of the MJO events varied throughout the period of study. Two examples of the temporal behaviour of the MJO are presented in Figures 5.1 and 5.2.
Figure 5.1 illustrates the phase evolution during a 1825-day record corresponding to
the period of 1 January 2001−31 December 2005. Note that sometimes the oscillation
appears as isolated events (day 1−66), as a series of successive events (day 83−371),
or as sequences of events separated by a few days (day 468−752) as well. As the MJO
slowly propagates eastward, at times, an event can stay in the same phase for several days,
or even retrograde to previous phases as occurred with the event on day 83−141. Similar
behaviour of the MJO has been observed before (e.g. Jones and Carvalho, 2011a; Jones
time (days)
MJO
p
h
a
se
1
100 200 300 400 500 600 700 800 900
1000 1100 1200 1300 1400 1500 1600 1700 1800
0
1
2
3
4
5
6
7
8
Figure 5.1: Time series of the daily MJO phase from 1 January 2001−31 December
2005.
In Figure 5.2, the temporal distribution of the MJO activity (in number of days per season) is presented for the 30-year period. Note that, besides the year to year variation, the MJO activity also exhibits large seasonal variability. Only two years (1983 and 1984) experienced consecutive seasons with no MJO activity. In 1983, most of the summer days were characterized by MJO activity, followed by reduced activity during fall and no activ-ity during the winter and spring. In 1984, the MJO activactiv-ity occurred in approximately half of the summer and spring days, while fall and winter presented no activity. In summary, four years (1985, 1990, 1992 and 2010) experienced no convective activity related to the MJO during winter, four years during spring (1988, 1989, 1998 and 2004) and only one year during summer (1996).
To compare the MJO variability with the ENSO phases, Figure 5.3 shows the seasonal evolution of the ENSO for the same period. The SST anomalies used here were based on the Oceanic Niño Index (ONI) provided by the NOAA’s National Centers for
Environmen-tal Prediction (NCEP) Climate Prediction Center (CPC,www.cpc.ncep.noaa.gov).
When comparing the time series of both Figures 5.2 and 5.3, it is evident that no clear relationship between the two phenomena emerges.
27
81 82 83 84 85 86 87 88 89 90 91 92 93 94 95 96 97 98 99 00 01 02 03 04 05 06 07 08 09 10
d u ra ti o n (d a ys) 0 20 40 60 80
DJF MAM JJA SON
Figure 5.2: Temporal distribution of the MJO activity (number of days) for the 1981−
2010 period.
81 82 83 84 85 86 87 88 89 90 91 92 93 94 95 96 97 98 99 00 01 02 03 04 05 06 07 08 09 10
SST a n o ma ly (C ) -2 -1 0 1
2 DJF MAM JJA SON
Figure 5.3: Temporal distribution of the SST anomalies (◦C) for the 1981−2010 period
based on the Oceanic Niño Index (ONI) provided by the CPC/NCEP/NOAA.
Schemm (2004) also found no statistical significant differences in the frequency of the MJO events occurrence during El Niño and La Niña phases.
As for the relation between intraseasonal precipitation variability over NEB and ENSO phases, Souza et al. (2005) performed EOF analysis on precipitation and atmospheric cir-culation anomalies to determine the dominant patterns of the precipitation regime over the region on intraseasonal and submonthy timescales during the fall rainy season for the
1983−2000 period. They showed that strong oscillations occurred in the principal
com-ponent time series of precipitation anomalies for both scales during the entire period. As mentioned earlier, they emphasized that significant abundant and deficient precipitation events occurred alternately, even during those years characterized by extreme climactic conditions in the tropical Pacific and Atlantic Oceans (see their Fig. 7).
5.2
A small scale study area
occu-pying an area of around 800,000 Km2 and covering approximately 11% of the national
territory, as illustrated in Figure 5.4.
To examine whether the MJO effect could be detected at the local station level, a microregion known as Seridó, located in the semiarid interior of the Rio Grande do Norte state was initially chosen. According to the Brazilian Ministry of Agrarian Development
[Ministério do Desenvolvimento Agrário (MDA), www.mda.gov.br], the Seridó/RN
is divided into 25 municipalities. This microregion covers an area of 10,954.50 Km
2
(about 20.45% of the RN) and has a population around 295,700 inhabitants.
Among the most dry areas in NEB, the Seridó/RN has been recognized by the United
Nations Convention to Combat Desertification (UNCCD, www.unccd.int) as
partic-ularly vulnerable to desertification (see Fig. 5.4 for location). This is due not only to its climatic conditions, but also to the human activities associated with inappropriate land management in the microregion (MMA, 2004). Land use patterns and practices in the Seridó have increased land degradation, associated with deforestation of the Caatinga to create fields and pastures, and to supply the demand of fuel-wood for households, and for the production of wood charcoal for industries (e.g., ceramic, gypsum, plaster, limekilns). Salinization of soils and local water resources is another important factor of environmen-tal degradation over the area (MMA, 2004).
For this initial investigation, a sub-set of 17 stations located in the Seridó/RN was selected, following the geographical division of the Brazilian Institute of Geography and
Statistics [Instituto Brasileiro de Geografia e Estatística (IBGE),www.ibge.gov.br],
as shown in Figure 5.4. The station details are presented in Table 5.1. The analysis focused on February-May (FMAM), which is the microregion’s main rainy season,
cor-responding between 70−78% of the mean annual total. The MJO signal on rainfall at
each station was computed for the eight phases of the MJO, following the methodology described in Chapter 3, except that it included February in the calculations. Statistical significance was assessed by using a local t-test at the 5% significance level. The main results are summarized as follows.
29
2°S
4°S
6°S
8°S
10°S
12°S
14°S
16°S
18°S
20°S
48°W 46°W 44°W 42°W 40°W 38°W 36°W 34°W
48°W 46°W 44°W 42°W 40°W 38°W 36°W 34°W
Table 5.1: Rainguage station details for the Seridó microregion. Code refers to the sta-tion code in Figure 5.7. Annual total rainfall is based on 30-year period from January–
December, 1981−2010. FMAM (February-May) corresponds to the rainy season mean
total (in parentheses as a percentage of the annual total). Units are in mm for rainfall and m for altitude.
Station name Code Location Altitude Annual total rainfall FMAM (%)
Acari Aca 6.43◦S, 36.63◦W 270 546 404 (74)
Caicó Cai 6.45◦S, 37.08◦W 143 660 515 (78)
Carnaúba dos Dantas CDa 6.55◦S, 36.58◦W 460 574 427 (74)
Cruzeta Cru 6.40◦S, 36.78◦W 140 623 445 (71)
Currais Novos CNo 6.25◦S, 36.52◦W 350 537 399 (74)
Equador Equ 6.93◦S, 36.72◦W 500 488 344 (70)
Ipueira Ipu 6.80◦S, 37.18◦W 217 645 495 (77)
Jardim de Piranhas JPi 6.37◦S, 37.35◦W 130 664 514 (77)
Jardim do Seridó JSe 6.58◦S, 36.77◦W 218 607 456 (75)
Ouro Branco OBr 6.70◦S, 36.93◦W 195 599 461 (77)
Parelhas Par 6.68◦S, 36.65◦W 325 571 436 (76)
Santana do Seridó SSe 6.77◦S, 36.73◦W 336 577 430 (75)
São João do Sabugi SJSa 6.72◦S, 37.20◦W 187 680 529 (78)
São Fernando SFe 6.37◦S, 37.18◦W 139 663 503 (76)
São José do Seridó SJSe 6.43◦S, 36.87◦W 207 605 449 (74)
Serra Negra do Norte SNN 6.65◦S, 37.38◦W 180 799 605 (76)
Timbaúba dos Batistas TBa 6.45◦S, 37.27◦W 161 705 551 (78)
using all daily data from 1981 to 2010, with shading to denote anomalies. Note the characteristic spells and breaks that appear in both years.
For example, during February 2000 there were notable spells, followed by mostly dry conditions in the first two weeks of March, and again followed by several peaks of rainfall separated by breaks through most of April. In examining the example of the time series of the MJO index presented in Section 3.1.3 for the same period, note that it coincides with the occurrence of a MJO event. During 2001 a similar behaviour occurred, but with the wet spells of lower magnitudes.
Besides the intraseasonal variability, the microregion shows both marked interannual
and large spatial variability (with mean annual totals ranging between 480−800 mm/year,
31
Figure 5.5: Time series of 3-day running-mean rainfall for four stations in the Seridó/RN for the period of 1 January – 31 December, 2000. Also shown are smoothed climatological
annual cycles for each station, computed using all daily data from 1981−2010. Positive
33
MJO cycle in rainfall over the Seridó/RN
For the sake of simplicity, the stations were grouped into western Seridó and eastern Seridó (according to IBGE’s division). The eastern Seridó area corresponding to the highlands on the western border of the Borborema Plateau (see Fig. 4.1b), with its highest point (807 m) located in the Serra das Queimadas, in the Equador municipality. The topography decreases to the west, where the depressions of the rivers Seridó and
Piranhas-Açu are located, with altitudes ranging between 50−200 m.
The MJO "events" consisted of the separated blocks of days identified in each MJO
phase during the FMAM 1981−2010 period. For instance, for the MJO phase 2, there
were 50 events (24−28 March 1981, 8−11 May 1981,. . ., 18−20 March 2010, 4−6
May 2010). The population of events varied between 49 (phase 1) and 55 (phase 6) events. Figure 5.7 illustrates the composite MJO rainfall signals for each station. If the rain-fall anomaly at a particular station was statistically significant at the 5% significance level,
during a particular MJO phase, a larger symbol was plotted on that phase. In phases 1−3,
the majority of stations showed enhanced rainfall. Maximum positive anomalies occurred in phase 2, where 13 out of the 17 stations showed statistically significant anomalies
(be-tween 0.9−1.9 mm/day). Significant positive anomalies were also found at 7 stations in
phase 3 (between 1.1−1.7 mm/day). During phases 5−6 all stations showed suppressed
rainfall. Minimum statistically significant anomalies occurred at 12 stations in phase 5
(between 0.8−1.7 mm/day), and 10 stations in phase 6 (between 0.9−1.8 mm/day).
Comparatively, stations located in the western Seridó showed the absolute magnitude of rainfall anomalies slightly greater than those in the eastern Seridó. Three stations did not show any statistically significant rainfall anomalies: Equador, Jardim de Piranhas and Santana do Seridó. Possibly, this may be related to raingauge exposure and local microm-eteorological conditions, since raingauge measurements are influenced by factors such as instrument placement, and the topographic (ridge top, valley, etc.) and environmental (urban, suburban, rural, etc.) settings.
The results showed that the stations exhibited a very similar anomaly pattern. Note that there was a clear MJO signal in all the individual stations throughout the MJO cycle. The rainfall increased by about 30% in phase 2 and decreased by about 25% in phase 5 relative to the climatological mean for the whole Seridó. Combining the MJO signals
for wet phases 2−3 and dry phases 5−6, the difference represented about 50−150%
modulation of the mean rainfall considering all stations. The manuscript with these
pre-liminary results was published by the journalAtmospheric and Climate Sciences (ACS)
1 2 3 4 5 6 7 8
−2
−1
0
1
2
MJO phase
rainf
all anomaly (mm/da
y)
●
● ●
●
● ●
● ●
●
Station
Cai Ipu JPi SFe SJSa SNN TBa
1 2 3 4 5 6 7 8
−2
−1
0
1
2
MJO phase
rainf
all anomaly (mm/da
y)
●
●
●
●
● ●
● ●
●
Station
Aca CDa CNo Cru Equ JSe OBr Par SSe SJSe
Figure 5.7: MJO cycle of rainfall anomaly (mm/day) for 17 stations in the Seridó/RN
dur-ing February–May, 1981−2010: (top panel) western Seridó area; (bottom panel) eastern
35
5.3
Extent of the MJO influence on precipitation
Motivated by the previous results found for a small-scale area, this study further ex-plores the MJO’s modulation of precipitation over the entire NEB. To provide a com-prehensive overview of the MJO role in modulating the intraseasonal precipitation over NEB, precipitation anomalies at each station were averaged during the austral summer, fall, winter and spring seasons for all phases of the MJO. For each MJO phase composite, each separate block of days that fell in that phase corresponded to an independent "event". The population of events for each season and MJO phase is given in Table 5.2, which
var-ied between 26−37 events in summer, 25−44 events in fall, 22−37 events in winter and
22−30 events in spring.
Table 5.2: Seasonal distribution of MJO events as function of the MJO phases for the
30-year period (January–December, 1981−2010). Phase "0" represents quiescent days
(MJO inactive).
MJO phase Summer (DJF) Fall (MAM) Winter (JJA) Spring (SON)
0 26 25 22 22
1 34 44 23 27
2 36 42 28 28
3 36 41 32 26
4 36 38 37 28
5 36 40 33 30
6 37 41 32 29
7 36 41 26 25
8 31 39 23 23
Summer (DJF)
As illustrated in Figure 5.8a, periods during inactive MJO in summer exhibited es-sentially no statistically significant precipitation anomalies over NEB. This was also the case for all other seasons, which showed quite weak and negligible signals during phase 0 (Figs. 5.9a–5.11a). However, strong signals of the MJO on precipitation were found throughout the summer (Figs. 5.8b–i).
During phase 1, enhanced precipitation occurred over the entire region as indicated by
the large number of significant positive anomalies ranging from 2−4 mm/day in the
ma-jority of stations (Fig. 5.8b). Near the coast of RN, where summer precipitation accounts
for only 10−20% of the annual precipitation (see Fig. 4.2a in Chapter 4), some stations
During phase 2, the precipitation pattern was similar to that in phase 1 (Fig. 5.8c). The most significant changes were the weakening of positive anomalies over BA and eastern RN.
Phase 3 showed a transition from wet to dry conditions with negative precipitation anomalies over western BA (Fig. 5.8d).
Then, from phases 4−7 (Figs. 5.8e–h), the entire region showed suppressed
precipita-tion; particularly during phases 5−6 (Figs. 5.8f–g), the great majority of stations (around
90%) exhibited statistically significant negative anomalies (between 2−4 mm/day, about
40−70% of the mean daily rainfall), with the largest amounts located over areas where
the summer season accounts for about 40−50% of the annual mean (see Fig. 4.2a in
Chapter 4).
37
(a) MJO Inactive
48o W 46o
W 44o W 42o
W 40o W 38o
W 36o W 34o
W 20oS
15oS 10oS 5oS 0o
( 3 to 4] ( 2 to 3] ( 1 to 2] ( 0 to 1] (-1 to 0] (-2 to -1] (-3 to -2] [-4 to -3]
(b) Phase 1
48o W 46o
W 44o W 42o
W 40o W 38o
W 36o W 34o
W 20oS
15oS 10oS 5oS 0o
( 3 to 4] ( 2 to 3] ( 1 to 2] ( 0 to 1] (-1 to 0] (-2 to -1] (-3 to -2] [-4 to -3]
(c) Phase 2
48o W 46o
W 44o W 42o
W 40o W 38o
W 36o W 34o
W 20oS
15oS 10oS 5oS 0o
( 3 to 4] ( 2 to 3] ( 1 to 2] ( 0 to 1] (-1 to 0] (-2 to -1] (-3 to -2] [-4 to -3]
(d) Phase 3
48oW 46oW 44oW 42oW 40oW 38oW 36oW 34oW 20oS
15oS 10oS 5oS 0o
( 3 to 4] ( 2 to 3] ( 1 to 2] ( 0 to 1] (-1 to 0] (-2 to -1] (-3 to -2] [-4 to -3]
(e) Phase 4
48oW 46oW 44oW 42oW 40oW 38oW 36oW 34oW 20oS
15oS 10oS 5oS 0o
( 3 to 4] ( 2 to 3] ( 1 to 2] ( 0 to 1] (-1 to 0] (-2 to -1] (-3 to -2] [-4 to -3]
(f) Phase 5
48oW 46oW 44oW 42oW 40oW 38oW 36oW 34oW 20oS
15oS 10oS 5oS 0o
( 3 to 4] ( 2 to 3] ( 1 to 2] ( 0 to 1] (-1 to 0] (-2 to -1] (-3 to -2] [-4 to -3]
(g) Phase 6
48oW 46oW 44oW 42oW 40oW 38oW 36oW 34oW 20oS
15oS 10o
S 5oS 0o
( 3 to 4] ( 2 to 3] ( 1 to 2] ( 0 to 1] (-1 to 0] (-2 to -1] (-3 to -2] [-4 to -3]
(h) Phase 7
48oW 46oW 44oW 42oW 40oW 38oW 36oW 34oW 20oS
15oS 10o
S 5oS 0o
( 3 to 4] ( 2 to 3] ( 1 to 2] ( 0 to 1] (-1 to 0] (-2 to -1] (-3 to -2] [-4 to -3]
(i) Phase 8
48oW 46oW 44oW 42oW 40oW 38oW 36oW 34oW 20oS
15oS 10o
S 5oS 0o
( 3 to 4] ( 2 to 3] ( 1 to 2] ( 0 to 1] (-1 to 0] (-2 to -1] (-3 to -2] [-4 to -3]