ACPD
13, 25567–25615, 2013Impacts of fire emissions and transport pathways
L. Huang et al.
Title Page
Abstract Introduction
Conclusions References
Tables Figures
◭ ◮
◭ ◮
Back Close
Full Screen / Esc
Printer-friendly Version Interactive Discussion
Discussion
P
a
per
|
D
iscussion
P
a
per
|
Discussion
P
a
per
|
Discuss
ion
P
a
per
Atmos. Chem. Phys. Discuss., 13, 25567–25615, 2013 www.atmos-chem-phys-discuss.net/13/25567/2013/ doi:10.5194/acpd-13-25567-2013
© Author(s) 2013. CC Attribution 3.0 License.
Atmospheric Chemistry and Physics
Open Access
Discussions
This discussion paper is/has been under review for the journal Atmospheric Chemistry and Physics (ACP). Please refer to the corresponding final paper in ACP if available.
Impacts of fire emissions and transport
pathways on the interannual variation of
CO in the tropical upper troposphere
L. Huang1,2, R. Fu1, and J. H. Jiang2
1
Jackson School of Geosciences, The University of Texas at Austin, Austin, TX, USA 2
Jet Propulsion Laboratory, California Institute of Technology, Pasadena, CA, USA
Received: 30 August 2013 – Accepted: 11 September 2013 – Published: 7 October 2013
Correspondence to: L. Huang ([email protected])
ACPD
13, 25567–25615, 2013Impacts of fire emissions and transport pathways
L. Huang et al.
Title Page
Abstract Introduction
Conclusions References
Tables Figures
◭ ◮
◭ ◮
Back Close
Full Screen / Esc
Printer-friendly Version Interactive Discussion
Discussion
P
a
per
|
D
iscussion
P
a
per
|
Discussion
P
a
per
|
Discuss
ion
P
a
per
|
Abstract
Carbon monoxide (CO) is an important tracer to study the transport of fire-generated pollutants from the surface to the upper troposphere (UT). This study analyzed the rel-ative importance of fire emission, convection and climate conditions on the interannual variation of CO in the tropical UT, by using satellite observations, reanalysis data and
5
transport pathway auto-identification method developed in our previous study. Empir-ical orthogonal function (EOF) and singular value decomposition (SVD) methods are used to identify the dominant modes of CO interannual variation in the tropical UT and factors that are related to these modes. Results show that the leading EOF mode is dominated by CO anomalies over Indonesia related to El Niño-Southern Oscillation
10
(ENSO). This is consistent with previous findings by directly evaluating CO anomaly field. Transport pathway analysis suggests that the differences of UT CO between dif-ferent ENSO types over the tropical continents are mainly dominated by the “local con-vection” pathway, especially the average CO transported by this pathway. The relative frequency of the “advection within the lower troposphere (LT) followed by convective
15
vertical transport” pathway appears to be responsible only for the UT CO differences over the west-central Pacific between El Niño and La Niña years.
1 Introduction
Carbon monoxide (CO), which is a byproduct of the incomplete combustion of carbon-based fuels, plays an important role in atmospheric chemistry and radiation balance.
20
CO is one of the ozone (O3) precursors (Daniel and Solomon, 1998) and is also the
pri-mary sink of the hydroxyl radical (OH) (Thompson, 1992). With a lifetime of 1–2 months in the troposphere, CO is an excellent tracer to study the mass transport of polluted air originating in regions of biomass burning or fossil fuel combustion (Edwards et al., 2006a). Thus, understanding the factors that control CO temporal and spatial variations
ACPD
13, 25567–25615, 2013Impacts of fire emissions and transport pathways
L. Huang et al.
Title Page
Abstract Introduction
Conclusions References
Tables Figures
◭ ◮
◭ ◮
Back Close
Full Screen / Esc
Printer-friendly Version Interactive Discussion
Discussion
P
a
per
|
D
iscussion
P
a
per
|
Discussion
P
a
per
|
Discuss
ion
P
a
per
is important to improve numerical model simulations and predictions of tropospheric ozone change and fire-generated pollutant transport.
Besides strong seasonal variations as shown by previous studies (Novelli et al., 1998; Schoeberl et al., 2006; Liu et al., 2007, 2010; Huang et al., 2012), CO has also been shown to have large interannual variability in the troposphere (Wotawa et al.,
5
2001; Edwards et al., 2006b; Duncan and Logan, 2008; Liu et al., 2013). Edwards et al. (2006b) found that the interannual variation (IAV) of tropospheric CO in the South-ern Hemisphere (SH) has a significant correlation with the El Niño-SouthSouth-ern Oscillation (ENSO) precipitation index. Duncan and Logan (2008) analyzed the factors that reg-ulate the trends and interannual variability of tropospheric CO for 1988–1997 through
10
a model study, and found the IAV of biomass burning, especially those major burning events in Indonesia associated with El Niño, is the main driver of large-scale CO vari-ability in the tropics. Strong IAV of CO in the upper troposphere (UT) is found to be mainly related to the intense drought-induced fires in Indonesia and South America (Liu et al., 2013; Livesey et al., 2013).
15
Recent studies (e.g., Ashok et al., 2007; Kao and Yu, 2009; Kug et al., 2009) have shown that the canonical El Niño (eastern Pacific warming) has become less frequent and a different kind of El Niño (central Pacific warming) has become more common during the late twentieth century. These two types of El Niño have distinctively different anomalous large-scale circulation and convection patterns (Yeh et al., 2009; Su and
20
Jiang, 2013), which would in turn have different impacts on CO transport to the UT. What are the differences between the impacts of different ENSO types on the IAV of tropical UT CO? The answer to this question may help to reconcile the discrepancies in previous studies about how ENSO would affect CO in the UT. For example, Chandra et al. (2009) attributed the change of UT CO to increased fires and meteorological
25
ACPD
13, 25567–25615, 2013Impacts of fire emissions and transport pathways
L. Huang et al.
Title Page
Abstract Introduction
Conclusions References
Tables Figures
◭ ◮
◭ ◮
Back Close
Full Screen / Esc
Printer-friendly Version Interactive Discussion
Discussion
P
a
per
|
D
iscussion
P
a
per
|
Discussion
P
a
per
|
Discuss
ion
P
a
per
|
fires source regions also played an important role in the increase of UT CO during the 1997 El Niño.
Although fires in the tropical Africa and South America have important influence on the seasonal peaks of UT CO, how they would affect the IAV of UT CO has not been thoroughly investigated. Gonzi and Palmer (2010) suggested that the fractions of
sur-5
face CO emissions transported to the UT are lower over Africa and South America than that over the tropical Asia. However, Ricaud et al. (2007) found that deep convec-tion plays an important role in transporting CO to the UT over Africa, which suggests a change of emission and convection over this region could significantly influence UT CO. Thus, how changes of fire emissions over these two tropical continents contribute
10
to the interannual changes of CO in the UT needs to be clarified.
Interannual variations of atmospheric circulation can also influence CO transport pathways (e.g., Duncan et al., 2007; Liu et al., 2013). The relative importance between changes of surface emission and transport pathways on the interannual changes of UT CO and how such relative importance varies with, for example, different ENSO
15
types, is still an open question. Previous studies have shown that CO is transported from the surface to the UT through two pathways, i.e., the “local convection” pathway (Thompson et al., 1996; Pickering et al., 1996; Andreae et al., 2004), and the “lower troposphere (LT) advection→convection” pathway (Folkins et al., 1997; Andreae et al., 2001). The former refers to as that CO is transported from the surface to the UT by local
20
deep convection over fire regions, whereas the latter refers to as that CO is advected from a fire region to a convective region within the LT, and then be uplifted to the UT by deep convection. This “LT advection → convection” pathway may be responsible for the fact that UT CO centers are often located above convective regions rather than fire regions. Huang et al. (2012) developed a method to automate the identification
25
ACPD
13, 25567–25615, 2013Impacts of fire emissions and transport pathways
L. Huang et al.
Title Page
Abstract Introduction
Conclusions References
Tables Figures
◭ ◮
◭ ◮
Back Close
Full Screen / Esc
Printer-friendly Version Interactive Discussion
Discussion
P
a
per
|
D
iscussion
P
a
per
|
Discussion
P
a
per
|
Discuss
ion
P
a
per
This study aims to investigate the dominant modes of the CO interannual variation in the tropical UT and their links to modes of interannual climate variability, such as ENSO and tropical Atlantic variability in determining the interannual variations of UT CO. In addition, the impacts of different ENSO types on CO transport to the UT are also eval-uated. Section 2 of this paper introduces the data and methods used in this study.
5
Section 3 identifies the dominant modes of the interannual variation of UT CO and evaluates the relative importance of CO emission, convection and continental regions that affect UT CO interannual variation over the tropics. The impacts of sea surface temperature (SST), convection and CO emission on UT CO interannual variation are analyzed in Sect. 4. The circulation pattern changes and the transport pathway diff
er-10
ences associated with different ENSO types are investigated and discussed in Sect. 5. The main conclusions of this work are summarized and discussed in Sect. 6.
2 Data and methodology
2.1 Data
We use CO volume mixing ratio measurements from Aura Microwave Limb Sounder
15
(MLS) to determine the concentration of CO in the UT, use MLS cloud ice water content (IWC) and CloudSat cloud water content (CWC) data to determine the strength of deep convection, and use CO emission data from the Global Fire Emission Database (GFED) to determine biomass burning emitted CO at the surface.
The MLS instrument is a small radio telescope aboard the Aura satellite, which was
20
launched on 15 July 2004, and has a sun-synchronous orbit at an altitude of 705 km, with an equator crossing time at 1.45 a.m. and 1.45 p.m. local solar time and a 16-day repeat cycle. MLS observes many atmospheric components in the upper troposphere and lower stratosphere (UTLS) by measuring thermal emissions from broad spectral bands with a limb viewing geometry (Waters et al., 2006). MLS measurement has
25
ACPD
13, 25567–25615, 2013Impacts of fire emissions and transport pathways
L. Huang et al.
Title Page
Abstract Introduction
Conclusions References
Tables Figures
◭ ◮
◭ ◮
Back Close
Full Screen / Esc
Printer-friendly Version Interactive Discussion
Discussion
P
a
per
|
D
iscussion
P
a
per
|
Discussion
P
a
per
|
Discuss
ion
P
a
per
|
resolution of ∼7 km across-track and 300–400 km along-track. We use Level 2 CO and IWC data derived according to the MLS Version 3.3 (V3.3) retrieval algorithm and screen the data using procedures as recommended in Livesey et al. (2011). These include the use of MLS IWC as a filter to exclude cloud-contaminated profiles in CO data screening. The lowest usable retrieval level for CO and IWC is 215 hPa, where
5
the estimated single-measurement precisions are ∼20 ppbv for CO and ∼1 mg m−3 for IWC. The earlier version of MLS CO (V2.2) was biased high by a factor of ∼2 at 215 hPa (Livesey et al., 2008), but this bias has been largely eliminated in V3.3 CO data (Livesey et al., 2011). Only thick clouds which are typically associated with deep convective cores are observable by MLS (Wu et al., 2008), thus MLS IWC is used as
10
a proxy of deep convection in this study.
CloudSat was launched on 28 April 2006, which carries the first space-borne 94 GHz cloud profiling radar (CPR) to measure vertical profiles of cloud and precipitation prop-erties, with a vertical resolution of 500 m (Stephens et al., 2002). The CloudSat mea-surements are reported on an increment of 240 m, with totally 125 vertical layers. The
15
footprint of a single profile is approximately 1.7 km along-track by 1.3 km across-track, with an along-track sampling every 1.1 km (CloudSat Project, 2008). The CloudSat CWC is calculated as the sum of cloud ice water content and liquid water content ob-served by CloudSat. CWC is used as one of the proxies to estimate the relative strength of convective activity.
20
The emission of CO by fire activity at the surface is obtained from the Global Fire Emission Database version 3 (GFED3) (van der Werf et al., 2010), currently available from 1997 to 2011. This gridded data has 0.5◦
×0.5◦ spatial resolution and monthly temporal resolution, and includes both burned area and fire emissions. Emissions of fire-generated trace gases are derived by combining satellite information on burned
25
ACPD
13, 25567–25615, 2013Impacts of fire emissions and transport pathways
L. Huang et al.
Title Page
Abstract Introduction
Conclusions References
Tables Figures
◭ ◮
◭ ◮
Back Close
Full Screen / Esc
Printer-friendly Version Interactive Discussion
Discussion
P
a
per
|
D
iscussion
P
a
per
|
Discussion
P
a
per
|
Discuss
ion
P
a
per
(Giglio et al., 2006). The approach we used to derive daily emission of CO from GFED3 monthly emission is described in Mu et al. (2011).
Besides satellite observation data above, we also use monthly mean precipitation and SST data. The precipitation data is from the Global Precipitation Climatology Project (GPCP) (Adler et al., 2003), which is available from 1979 to 2011 and has
5
a horizontal resolution of 2.5◦×2.5◦. The SST data is obtained from the Optimum In-terpolation (OI) SST Version 2 (V2) analysis produced by the National Oceanic and Atmospheric Administration (NOAA) using both in situ and satellite data (Reynolds et al., 2002), available from 1981 to present. The spatial resolution of SST data is 1◦×1◦. In this paper, monthly anomaly of each variable is defined as the deviations
10
from the corresponding climatological monthly mean. The climate indices used in this paper are obtained from http://www.esrl.noaa.gov/psd/data/climateindices/list/ and http://www.jamstec.go.jp/frcgc/research/d1/iod/DATA/dmi_HadISST.txt.
To homogenize the horizontal resolutions of the MLS CO, IWC, SST and GFED CO emission, we averaged these data into 4◦ latitude×8◦ longitude grid boxes. The MLS
15
CO and IWC data were also averaged over each month to get the monthly mean.
2.2 Methodology
The Empirical Orthogonal Function (EOF) analysis has been widely used to extract in-dividual modes of variability from data with complex spatial/temporal structures, since the first introduction by Lorenz (1956). Rotated EOF (REOF) is a technique simply
20
based on rotating EOFs. It has been adopted by atmospheric scientists since the mid-80th (Richman, 1986) as an attempt to overcome some of the EOF shortcom-ings (e.g., domain dependence, difficulty of physical interpretability). To identify the dominant modes of the interannual variation of CO in the tropical UT (30◦S–30◦N),
we apply the REOF analysis to the monthly anomalies of MLS CO at 147 hPa, for the
25
ACPD
13, 25567–25615, 2013Impacts of fire emissions and transport pathways
L. Huang et al.
Title Page
Abstract Introduction
Conclusions References
Tables Figures
◭ ◮
◭ ◮
Back Close
Full Screen / Esc
Printer-friendly Version Interactive Discussion
Discussion
P
a
per
|
D
iscussion
P
a
per
|
Discussion
P
a
per
|
Discuss
ion
P
a
per
|
squared covariance of the two fields. SVD identifies the leading modes based on their fractions of the total squared covariance between two fields, typically referred to as the left and right field. The spatial pattern of a SVD mode projected on the left and right field, respectively, can be obtained from the homogeneous correlation map between one field and its own principle component of that SVD mode. The correlation between
5
these two fields for a SVD mode can be obtained from the heterogeneous correlation maps, for the left and right field, respectively. The heterogeneous correlation map for the left (right) field represents the correlation between the left (right) field and the prin-ciple component of the right (left) field. We also apply the SVD analysis to determine the field correlations between anomalies of UT CO and anomalies of convection and
10
CO emission, respectively. In this way, we can evaluate how IAVs of SST, convection and CO emission influence the IAV of CO in the tropical UT.
The relative importance of different climate conditions on the significant REOF and SVD modes of CO in the tropical UT is determined using correlation analysis. Since ENSO and some of the other climate indices are known to have strong autocorrelation,
15
it is important to estimate the influence of autocorrelation on the significance of the correlation coefficients. To address the autocorrelation issue, we use both Livezey and Chen (1983) and Bretherton et al. (1999)’s methods to calculate the effective degrees of freedom (DOFs) for a time series, and the results are the same for both methods. The circulation pattern changes associated with different ENSO types are analyzed
20
using composite analysis. The pathway auto-identification method developed in Huang et al. (2012) is used in this study to characterize the differences of CO transport be-tween El Niño and La Niña years. This method streamlines the identification of two CO transport pathways by combining instantaneous along-track observations of CO in the UT from the Aura MLS, convective clouds from the CloudSat radar, and CO emissions
25
ACPD
13, 25567–25615, 2013Impacts of fire emissions and transport pathways
L. Huang et al.
Title Page
Abstract Introduction
Conclusions References
Tables Figures
◭ ◮
◭ ◮
Back Close
Full Screen / Esc
Printer-friendly Version Interactive Discussion
Discussion
P
a
per
|
D
iscussion
P
a
per
|
Discussion
P
a
per
|
Discuss
ion
P
a
per
3 Regions affecting UT CO interannual variation
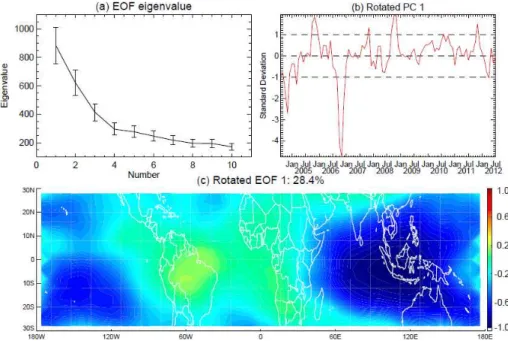
Figures 1–3 shows the results of REOF analysis for the monthly anomalies of tropi-cal UT CO at 147 hPa from August 2004 to July 2012. The first 10 EOF eigenvalues along with their uncertainties based on a “rule of thumb” (North et al., 1982) are shown in Fig. 1a. Only the first three eigenvalues are well separated from the rest, together
5
they account for 64.5 % of the total monthly UT CO variance. Individually, they explain 37.6 %, 18.6 % and 8.3 % of the total variance. The rotated EOF analysis was per-formed using an orthogonal method (varimax), keeping the first 10 EOFs. The spatial patterns associated with the first three rotated EOF modes are shown as homoge-neous correlation maps E1, E2 and E3 (Figs. 1–3c), while the temporal variations of
10
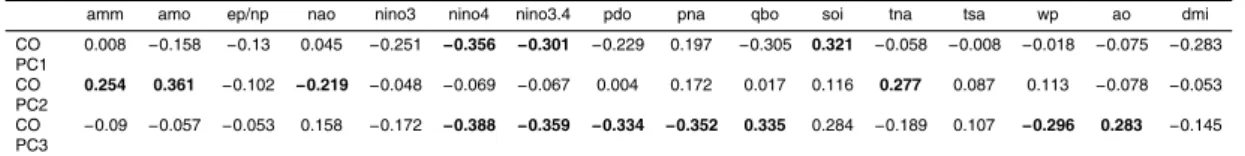
each eigenvector are represented by the rotated principal components PC1, PC2 and PC3 (Figs. 1–3b). The correlation coefficients between each PC and climate indices are listed in Table 1. E1 shows two high-correlation centers located over the tropical Indian Ocean, Indonesia and South Pacific. Since the square of the correlation repre-sents the variance explained locally, this mode accounts for up to 96 % of the variance
15
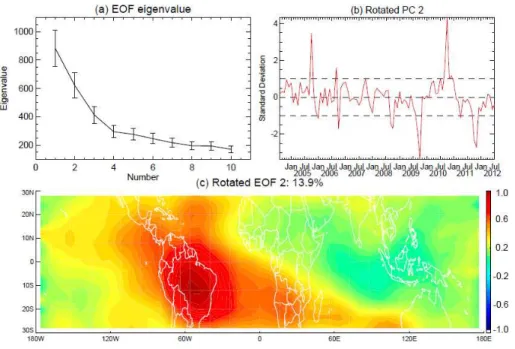
in the regions of largest amplitude. PC1 is significantly correlated (at 90 % confidence level, hereinafter) with the ENSO indices (e.g., Niño4, SOI, as shown in Table 1), after considering the effective DOFs associated with autocorrelation (hereinafter). This sug-gests that the first REOF mode of UT CO interannual variation is mainly dominated by ENSO. E2 shows a high-correlation center located over South America (Fig. 2c), which
20
explains up to 86 % of the variance over this region. PC2 is significantly correlated with the Atlantic Ocean indices (e.g., AMO, NAO). Thus, the second EOF mode probably represents the significant influence of the Atlantic Ocean. E3 shows a high-correlation center over West Africa and tropical Atlantic Ocean, with explanation of up to 86 % of the variance (Fig. 3c). PC3 is significantly correlated with multiple climate indices
25
condi-ACPD
13, 25567–25615, 2013Impacts of fire emissions and transport pathways
L. Huang et al.
Title Page
Abstract Introduction
Conclusions References
Tables Figures
◭ ◮
◭ ◮
Back Close
Full Screen / Esc
Printer-friendly Version Interactive Discussion
Discussion
P
a
per
|
D
iscussion
P
a
per
|
Discussion
P
a
per
|
Discuss
ion
P
a
per
|
tions. The changes of UT CO over tropical Asia have the largest contribution, whereas those over South America and Africa have a secondary but still significant contribution. Among all the climate conditions, ENSO has the largest impact.
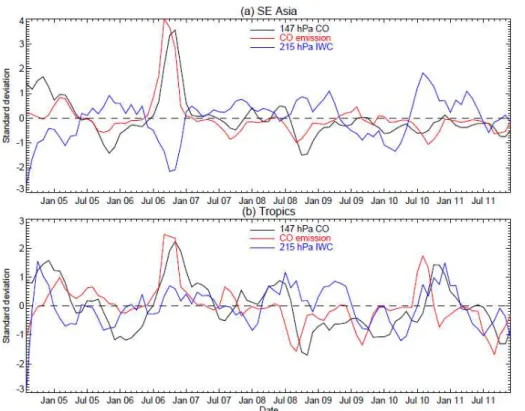
To further evaluate the relative importance of emission and convection on the UT CO interannual variation, we analyzed the time series of monthly anomalies of GFED CO
5
emissions, MLS CO at 147 hPa and IWC at 215 hPa over South America (15◦S–12◦N, 85◦W–32◦W), Central Africa (15◦S–15◦N, 20◦W–50◦E), SE Asia (10◦S–15◦N, 90◦E– 160◦E) and the Tropics (15◦S–15◦N, 180◦W–180◦E). Here 215 hPa IWC is used as a proxy of deep convection (Jiang et al., 2007, 2011). Over the Tropics (Fig. 5b), UT CO anomaly is significantly correlated with CO emission anomaly, and the largest
correla-10
tion coefficient occurs at 2-month time lag (r =0.64). The correlation with IWC anomaly is relatively weak at zero time lag (r =0.31). However, during some period (e.g., Octo-ber 2010–January 2011), there is overlap between peaks of UT CO anomaly and IWC anomaly. This suggests that while surface CO emission controls most of the UT CO anomalies, sometimes convective transport is also important. To evaluate the IAV of
15
UT CO in different subregions, we also examined the three tropical continents. Over South America (Fig. 4a), UT CO anomaly is significantly correlated with CO emission anomaly, and the correlation coefficient is largest at 2-month time lag (r=0.72). The IWC anomaly has a weak correlation (r =0.25) with UT CO anomaly at zero time lag. This is similar to the Tropics, suggesting that the IAV of UT CO over this region mainly
20
follows the changes of surface CO emission, which is consistent with previous studies (Liu et al., 2010). Over Central Africa (Fig. 4b), UT CO anomaly is only significantly correlated with IWC anomaly (r =0.39), not with CO emission. Thus, the IAV of UT CO over this region is mainly influenced by changes of convective transport, instead of CO emission anomaly. Over SE Asia (Fig. 5a), both CO emission and IWC anomalies are
25
ACPD
13, 25567–25615, 2013Impacts of fire emissions and transport pathways
L. Huang et al.
Title Page
Abstract Introduction
Conclusions References
Tables Figures
◭ ◮
◭ ◮
Back Close
Full Screen / Esc
Printer-friendly Version Interactive Discussion
Discussion
P
a
per
|
D
iscussion
P
a
per
|
Discussion
P
a
per
|
Discuss
ion
P
a
per
4 Impacts of SST, convection and CO emission on UT CO interannual variation
We use SVD method to study the field relationships between UT CO anomaly and the anomalies of SST, convection and CO emission during the period August 2004– December 2011. In contrast to the individual EOF analysis performed on the UT CO (Sect. 3), the SVD analysis on two combined fields will identify only these modes of
5
behavior in which the two fields are strongly coupled.
The first three SVD modes between 147 hPa CO anomaly and SST anomaly ac-count for 64.9 %, 16.3 % and 10.1 % of the total squared covariance, respectively. The covariance explained by the rest modes is much smaller compared to the first three modes; thus we only discuss these three modes here. Figure 6a shows the two PC
10
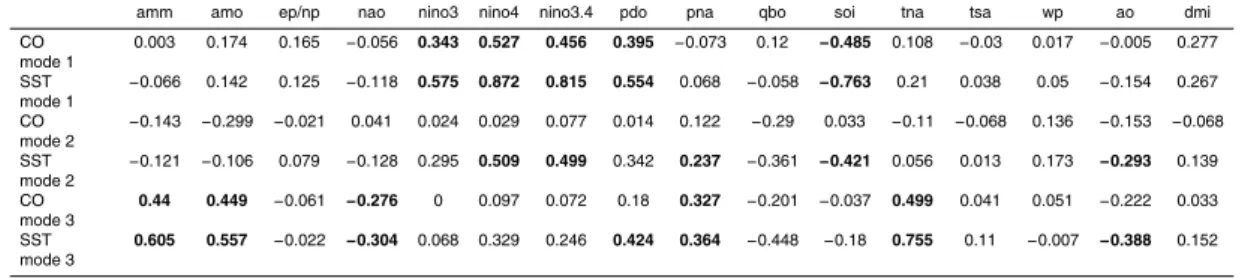
time series of the first SVD mode of 147 hPa CO and SST. The correlation coefficient between the two PCs is 0.65, which is an indicator of the coupling strength. The cor-relation coefficients between each PC and climate indices are listed in Table 2. Both PCs have significant correlation with ENSO indices (Niño 3, Niño 4, Niño 3.4 and SOI) and Pacific Decadal Oscillation (PDO) index. However, the largest correlation is with
15
Niño 4, 0.53 for UT CO and 0.87 for SST. This suggests the SST anomaly of central tropical Pacific (Niño 4) may have larger influence on UT CO interannual variation than that of eastern tropical Pacific (Niño 3). The coupled spatial patterns of the first SVD mode are shown in Fig. 6b and c as homogeneous correlation maps for UT CO and SST respectively, and in Fig. 6d as heterogeneous correlation map for UT CO. The
20
homogeneous correlation map of UT CO resembles that of the first REOF mode of UT CO (Fig. 1c), while the homogeneous correlation map of SST shows two dipoles: one is a west-central Pacific dipole, and the other is a northwest–southeast Indian Ocean dipole. This map also shows a tri-pole over the Atlantic Ocean, with the SST anomaly over the equatorial Atlantic Ocean off-phase with those over the northern and
south-25
ACPD
13, 25567–25615, 2013Impacts of fire emissions and transport pathways
L. Huang et al.
Title Page
Abstract Introduction
Conclusions References
Tables Figures
◭ ◮
◭ ◮
Back Close
Full Screen / Esc
Printer-friendly Version Interactive Discussion
Discussion
P
a
per
|
D
iscussion
P
a
per
|
Discussion
P
a
per
|
Discuss
ion
P
a
per
|
South America-southern Africa, which again resembles that of the first REOF mode of UT CO and suggests the dependence of UT CO on SST is mainly affected by ENSO.
The results of the second SVD mode of 147 hPa CO and SST are shown in Fig. 7. The correlation coefficient between the two PCs is 0.64 (Fig. 7a). As shown in Table 2, there is no climate index that has significant correlation with both PCs. The
homoge-5
neous correlation map of UT CO (Fig. 7b) shows a center of high correlation over the Atlantic Ocean, while the homogeneous correlation map of SST (Fig. 7c) resembles that of the first SVD. The heterogeneous correlation map of UT CO (Fig. 7d) shows high correlation over the tropical Atlantic Ocean and West Africa, which resembles that of the third REOF mode of UT CO (Fig. 3c). Thus, the second SVD mode may indicate
10
the influence of the Atlantic Ocean. For the third SVD mode of 147 hPa CO and SST (not shown), the correlation coefficient between the two PCs is 0.73. Both PCs have significant correlation with 5 climate indices (Table 2), and the largest correlation is with TNA (0.50 for UT CO and 0.76 for SST). The heterogeneous correlation map of UT CO shows high correlation over the Northeast Pacific and North Atlantic Ocean.
15
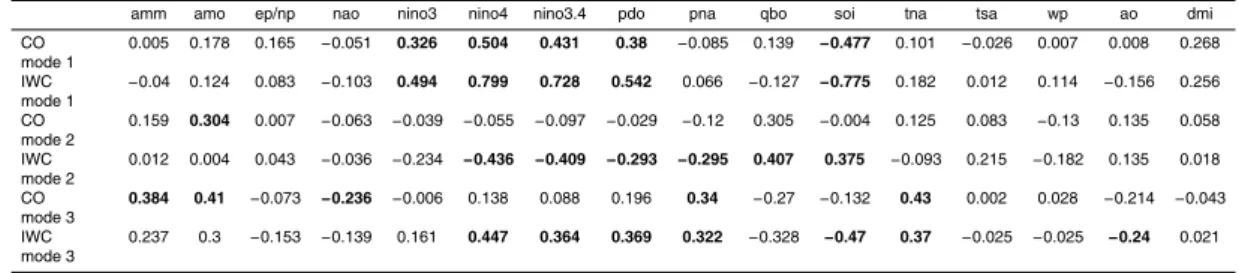
The first three SVD modes between 147 hPa CO anomaly and 215 hPa IWC anomaly account for 65.0 %, 14.3 % and 7.9 % of the total squared covariance, respectively. The correlation coefficient between the two PCs of the first SVD mode is 0.74 (Fig. 8a). Both PCs have significant correlation with ENSO indices (Niño 3, Niño 4, Niño 3.4 and SOI) and PDO (Table 3), and the strongest correlation is with Niño 4. Thus, it suggests the
20
central tropical Pacific SST anomaly has the strongest influence on the IAV of UT CO, similar to the first SVD mode between UT CO and SST. The coupled spatial patterns of the first SVD mode are shown in Fig. 8b and c as homogeneous correlation maps for UT CO and IWC respectively, and in Fig. 8d as heterogeneous correlation map for UT CO. All three maps are quite similar to those of the first SVD mode between UT CO
25
ACPD
13, 25567–25615, 2013Impacts of fire emissions and transport pathways
L. Huang et al.
Title Page
Abstract Introduction
Conclusions References
Tables Figures
◭ ◮
◭ ◮
Back Close
Full Screen / Esc
Printer-friendly Version Interactive Discussion
Discussion
P
a
per
|
D
iscussion
P
a
per
|
Discussion
P
a
per
|
Discuss
ion
P
a
per
For the second SVD mode of 147 hPa CO and 215 hPa IWC, the correlation coeffi -cient between the two PCs is 0.60 (Fig. 9a). As shown in Table 3, there is no climate index that has significant correlation with both PCs. The homogeneous correlation map of UT CO (Fig. 9b) shows a center of high correlation over the South Atlantic Ocean, while the homogeneous correlation map of IWC (Fig. 9c) shows a center over the
Ama-5
zon and tropical Atlantic Ocean. The heterogeneous correlation map of UT CO (Fig. 9d) shows high correlation over the Central Atlantic Ocean and West Africa, which is simi-lar to that of the second SVD mode between 147 hPa CO and SST. For the third SVD mode of 147 hPa CO and 215 hPa IWC (not shown), the correlation coefficient be-tween the two PCs is 0.70. Both PCs have significant correlation with 2 climate indices
10
(Table 3), and the largest correlation is with TNA, 0.43 for UT CO and 0.37 for IWC. The heterogeneous correlation map of UT CO is similar to that of the third SVD mode between 147 hPa CO and SST.
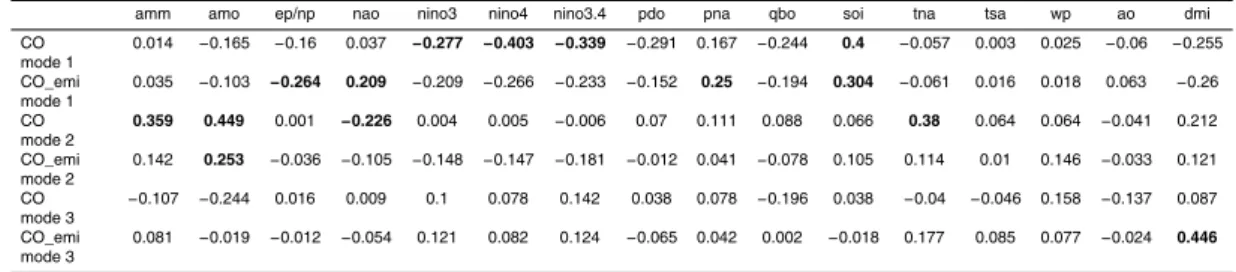
The first three SVD modes between 147 hPa CO anomaly and CO emission anomaly account for 88.1 %, 4.8 % and 3.4 % of the total squared covariance, respectively. The
15
correlation coefficient between the two PCs of the first SVD mode is 0.60 (Fig. 10a). Both PCs have significant correlation with ENSO index (SOI) (Table 4). The coupled spatial patterns of the first SVD mode are shown in Fig. 10b and c as homogeneous correlation maps for UT CO and CO emission respectively, and in Fig. 10d as hetero-geneous correlation map for UT CO. All three maps show a center of high correlation
20
over Indonesia and the adjacent Indian Ocean (except the CO emission map since there is no emission over ocean), suggesting the dominance of this region in tropical UT CO interannual variation.
For the second SVD mode of 147 hPa CO and CO emission, the correlation coef-ficient between the two PCs is 0.38 (Fig. 11a). As shown in Table 4, both PCs have
25
heteroge-ACPD
13, 25567–25615, 2013Impacts of fire emissions and transport pathways
L. Huang et al.
Title Page
Abstract Introduction
Conclusions References
Tables Figures
◭ ◮
◭ ◮
Back Close
Full Screen / Esc
Printer-friendly Version Interactive Discussion
Discussion
P
a
per
|
D
iscussion
P
a
per
|
Discussion
P
a
per
|
Discuss
ion
P
a
per
|
neous correlation map of UT CO (Fig. 11d) only shows relatively weak correlation over the southern Africa. For the third SVD mode of 147 hPa CO and CO emission (not shown), the correlation coefficient between the two PCs is 0.39 and no climate index is significantly correlated with both PCs (Table 4).
The SVD analyses above suggested that ENSO is the dominant climate condition
5
that affects the field relationship between UT CO and SST, convection, and CO emis-sion. The similarity between SVD analyses of CO-SST and CO-IWC suggests that SST anomaly plays an important role in deep convection changes. AMO has significant im-pact on the field relationship between UT CO and CO emission as it shows up in the second SVD mode, possibly through its impact on the rainfall in South America and
10
Africa (Knight et al., 2006). Since ENSO is the dominant factor governing the interan-nual variation of tropical UT CO, we need to investigate the impacts of different types of ENSO on CO transport to the UT.
5 Impact of ENSO types on UT CO interannual variation
Since the launch of Aura, there have been several ENSO periods: 2004, 2006
15
and 2009 are typical El Niño-like years, while 2005, 2007 and 2010 are typical La Niña years (based on a threshold of ±0.5◦C for the Oceanic Niño Index (ONI), http://www.cpc.ncep.noaa.gov/products/analysis_monitoring/ensostuff/ensoyears.shtml). Figure 12 shows the SST anomalies during the mature phase (DJF) of each ENSO year. Besides the sign differences of SST anomaly in the central-eastern Pacific
20
between El Niño and La Niña years, there are also large differences in the location and strength of the maximum SST anomaly. For the 2004/2005 and 2009/2010 El Niño, the strong positive SST anomalies were mainly located in the central Pacific, while in 2006/2007 El Niño, there were also strong SST anomalies in the eastern Pacific. Thus, these three periods represent two different types of El Niño, which have been
25
ACPD
13, 25567–25615, 2013Impacts of fire emissions and transport pathways
L. Huang et al.
Title Page
Abstract Introduction
Conclusions References
Tables Figures
◭ ◮
◭ ◮
Back Close
Full Screen / Esc
Printer-friendly Version Interactive Discussion
Discussion
P
a
per
|
D
iscussion
P
a
per
|
Discussion
P
a
per
|
Discuss
ion
P
a
per
the former two El Niños, as shown by the larger and more extensive SST anomalies. For the three La Niña periods, the intensity became stronger one after another, as indicated by the negative SST anomalies extending from the equator to the subtropics. Since the strongest biomass burning in South America and Central Africa occurs in boreal fall (Huang et al., 2012), here we choose September–November (SON) as
5
the focused period to study the differences of CO transport to the UT between dif-ferent ENSO types. The distributions of seasonal average CO and IWC anomalies at 215 hPa are shown in Fig. 13. The anomalies are calculated as the seasonal mean of each year minus the 2005–2011 climatological mean. In general, UT CO shows positive anomalies over the Indonesian region and Indian Ocean in El Niño years, compared to
10
negative anomalies over the same region in La Niña years. In addition, UT CO shows consistently strong positive anomalies over South America in La Niña years, while the anomalies are not consistent in El Niño years. For example, there were moderate pos-itive UT CO anomalies in 2004, compared to strong negative anomalies in 2009 over South America. Over Indonesia, UT CO anomaly generally shows opposite sign to that
15
of co-located IWC, consistent with the negative correlation between UT CO and IWC anomalies over SE Asia as discussed before. Over South America, the CO anomaly centers are not co-located with the centers of IWC anomaly. Another region that shows distinct ENSO impact is the central Pacific (around the dateline), where positive (neg-ative) UT CO and IWC anomalies are co-located during El Niño (La Niña) years,
sug-20
gesting that convective transport is important in determining UT CO concentration over this region.
Why are the patterns of the UT CO anomalies so different between different ENSO types? To explore this question, we carried out the analyses through two ways: one way is to analyze the differences of surface emission and convection, and the other
25
ACPD
13, 25567–25615, 2013Impacts of fire emissions and transport pathways
L. Huang et al.
Title Page
Abstract Introduction
Conclusions References
Tables Figures
◭ ◮
◭ ◮
Back Close
Full Screen / Esc
Printer-friendly Version Interactive Discussion
Discussion
P
a
per
|
D
iscussion
P
a
per
|
Discussion
P
a
per
|
Discuss
ion
P
a
per
|
intense fires caused by drought conditions related to ENSO (e.g., Logan et al., 2008; Chandra et al., 2009), which are consistent with the co-located negative precipitation anomalies. However, 2009 El Niño is an exception. There was a negative emission anomaly over Indonesia, and a much stronger negative anomaly over South America than previous two events. This may be the reason for the weak CO anomaly over
In-5
donesia and strong negative CO anomaly over South America at 215 hPa (Fig. 13). In all three events, positive precipitation anomalies occurred over the central Pacific, con-sistent with the positive 215 hPa IWC anomalies discussed before. During La Niña pe-riods, CO emission generally shows opposite anomalies over Indonesia, Australia and South America against El Niño periods. Precipitation also shows opposite anomalies
10
over the central Pacific. However, both CO emission and precipitation anomalies do not show clear difference between different ENSO types over the African continent.
To investigate the differences of CO transport pathways between different ENSO types, we performed analysis using the pathway auto-identification method developed in Huang et al. (2012). Since CloudSat was launched in 2006, here we only have two
15
El Niño years (2006 and 2009) and two La Niña years (2007 and 2010) for the analysis. First, we calculate the relative frequency of each transport pathway, which is defined as the percentage of CO increase cases associated with each pathway normalized by the total number of CO increase cases within each 4◦latitude×8◦longitude grid box. The results are shown in Figs. 15 and 16, for the “local convection” and the “LT advection→
20
convection” pathway, respectively. The “local convection” pathway occurred more fre-quently over South America than over southern Africa, while the frequency was lowest over the Indonesian region (Fig. 15). Although the UT CO concentration over South America was much higher in 2006 than that in 2009 (Fig. 13), the frequency of “local convection” pathway did not show much difference. Similarly, the frequency of “local
25
fre-ACPD
13, 25567–25615, 2013Impacts of fire emissions and transport pathways
L. Huang et al.
Title Page
Abstract Introduction
Conclusions References
Tables Figures
◭ ◮
◭ ◮
Back Close
Full Screen / Esc
Printer-friendly Version Interactive Discussion
Discussion
P
a
per
|
D
iscussion
P
a
per
|
Discussion
P
a
per
|
Discuss
ion
P
a
per
quency of “local convection” pathway did not show clear difference between different ENSO types. For the “LT advection→convection” pathway, it occurred more frequently over maritime areas than over continents, especially over the tropical western Pacific and northern Indian Ocean (Fig. 16). The frequency of “LT advection→ convection” pathway appeared to be higher over the west-central Pacific (near Indonesia) during El
5
Niño years than during La Niña years, which may account for the UT CO differences over this region between different ENSO types (Fig. 13).
Second, we calculate the average increase of CO concentration at 215 hPa associ-ated with the “local convection” and the “LT advection→convection” pathway, and the results are shown in Figs. 17 and 18, respectively. In general, the interannual variation
10
of average CO increase associated with the “local convection” pathway is consistent with the IAV of UT CO over the tropical continents (Fig. 17). For example, the higher CO concentrations over South America during 2006 than 2009 (both are El Niño years), or during 2010 than 2007 (both are La Niña years), were corresponding to the higher average CO increase associated with the “local convection” pathway during that year.
15
Besides, the average CO increase associated with the “local convection” pathway ap-peared to be higher over Indonesia-Australia and lower over South America during El Niño years than those during La Niña years, which indicates clear differences of CO transport between different ENSO types. The average CO increase associated with the “LT advection→ convection” pathway was higher over the Indonesian region
dur-20
ing 2006 and over the southern South America (15–30◦S) during 2010, compared with other years (Fig. 18). Except these two regions, the interannual variation was small. The average CO increase associated with the “LT advection→ convection” pathway did not show clear difference between different ENSO types over the tropics.
To quantify the differences of CO transport from the surface to the UT between two
25
ACPD
13, 25567–25615, 2013Impacts of fire emissions and transport pathways
L. Huang et al.
Title Page
Abstract Introduction
Conclusions References
Tables Figures
◭ ◮
◭ ◮
Back Close
Full Screen / Esc
Printer-friendly Version Interactive Discussion
Discussion
P
a
per
|
D
iscussion
P
a
per
|
Discussion
P
a
per
|
Discuss
ion
P
a
per
|
the number of “local convection” events was smaller in 2006 than that in 2009, the number of “LT advection → convection” events was larger, thus the total number of transport events was nearly equal between the two years. In addition, the average CO increase associated with either pathway was also comparable between 2006 and 2009. Thus, the overall CO transport over this region did not show much difference
5
between the two years. Over South America, the number of “LT advection→ convec-tion” events was much larger in 2006 than that in 2009, while the number of “local convection” events was nearly equal. However, the average CO increase (∆CO) asso-ciated with “local convection” was significantly lower in 2009 (58.6 ppbv) than that in 2006 (75.5 ppbv), while∆CO associated with “LT advection→convection” was nearly
10
equal. This may be the reason for the strong negative UT CO anomaly in 2009 over this region. Over Indonesia, the numbers of both pathway events were larger in 2009 than those in 2006, despite the fact that stronger positive UT CO anomaly occurred in 2006. To explain this “paradox”, we again checked∆CO associated with each pathway. Indeed, the average CO increase associated with “local convection” was significantly
15
higher in 2006 (73.8 ppbv) than that in 2009 (47.8 ppbv). In addition,∆CO associated with “LT advection→convection” pathway was also higher in 2006, but the difference between the two years was much less. The reason why fewer transport events were identified in 2006 than 2009 over Indonesia may be due to higher background CO con-centrations in the UT which are used to determine CO changes for identifying transport
20
pathways.
6 Conclusions
In this study, we have identified the dominant modes of the interannual variation of tropical UT CO by using rotated EOF analysis, and evaluated the field relationships between SST, convection, CO emission and UT CO interannual variation by using SVD
25
ACPD
13, 25567–25615, 2013Impacts of fire emissions and transport pathways
L. Huang et al.
Title Page
Abstract Introduction
Conclusions References
Tables Figures
◭ ◮
◭ ◮
Back Close
Full Screen / Esc
Printer-friendly Version Interactive Discussion
Discussion
P
a
per
|
D
iscussion
P
a
per
|
Discussion
P
a
per
|
Discuss
ion
P
a
per
auto-identification method developed in our previous study. The main conclusions are summarized as follows:
Indonesia is the most significant tropical land region that affects UT CO interannual variation, as suggested by the first REOF mode of UT CO. ENSO is the dominant cli-mate condition affecting the time evolution of the first REOF mode. The second REOF
5
mode identified a strong center over South America, and indicated the significant influ-ence of the Atlantic Ocean SST. The third REOF mode identified a strong center over West Africa and tropical Atlantic Ocean, and the time evolution of this REOF mode appears to be affected by various climate conditions.
Over South America, the IAV of UT CO is mainly affected by the IAV of surface CO
10
emission, as suggested by the significant correlation between the monthly anomalies of UT CO and CO emission. Over Central Africa, CO emission has little impact on the IAV of UT CO, while convective transport may play an important role. Over SE Asia, both CO emission and convective transport are important in determining the IAV of UT CO. Over the whole Tropics, the IAV of UT CO is mainly affected by the IAV of CO
15
emission, which is similar to that over South America.
The SVD analyses suggest that ENSO is the dominant climate condition that affects the field relationships between UT CO and SST, UT CO and convection, as well as UT CO and CO emission. The variation of convection is closely related to the SST changes as suggested by the similarity between SVD analyses of SST and
CO-20
IWC. AMO appears to have significant impact on the field relationship between UT CO and CO emission, probably through its impact on the rainfall in South America and Africa (Knight et al., 2006).
The impacts of different ENSO types on the IAV of CO in the tropical UT are an-alyzed through two ways: factor analysis and transport pathway analysis. During
bo-25
ACPD
13, 25567–25615, 2013Impacts of fire emissions and transport pathways
L. Huang et al.
Title Page
Abstract Introduction
Conclusions References
Tables Figures
◭ ◮
◭ ◮
Back Close
Full Screen / Esc
Printer-friendly Version Interactive Discussion
Discussion
P
a
per
|
D
iscussion
P
a
per
|
Discussion
P
a
per
|
Discuss
ion
P
a
per
|
years, which is associated with positive CO emission anomalies. Over the central Pa-cific (around the dateline), positive (negative) UT CO anomalies occurs in El Niño (La Niña) years, mainly due to positive (negative) convection anomalies.
Through the transport pathway analysis, we found that the IAV of UT CO over the tropical continents is consistent with that of the average CO increase associated with
5
the “local convection” pathway, instead of the relative frequency of this pathway. The relative frequency of the “LT advection→convection” pathway appears to be the factor that accounts for the UT CO differences over the west-central Pacific between diff er-ent ENSO types. Besides, different ENSO types have different impacts on the average CO transported by the “local convection” pathway, which appears to be higher over
10
Indonesia-Australia and lower over South America during El Niño years than that dur-ing La Niña years. Although both 2006 and 2009 are El Niño years, the ENSO types are totally different, as demonstrated by the SST anomaly pattern. The results of transport pathway analysis suggest that the average CO transported per event of “local convec-tion”, instead of the number of transport events, is the factor that accounts for the UT
15
CO difference between these two El Niño periods over South America and Indonesia. The contribution from the difference of “LT advection→ convection” pathway is much smaller and negligible compared to the “local convection” pathway.
Although previous studies have found that ENSO has significant impact on the IAV of UT CO (e.g., Edwards et al., 2006b; Duncan and Logan, 2008), this work is consistent
20
with previous findings by directly evaluating the UT CO anomaly field. Besides, we found that different ENSO types have rather different impacts on spatial pattern of the UT CO, which is related to the differences in CO transport. Although we have analyzed the impacts of different ENSO types on the IAV of tropical UT CO, due to the limited satellite observations, we only have a relatively short period of data for the
25
ACPD
13, 25567–25615, 2013Impacts of fire emissions and transport pathways
L. Huang et al.
Title Page
Abstract Introduction
Conclusions References
Tables Figures
◭ ◮
◭ ◮
Back Close
Full Screen / Esc
Printer-friendly Version Interactive Discussion
Discussion
P
a
per
|
D
iscussion
P
a
per
|
Discussion
P
a
per
|
Discuss
ion
P
a
per
variation of UT CO, but the mechanisms are still not clear. These questions will need to be addressed in future studies.
Acknowledgements. This research is supported by the NASA Aura Science Team (AST) pro-gram (NNX09AD85G), the Jackson School of Geosciences at the University of Texas at Austin, and the Jet Propulsion Laboratory, California Institute of Technology, under contract with NASA.
5
We acknowledge the NASA CloudSat project for the CloudSat data.
References
Adler, R. F., Huffman, G. J., Chang, A., Ferraro, R., Xie, P. P., Janowiak, J., Rudolf, B., Schnei-der, U., Curtis, S., and Bolvin, D.: The version-2 global precipitation climatology project (GPCP) monthly precipitation analysis (1979–present), J. Hydrometeorol., 4, 1147–1167,
10
2003.
Andreae, M. O., Artaxo, P., Fischer, H., Freitas, S. R., Gregoire, J. M., Hansel, A., Hoor, P., Kormann, R., Krejci, R., Lange, L., Lelieveld, J., Lindinger, W., Longo, K., Peters, W., de Reus, M., Scheeren, B., Dias, M. A. F. S., Strom, J., van Velthoven, P. F. J., and Williams, J.: Transport of biomass burning smoke to the upper troposphere by deep convection in the
15
equatorial region, Geophys. Res. Lett., 28, 951–954, 2001.
Andreae, M. O., Rosenfeld, D., Artaxo, P., Costa, A. A., Frank, G. P., Longo, K. M., and Silva-Dias, M. A. F.: Smoking rain clouds over the Amazon, Science, 303, 1337–1342, 2004. Ashok, K., Behera, S. K., Rao, S. A., Weng, H., and Yamagata, T.: El Niño Modoki and its
possible teleconnection, J. Geophys. Res., 112, C11007, doi:10.1029/2006jc003798, 2007.
20
Bretherton, C. S., Widmann, M., Dymnikov, V. P., Wallace, J. M., and Bladé, I.: The effective number of spatial degrees of freedom of a time-varying field, J. Climate, 12, 1990–2009, 1999.
Chandra, S., Ziemke, J. R., Duncan, B. N., Diehl, T. L., Livesey, N. J., and Froidevaux, L.: Effects of the 2006 El Niño on tropospheric ozone and carbon monoxide: implications for dynamics
25
and biomass burning, Atmos. Chem. Phys., 9, 4239–4249, doi:10.5194/acp-9-4239-2009, 2009.
ACPD
13, 25567–25615, 2013Impacts of fire emissions and transport pathways
L. Huang et al.
Title Page
Abstract Introduction
Conclusions References
Tables Figures
◭ ◮
◭ ◮
Back Close
Full Screen / Esc
Printer-friendly Version Interactive Discussion
Discussion
P
a
per
|
D
iscussion
P
a
per
|
Discussion
P
a
per
|
Discuss
ion
P
a
per
|
Daniel, J. S. and Solomon, S.: On the climate forcing of carbon monoxide, J. Geophys. Res., 103, 13249–13260, 1998.
Duncan, B. N. and Logan, J. A.: Model analysis of the factors regulating the trends and vari-ability of carbon monoxide between 1988 and 1997, Atmos. Chem. Phys., 8, 7389–7403, doi:10.5194/acp-8-7389-2008, 2008.
5
Duncan, B. N., Strahan, S. E., Yoshida, Y., Steenrod, S. D., and Livesey, N.: Model study of the cross-tropopause transport of biomass burning pollution, Atmos. Chem. Phys., 7, 3713– 3736, doi:10.5194/acp-7-3713-2007, 2007.
Edwards, D. P., Emmons, L. K., Gille, J. C., Chu, A., Attie, J. L., Giglio, L., Wood, S. W., Haywood, J., Deeter, M. N., Massie, S. T., Ziskin, D. C., and Drummond, J. R.:
Satellite-10
observed pollution from Southern Hemisphere biomass burning, J. Geophys. Res.-Atmos., 111, D14312, doi:10.1029/2005jd006655, 2006a.
Edwards, D. P., Petron, G., Novelli, P. C., Emmons, L. K., Gille, J. C., and Drum-mond, J. R.: Southern Hemisphere carbon monoxide interannual variability observed by Terra/Measurement of Pollution in the Troposphere (MOPITT), J. Geophys. Res.-Atmos.,
15
111, D16303, doi:10.1029/2006jd007079, 2006b.
Enfiled, D. B. and Mestas-Nuñez, A. M.: El Niño and Southern Oscillation: Multi-Scale Variability and Global and Regional Impacts, edited by: Henry, F., Diaz and Vera Markgraf, Cambridge University Press, 2000.
Folkins, I., Chatfield, R., Baumgardner, D., and Proffitt, M.: Biomass burning and deep
con-20
vection in southeastern Asia: results from ASHOE/MAESA, J. Geophys. Res.-Atmos., 102, 13291–13299, 1997.
Giglio, L., van der Werf, G. R., Randerson, J. T., Collatz, G. J., and Kasibhatla, P.: Global estimation of burned area using MODIS active fire observations, Atmos. Chem. Phys., 6, 957–974, doi:10.5194/acp-6-957-2006, 2006.
25
Giglio, L., Randerson, J. T., van der Werf, G. R., Kasibhatla, P. S., Collatz, G. J., Morton, D. C., and DeFries, R. S.: Assessing variability and long-term trends in burned area by merging multiple satellite fire products, Biogeosciences, 7, 1171–1186, doi:10.5194/bg-7-1171-2010, 2010.
Gonzi, S. and Palmer, P. I.: Vertical transport of surface fire emissions observed from space, J.
30
ACPD
13, 25567–25615, 2013Impacts of fire emissions and transport pathways
L. Huang et al.
Title Page
Abstract Introduction
Conclusions References
Tables Figures
◭ ◮
◭ ◮
Back Close
Full Screen / Esc
Printer-friendly Version Interactive Discussion
Discussion
P
a
per
|
D
iscussion
P
a
per
|
Discussion
P
a
per
|
Discuss
ion
P
a
per
Huang, L., Fu, R., Jiang, J. H., Wright, J. S., and Luo, M.: Geographic and seasonal distributions of CO transport pathways and their roles in determining CO centers in the upper troposphere, Atmos. Chem. Phys., 12, 4683–4698, doi:10.5194/acp-12-4683-2012, 2012.
Jiang, J. H., Livesey, N. J., Su, H., Neary, L., McConnell, J. C., and Richards, N. A. D.: Connect-ing surface emissions, convective upliftConnect-ing, and long-range transport of carbon monoxide in
5
the upper troposphere: new observations from the Aura Microwave Limb Sounder, Geophys. Res. Lett., 34, L18812, doi:10.1029/2007gl030638, 2007.
Jiang, J. H., Su, H., Zhai, C., Massie, S. T., Schoeberl, M. R., Colarco, P. R., Platnick, S., Gu, Y., and Liou, K.-N.: Influence of convection and aerosol pollution on ice cloud particle effective radius, Atmos. Chem. Phys., 11, 457–463, doi:10.5194/acp-11-457-2011, 2011.
10
Kao, H. Y. and Yu, J. Y.: Contrasting eastern-Pacific and central-Pacific types of ENSO, J. Climate, 22, 615–632, 2009.
Knight, J. R., Folland, C. K., and Scaife, A. A.: Climate impacts of the Atlantic multidecadal oscillation, Geophys. Res. Lett., 33, L17706, doi:10.1029/2006GL026242, 2006.
Kug, J. S., Jin, F. F., and An, S. I.: Two Types of El Niño Events: cold tongue El Niño and warm
15
pool El Niño, J. Climate, 22, 1499–1515, doi:10.1175/2008jcli2624.1, 2009.
Lee, T., Hobbs, W. R., Willis, J. K., Halkides, D., Fukumori, I., Armstrong, E. M., Hayashi, A. K., Liu, W. T., Patzert, W., and Wang, O.: Record warming in the South Pacific and western Antarctica associated with the strong central-Pacific El Niño in 2009–10, Geophys. Res. Lett., 37, L19704, doi:10.1029/2010gl044865, 2010.
20
Liu, C. T., Zipser, E., Garrett, T., Jiang, J. H., and Su, H.: How do the water vapor and car-bon monoxide “tape recorders” start near the tropical tropopause?, Geophys. Res. Lett., 34, L09804, doi:10.1029/2006gl029234, 2007.
Junhua Liu, Logan, J. A., Jones, D. B. A., Livesey, N. J., Megretskaia, I., Carouge, C., and Ned-elec, P.: Analysis of CO in the tropical troposphere using Aura satellite data and the
GEOS-25
Chem model: insights into transport characteristics of the GEOS meteorological products, Atmos. Chem. Phys., 10, 12207–12232, doi:10.5194/acp-10-12207-2010, 2010.
Liu, J., Logan, J. A., Murray, L. T., Pumphrey, H. C., Schwartz, M. J., and Megretskaia, I. A.: Transport analysis and source attribution of seasonal and interannual variability of CO in the tropical upper troposphere and lower stratosphere, Atmos. Chem. Phys., 13, 129–146,
30
doi:10.5194/acp-13-129-2013, 2013.
ACPD
13, 25567–25615, 2013Impacts of fire emissions and transport pathways
L. Huang et al.
Title Page
Abstract Introduction
Conclusions References
Tables Figures
◭ ◮
◭ ◮
Back Close
Full Screen / Esc
Printer-friendly Version Interactive Discussion
Discussion
P
a
per
|
D
iscussion
P
a
per
|
Discussion
P
a
per
|
Discuss
ion
P
a
per
|
Livesey, N. J., Filipiak, M. J., Froidevaux, L., Read, W. G., Lambert, A., Santee, M. L., Jiang, J. H., Pumphrey, H. C., Waters, J. W., Cofield, R. E., Cuddy, D. T., Daffer, W. H., Drouin, B. J., Fuller, R. A., Jarnot, R. F., Jiang, Y. B., Knosp, B. W., Li, Q. B., Perun, V. S., Schwartz, M. J., Snyder, W. V., Stek, P. C., Thurstans, R. P., Wagner, P. A., Avery, M., Brow-ell, E. V., Cammas, J. P., Christensen, L. E., Diskin, G. S., Gao, R. S., Jost, H. J.,
Loewen-5
stein, M., Lopez, J. D., Nedelec, P., Osterman, G. B., Sachse, G. W., and Webster, C. R.: Val-idation of Aura Microwave Limb Sounder O-3 and CO observations in the upper troposphere and lower stratosphere, J. Geophys. Res.-Atmos., 113, D15S02, doi:10.1029/2007jd008805, 2008.
Livesey, N. J., Read, W. G., Froidevaux, L., Lambert, A., and Manney, G. L.: EOS MLS Version
10
3.3 Level 2 Data Quality and Description Document, Jet Propulsion Laboratory, California Institute of Technology, Pasadena, CA, 2011.
Livesey, N. J., Logan, J. A., Santee, M. L., Waters, J. W., Doherty, R. M., Read, W. G., Froide-vaux, L., and Jiang, J. H.: Interrelated variations of O3, CO and deep convection in the trop-ical/subtropical upper troposphere observed by the Aura Microwave Limb Sounder (MLS)
15
during 2004–2011, Atmos. Chem. Phys., 13, 579–598, doi:10.5194/acp-13-579-2013, 2013. Logan, J. A., Megretskaia, I., Nassar, R., Murray, L. T., Zhang, L., Bowman, K. W.,
Wor-den, H. M., and Luo, M.: Effects of the 2006 El Niño on tropospheric composition as re-vealed by data from the Tropospheric Emission Spectrometer (TES), Geophys. Res. Lett., 35, L03816, doi:10.1029/2007GL031698, 2008.
20
Lorenz, E. N.: Empirical orthogonal functions and statistical weather prediction, Technical re-port, Statistical Forecast Project Report 1, Dept. of Meteor., MIT, 49 pp., 1956.
Mu, M., Randerson, J. T., van der Werf, G. R., Giglio, L., Kasibhatla, P., Morton, D., Collatz, G. J., DeFries, R. S., Hyer, E. J., Prins, E. M., Griffith, D. W. T., Wunch, D., Toon, G. C., Sher-lock, V., and Wennberg, P. O.: Daily and 3-hourly variability in global fire emissions and
con-25
sequences for atmospheric model predictions of carbon monoxide, J. Geophys. Res.-Atmos., 116, doi:10.1029/2011jd016245, 2011.
North, G. R., Bell, T. L., Cahalan, R. F., and Moeng, F. J.: Sampling errors in the estimation of empirical orthogonal functions, Mon. Weather Rev., 110, 699–706, 1982.
Novelli, P., Masarie, K., and Lang, P.: Distributions and recent changes of carbon monoxide in
30
the lower troposphere, J. Geophys. Res., 103, 19015–19033, 1998.
ACPD
13, 25567–25615, 2013Impacts of fire emissions and transport pathways
L. Huang et al.
Title Page
Abstract Introduction
Conclusions References
Tables Figures
◭ ◮
◭ ◮
Back Close
Full Screen / Esc
Printer-friendly Version Interactive Discussion
Discussion
P
a
per
|
D
iscussion
P
a
per
|
Discussion
P
a
per
|
Discuss
ion
P
a
per
Blake, D. R.: Convective transport of biomass burning emissions over Brazil during TRACE A, J. Geophys. Res.-Atmos., 101, 23993–24012, 1996.
Reynolds, R. W., Rayner, N. A., Smith, T. M., Stokes, D. C., and Wang, W.: An improved in situ and satellite SST analysis for climate, J. Climate, 15, 1609–1625, 2002.
Ricaud, P., Barret, B., Attié, J.-L., Motte, E., Le Flochmoën, E., Teyssèdre, H., Peuch, V.-H.,
5
Livesey, N., Lambert, A., and Pommereau, J.-P.: Impact of land convection on troposphere-stratosphere exchange in the tropics, Atmos. Chem. Phys., 7, 5639–5657, doi:10.5194/acp-7-5639-2007, 2007.
Richman, M. B.: Rotation of principal components, J. Climatol., 6, 293–335, doi:10.1002/joc.3370060305, 1986.
10
Schoeberl, M. R., Duncan, B. N., Douglass, A. R., Waters, J., Livesey, N., Read, W., and Filipiak, M.: The carbon monoxide tape recorder, Geophys. Res. Lett., 33, L12811, doi:10.1029/2006gl026178, 2006.
Stephens, G. L., Vane, D. G., Boain, R. J., Mace, G. G., Sassen, K., Wang, Z. E., Illing-worth, A. J., O’Connor, E. J., Rossow, W. B., Durden, S. L., Miller, S. D., Austin, R. T.,
15
Benedetti, A., Mitrescu, C., and Team, C. S.: The cloudsat mission and the a-train – a new dimension of space-based observations of clouds and precipitation, B. Am. Meteorol. Soc., 83, 1771–1790, doi:10.1175/Bams-83-12-1771, 2002.
Su, H. and Jiang, J. H.: Tropical clouds and circulation changes during the 2006/07 and 2009/10 El Niños, J. Climate, 26, 399–413, doi:10.1175/JCLI-D-12-00152.1, 2013.
20
Thompson, A. M.: The oxidizing capacity of the earth’s atmosphere: probable past and future changes, Science, 256, 1157, 1157–1165, doi:10.1126/science.256.5060.1157, 1992. Thompson, A. M., Pickering, K. E., McNamara, D. P., Schoeberl, M. R., Hudson, R. D.,
Kim, J. H., Browell, E. V., Kirchhoff, V. W. J. H., and Nganga, D.: Where did tropospheric ozone over southern Africa and the tropical Atlantic come from in October 1992? Insights
25
from TOMS, GTE TRACE A, and SAFARI 1992, J. Geophys. Res.-Atmos., 101, 24251– 24278, 1996.
van der Werf, G. R., Randerson, J. T., Giglio, L., Collatz, G. J., Mu, M., Kasibhatla, P. S., Mor-ton, D. C., DeFries, R. S., Jin, Y., and van Leeuwen, T. T.: Global fire emissions and the contribution of deforestation, savanna, forest, agricultural, and peat fires (1997–2009),
At-30
mos. Chem. Phys., 10, 11707–11735, doi:10.5194/acp-10-11707-2010, 2010.
ACPD
13, 25567–25615, 2013Impacts of fire emissions and transport pathways
L. Huang et al.
Title Page
Abstract Introduction
Conclusions References
Tables Figures
◭ ◮
◭ ◮
Back Close
Full Screen / Esc
Printer-friendly Version Interactive Discussion
Discussion
P
a
per
|
D
iscussion
P
a
per
|
Discussion
P
a
per
|
Discuss
ion
P
a
per
|
Waters, J. W., Froidevaux, L., Harwood, R. S., Jarnot, R. F., Pickett, H. M., Read, W. G., Siegel, P. H., Cofield, R. E., Filipiak, M. J., Flower, D. A., Holden, J. R., Lau, G. K., Livesey, N. J., Manney, G. L., Pumphrey, H. C., Santee, M. L., Wu, D. L., Cuddy, D. T., Lay, R. R., Loo, M. S., Perun, V. S., Schwartz, M. J., Stek, P. C., Thurstans, R. P., Chandra, K. M., Chavez, M. C., Chen, G., Boyles, M. A., Chudasama, B. V., Dodge, R.,
5
Fuller, R. A., Girard, M. A., Jiang, J. H., Jiang, Y., Knosp, B. W., LaBelle, R. C., Lam, J. C., Lee, K. A., Miller, D., Oswald, J. E., Patel, N. C., Pukala, D. M., Quintero, O., Scaff, D. M., Snyder, W. V., Tope, M. C., Wagner, P. A., and Walch, M. J.: The Earth Observing System Microwave Limb Sounder (EOS MLS) on the Aura satellite, IEEE T. Geosci. Remote, 44, 1075–1092, 2006.
10
Wotawa, G., Novelli, P., Trainer, M., and Granier, C.: Inter-annual variability of summertime CO concentrations in the Northern Hemisphere explained by boreal forest fires in North America and Russia, Geophys. Res. Lett., 28, 4575–4578, 2001.
Wu, D. L., Jiang, J. H., Read, W. G., Austin, R. T., David, C. P., Lambert, A., Stephens, G. L., Vane, D. G., and Waters, J. W.: Validation of Aura MLS cloud Ice Water Content (IWC)
mea-15
surements, J. Geophys. Res., 113, D15S10, doi:10.1029/2007JD008931, 2008.
ACPD
13, 25567–25615, 2013Impacts of fire emissions and transport pathways
L. Huang et al.
Title Page
Abstract Introduction
Conclusions References
Tables Figures
◭ ◮
◭ ◮
Back Close
Full Screen / Esc
Printer-friendly Version Interactive Discussion
Discussion
P
a
per
|
D
iscussion
P
a
per
|
Discussion
P
a
per
|
Discuss
ion
P
a
per
Table 1.Correlation coefficients between the rotated principle components (PCs) of the first three REOF modes of 147 hPa CO and 16 climate indices. The values that are significant at the 90 % confidence level after considering autocorrelation are shown in bold. The acronyms represent (from left to right): Atlantic Meridional Mode (AMM), Atlantic Multidecadal Oscilla-tion (AMO), East Pacific/North Pacific OscillaOscilla-tion (EP/NP), North Atlantic OscillaOscilla-tion (NAO), Pacific Decadal Oscillation (PDO), Pacific North American Index (PNA), Quasi-Biennial Oscil-lation (QBO), Southern OscilOscil-lation Index (SOI), Tropical Northern Atlantic Index (TNA), Tropical Southern Atlantic Index (TSA), Western Pacific Index (WP), Arctic Oscillation (AO) and Dipole Mode Index (DMI).
amm amo ep/np nao nino3 nino4 nino3.4 pdo pna qbo soi tna tsa wp ao dmi
CO PC1
0.008 −0.158 −0.13 0.045 −0.251 −0.356 −0.301 −0.229 0.197 −0.305 0.321 −0.058 −0.008 −0.018 −0.075 −0.283
CO PC2
0.254 0.361 −0.102 −0.219 −0.048 −0.069 −0.067 0.004 0.172 0.017 0.116 0.277 0.087 0.113 −0.078 −0.053
CO PC3
ACPD
13, 25567–25615, 2013Impacts of fire emissions and transport pathways
L. Huang et al.
Title Page
Abstract Introduction
Conclusions References
Tables Figures
◭ ◮
◭ ◮
Back Close
Full Screen / Esc
Printer-friendly Version Interactive Discussion
Discussion
P
a
per
|
D
iscussion
P
a
per
|
Discussion
P
a
per
|
Discuss
ion
P
a
per
|
Table 2. Correlation coefficients between 16 climate indices and the principle components (PCs) of the first three SVD modes of 147 hPa CO and SST. The values that are significant at the 90 % confidence level after considering autocorrelation are shown in bold.
amm amo ep/np nao nino3 nino4 nino3.4 pdo pna qbo soi tna tsa wp ao dmi
CO mode 1
0.003 0.174 0.165 −0.056 0.343 0.527 0.456 0.395 −0.073 0.12 −0.485 0.108 −0.03 0.017 −0.005 0.277
SST mode 1
−0.066 0.142 0.125 −0.118 0.575 0.872 0.815 0.554 0.068 −0.058 −0.763 0.21 0.038 0.05 −0.154 0.267
CO mode 2
−0.143 −0.299 −0.021 0.041 0.024 0.029 0.077 0.014 0.122 −0.29 0.033 −0.11 −0.068 0.136 −0.153 −0.068
SST mode 2
−0.121 −0.106 0.079 −0.128 0.295 0.509 0.499 0.342 0.237 −0.361 −0.421 0.056 0.013 0.173 −0.293 0.139
CO mode 3
0.44 0.449 −0.061 −0.276 0 0.097 0.072 0.18 0.327 −0.201 −0.037 0.499 0.041 0.051 −0.222 0.033
SST mode 3