Atmos. Chem. Phys., 15, 12251–12266, 2015 www.atmos-chem-phys.net/15/12251/2015/ doi:10.5194/acp-15-12251-2015
© Author(s) 2015. CC Attribution 3.0 License.
Impacts of Amazonia biomass burning aerosols assessed from
short-range weather forecasts
S. R. Kolusu1, J. H. Marsham1,2, J. Mulcahy3, B. Johnson3, C. Dunning3, M. Bush3, and D. V. Spracklen1
1Institute for Climate and Atmospheric Science, School of Earth and Environment, Leeds, LS2 9JT, UK 2National Centre for Atmospheric Science, Leeds, UK
3Met Office, FitzRoy Road, Exeter, EX1 3PB, UK
Correspondence to:S. R. Kolusu (s.kolusu@leeds.ac.uk)
Received: 24 June 2015 – Published in Atmos. Chem. Phys. Discuss.: 10 July 2015 Revised: 26 October 2015 – Accepted: 27 October 2015 – Published: 5 November 2015
Abstract. The direct radiative impacts of biomass burning aerosols (BBA) on meteorology are investigated using short-range forecasts from the Met Office Unified Model (MetUM) over South America during the South American Biomass Burning Analysis (SAMBBA). The impacts are evaluated using a set of three simulations: (i) no aerosols, (ii) with monthly mean aerosol climatologies and (iii) with prognos-tic aerosols modelled using the Coupled Large-scale Aerosol Simulator for Studies In Climate (CLASSIC) scheme. Com-parison with observations show that the prognostic CLAS-SIC scheme provides the best representation of BBA. The impacts of BBA are quantified over central and southern Amazonia from the first and second day of 2-day fore-casts during 14 September–3 October 2012. On average, during the first day of the forecast, including prognostic BBA reduces the clear-sky net radiation at the surface by 15±1 W m−2and reduces net top-of-atmosphere (TOA) ra-diation by 8±1 W m−2, with a direct atmospheric warming of 7±1 W m−2. BBA-induced reductions in all-sky radia-tion are smaller in magnitude: 9.0±1 W m−2at the surface and 4.0±1 W m−2at TOA. In this modelling study the BBA therefore exert an overall cooling influence on the Earth– atmosphere system, although some levels of the atmosphere are directly warmed by the absorption of solar radiation. Due to the reduction of net radiative flux at the surface, the mean 2 m air temperature is reduced by around 0.1±0.02◦C. The
BBA also cools the boundary layer (BL) but warms air above by around 0.2◦C due to the absorption of shortwave radia-tion. The overall impact is to reduce the BL depth by around 19±8 m. These differences in heating lead to a more anticy-clonic circulation at 700 hPa, with winds changing by around
0.6 m s−1. Inclusion of climatological or prognostic BBA in the MetUM makes a small but significant improvement in forecasts of temperature and relative humidity, but improve-ments were small compare with model error and the relative increase in forecast skill from the prognostic aerosol simu-lation over the aerosol climatology was also small. Locally, on a 150 km scale, changes in precipitation reach around 4 mm day−1 due to changes in the location of convection. Over Amazonia, including BBA in the simulation led to fewer rain events that were more intense. This change may be linked to the BBA changing the vertical profile of stabil-ity in the lower atmosphere. The localised changes in rain-fall tend to average out to give a 5 % (0.06 mm day−1) de-crease in total precipitation over the Amazonian region (ex-cept on day 2 with prognostic BBA). The change in wa-ter budget from BBA is, however, dominated by decreased evapotranspiration from the reduced net surface fluxes (0.2 to 0.3 mm day−1), since this term is larger than the correspond-ing changes in precipitation and water vapour convergence.
1 Introduction
pollutants that adversely affect human health (Marlier et al., 2013). Biomass burning aerosols (BBA) can significantly al-ter the energy balance of the atmosphere and the Earth’s surface by directly absorbing and scattering solar radiation (Reid et al., 2005) and indirectly changing the cloud prop-erties, thus modulating the hydrological cycle (Ramanathan et al., 2001; Andreae and Rosenfeld, 2008). As a result, BBA affects sensible and latent heat fluxes in the lower atmo-sphere, altering the temperature of the Earth’s surface (Yu et al., 2002; Ichoku et al., 2003). The direct and indirect ef-fects of BBA cause changes in the regional weather and cli-mate via changes in the stability of the atmosphere, height of the boundary layer (BL), regional atmospheric circula-tion, cloud formation and precipitation (Kaufman and Ko-ren, 2006; Rosenfeld et al., 2008). Despite such impacts on regional weather, most operational weather forecasts only in-clude a climatological treatment of BBA. Here we explore the impact of prognostic BBA on short-term weather fore-casts over Amazonia.
The majority of fires worldwide occur in tropical coun-tries (Crutzen and Andreae, 1990; van der Werf et al., 2010) and the tropics play a particularly pivotal role in tropo-spheric chemistry (Crutzen and Zimmermann, 1991). Land-scape fires occur due to both natural and anthropogenic ac-tivities, such as forest fires, agricultural crop residue burning, deliberate burning of savannah grasslands and deforestation for agricultural purposes. South America accounts for an es-timated 15 % of global fire emissions of carbon from land-scape fires and open biomass burning (van der Werf et al., 2010), with regional hotspots of fire activity around the edges of Amazonia. The Amazon region experiences a large num-ber of fires each dry season (August–Octonum-ber). Emissions of BBA from fires greatly increase regional aerosol con-centrations (Martin et al., 2010), with dry season aerosol optical depth (AOD) of up to 4 observed at 550 nm using AERONET sun photometers (Artaxo et al., 2013). Such large concentrations of BBA with large AOD values may have sub-stantial impacts on the regional radiative balance. Procopio et al. (2004) used observations during the dry season to es-timate that Amazonian BBA caused a clear-sky radiative ef-fect of −5 to −12 W m−2 at top of atmosphere (TOA) and
−21 to−74 W m−2at the surface. Furthermore, Sena et al. (2013) used a combination of MODIS and CERES data to estimate daily direct TOA radiative effects, which reached
−30 W m−2 locally. Rosário et al. (2013) used a regional
model to estimate a surface radiative effect of−55 W m−2.
Such changes in fluxes must affect Amazonian weather and a better understanding of this has potential benefits for im-proving weather and climate prediction.
Modelling studies have explored the impact of BBA on regional weather and climate. Zhang et al. (2008) studied the direct effect of BBA using the regional climate model RegCM3 and found that BBA can weaken regional circu-lation, cloudiness and perturb land–atmosphere interactions. Zhang et al. (2009) showed that BBA can impact the
mon-soon circulation, weakening the South American monmon-soon circulation by increasing atmospheric stability. Using WRF-Chem model over South America, Wu et al. (2011) showed that BBA suppressed the diurnal amplitude of convection by about 11 %, decreasing clouds (consistent with Cook and Highwood, 2004) and precipitation in the afternoon but in-creasing them at night. Using the Community Atmosphere Model version 5 (CAM5), Tosca et al. (2013) found that BBA increased global mean AODs by 10 %, increased tro-pospheric heating and decreased global surface temperature by 0.13±0.01◦C. This resulted in a weakening of the Hadley circulation, causing small reductions in global precipitation but with larger reductions near the Equator.
The South American Biomass Burning Analysis (SAMBBA) was an international project involving ground-based and aircraft observations led by the UK Met Office, the National Institute for Space Research (INPE) Brazil, a consortium of seven UK universities and the University of Sao Paulo. The observational flight campaign was conducted from 14 September to 3 October 2012 across Amazonia. SAMBBA aims to assess the impact of Amazonian BBA on the regional and global radiation budget through the direct, semi-direct and indirect effects, on atmospheric dynamics and the hydrological cycle on numerical weather prediction (NWP) forecasts, on climate and on air quality. In this study we focus on the objective of quantifying the impact of BBA on weather.
S. R. Kolusu et al.: Impacts of aerosols on short-range weather forecasts 12253
Figure 1.Model domain and orography. Box A (blue) is used to calculate the short-range weather changes due to BBA in Table 2. S1, S2, S3 and S4 show locations of surface observations at Ben-jamin Constant, Eirunepe, Labrea and Manaus respectively. P1 and P2 are locations of radiosoundings at Porto Velho and Boa Vista. Asterisks (*) denote AERONET stations.
2 Model and data 2.1 Model
The MetUM (Davies et al., 2005) is used on a wide range of spatial and temporal scales from high-resolution short-range NWP to multi-decadal and centennial simulations in an Earth system model configuration (Collins et al., 2011). In this study a limited area model (LAM) configuration of the MetUM is set up over Brazil (Fig. 1) with a horizontal grid spacing of 0.1◦ latitude/longitude (around 12 km) and
70 levels in the vertical (model lid at 80 km). Simulations are run covering the SAMBBA campaign period (14 Septem-ber to 3 OctoSeptem-ber 2012). Meteorological boundary conditions are provided by the operational global NWP configuration of the MetUM (Global Atmosphere 3.1 configuration; Walters et al., 2011). The atmospheric boundary layer is modelled following Brown et al. (2008) while convection is parame-terized using the mass flux scheme based on Gregory and Rowntree (1990). Large-scale precipitation uses the single moment scheme based on Wilson and Ballard (1999), while large-scale cloud is parameterized using the scheme of Smith (1990). Cloud amount is diagnosed as a function of rela-tive humidity by assuming the sub-grid humidity distribution follows a symmetric triangular function centred on the grid-box mean. The width of this distribution is reduced near the surface to account for the reduced variability expected with smaller volume grid boxes on thinner near-surface model lev-els. The radiation scheme employed is the two-stream radi-ation code of Edwards and Slingo (1996) with six and nine bands in the shortwave and long-wave parts of the spectrum respectively. The simulations are initialised using a continu-ous 6-hourly cycle of three-dimensional variational data
as-Table 1.Experimental set-ups using the MetUM model.
Experiment set-up Aerosol representation
NOA No aerosol
CLIM Direct radiative effect (DRE) from
climatological BBA
PROG DRE from CLASSIC BBA
prognos-tic scheme
similation (3D-Var) (Lorenc et al., 2000) with a 2-day fore-cast run daily at 00:00 UTC (20:00 (UTC−4) local time in Porto Velho, Brazil).
microphysical interactions, except for wash out of BBA by rain in PROG.
2.2 Observational data and Methods
MODIS (Moderate-Resolution Imaging Spectroradiometer) Terra level 3 (King et al., 2003) satellite-retrieved daily AOD at 550 nm, with an uncertainty of ±0.05 over land, ±0.03 over ocean (Ichoku et al., 2005) and a horizontal resolution of 1◦latitude/longitude are used to evaluate simulated AOD. In
addition, we use ground-based retrievals of AOD (level 2) at 550 nm from eight AERONET stations in the Amazonia re-gion (Holben et al., 1998). ERA-Interim 6-hourly winds and geopotential height at 850 hPa obtained from the European Centre for Medium-Range Weather Forecasting (ECMWF) with a spatial resolution of 1.5◦latitude/longitude (Simmons et al., 2007) have been used to analyse meteorological con-ditions during the campaign period. For comparison with model simulations we use near-surface temperature and rel-ative humidity observations from different locations over the Amazon region provided by University of Sao Paulo (loca-tions in Fig. 1; data are 6-hourly except for Benjamin Con-stant, which are 12 hourly) and radiosonde data (12 hourly). The global model is initialised using a continuous 6-hourly cycle of four-dimensional variational data assimilation (4D-Var) (Rawlins et al., 2007). But the LAM itself has its own 6-hourly 3D-VAR assimilation (Lorenc et al., 2000) where the u, v winds, potential temperature, density, pressure and moisture variables are assimilated on a 6-hourly cycle. In the runs we analyse in this paper, the 2-day 00Z forecast is spun up from an assimilated start dump and then free run-ning and is forced 3 hourly at the boundaries by the global model forecasts. The impacts of BBA (1BBANOA) as a func-tion of forecast lead time t can be defined as a difference
1f (t )=fBBA(t )−fNOA(t ), wherefNOAis any
meteorolog-ical variable in NOA simulation andfBBAis the same
mete-orological variable from BBA simulations. In this study, we use the diurnal mean fromt=0 tot+24 h unless otherwise stated. The contribution of other aerosol species to the total aerosol load was small in the Amazonia region during the SAMBBA period.
We have calculated the significant values using the stan-dard error (SE) using the following method; the autocorrela-tion has been accounted for in the time series of each pixel:
SE=√SD
Nk, (1)
where “SD” is the standard deviation and “N” is the number of points (i.e. how many times contribute to each pixel in the model domain). “k” is the autocorrelation correction factor. This is based on the methodology of Bence (1995):
k= s
(1+p)
(1−p), (2)
where “p” is the autocorrelation function. “p” is calculated using the Prais–Winsten estimation.
3 Results and discussion
3.1 Meteorological conditions and aerosol distributions during SAMBBA
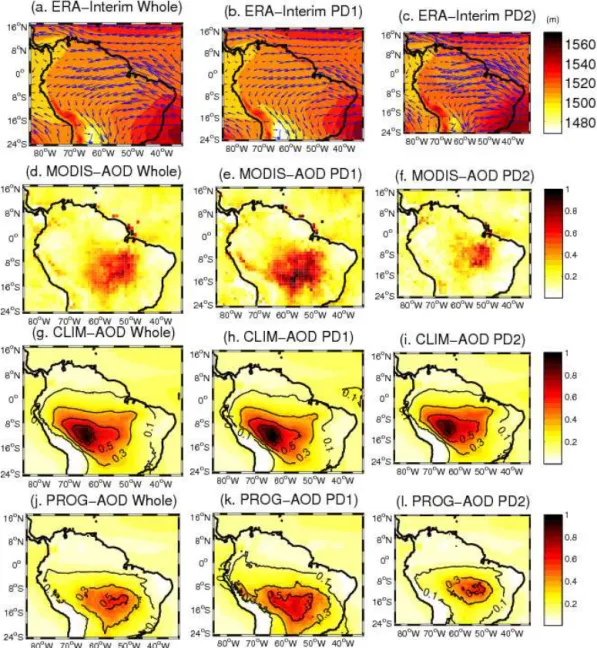
ERA-Interim analyses and aerosol loadings from the MetUM are presented in Fig. 2. The data are shown for two distinct periods during the SAMBBA campaign: Period 1 (PD1) from 14 to 22 September and Period 2 (PD2) from 22 September to 3 October 2012. In 2012 there was a transition from the end of the dry season into the wet season around the 22 Septem-ber (Brito et al., 2014). Periods 1 and 2 therefore had dif-ferent synoptic conditions and aerosols loadings. Therefore, we analyse results from these two periods separately as well as considering averages from the whole period. Figure 2a–c show low-level inflow for each period of air into South Amer-ica from the east, which turns southwards along the edge of Andes. This inflow is stronger in the second period. Detailed synoptic weather conditions for all the SAMBBA flights are presented in the SAMBBA campaign summary booklet (Dar-byshire and Johnson, 2013).
Figure 2 presents the total AOD (550 nm) from MODIS observations, CLIM and PROG simulations for the whole SAMBBA period, as well as PD1 and PD2. AODs were no-tably higher during PD1 in both the MODIS data and PROG. This difference is due to BBA, since other species such as sea salt, sulphate and mineral dust make very small contributions over South America during the dry season and the AOD max-imum is dominated by BBA. MODIS-retrieved AODs from the SAMBBA biomass burning seasons show large interan-nual variations with 2012 being a below-average year (not shown). MODIS has a high aerosol loading in the east (∼60– 50◦W) with lower AODs in the west. The CLIM simulation shows large positive bias compared with MODIS particularly in the west of Brazil (around 65◦W). As CLIM uses monthly mean aerosol fields it can not capture the reduction in AOD observed in PD2. The PROG simulation is better able to cap-ture the temporal and spatial variability of AOD for all peri-ods. It captures the decrease in AODs in PD2 and the location of the maximum AOD to within 5◦. Both PROG and CLIM have too low AOD north of 8◦S, with both models giving too
weak local maxima around 8◦S.
S. R. Kolusu et al.: Impacts of aerosols on short-range weather forecasts 12255
Figure 2.Geopotential height and wind vectors at 850 hPa from ERA-Interim(a, b, c)and 550 nm AODs from MODIS(d, e, f), from total AOD in CLIM(g, h, i)and total AOD in PROG(j, k, l). Plots are for whole period(a, d, g, j), first period PD1(b, e, h, k), second period PD2(c, f, i, l). Contours show BBA AOD.
−0.1). The mean correlation of AOD between AERONET and PROG is 0.4 and is −0.1 for CLIM. However, both PROG and CLIM fail to simulate very high AOD observed at Alta Floresta, Rio Branco and Santa Cruz (Fig. 1), although some discrepancy may arise from comparing a grid-box mean with a point observation from AERONET. Our analysis demonstrates that PROG better captures the observed spatial and temporal variability in BBA over the SAMBBA period.
3.2 Radiative impacts of BBA
During both periods of SAMBBA (PD1 and PD2) pattern of impacts of BBA were found to be similar and we therefore focus on the whole SAMBBA period in the remainder of our
14 17 20 23 26 29 02 0
0.5 1 1.5 2 2.5 3
AOD 500nm
Days Alta Floresta
AERONET PROG(0.3) CLIM(−0.3)
14 17 20 23 26 29 02
0 0.5 1 1.5 2 2.5
AOD 500nm
Days Cuiaba Miranda
AERONET PROG(0.7) CLIM(−0.4)
14 17 20 23 26 29 02
0 0.2 0.4 0.6 0.8
AOD 500nm
Days La Paz
AERONET PROG(0.7) CLIM(0.4)
14 17 20 23 26 29 02
0 0.5 1 1.5 2
AOD 500nm
Days Porto Velho
AERONET PROG(0.4) CLIM(−0.02)
14 17 20 23 26 29 02
0 0.5 1 1.5 2 2.5 3
AOD 500nm
Days Rio Branco
AERONET PROG(0.6) CLIM(0.5)
14 17 20 23 26 29 02
0 0.5 1 1.5 2 2.5
AOD 500nm
Days Santa Cruz
AERONET PROG(0.4) CLIM(−0.4)
14 17 20 23 26 29 02
0 0.5 1 1.5
AOD 500nm
Days Medellin
AERONET PROG(−0.1) CLIM(0.1)
14 17 20 23 26 29 02
0 0.5 1 1.5 2
AOD 500nm
Days Petrolina Sonda
AERONET PROG(0.3) CLIM(−0.5)
Figure 3.Time series comparison of AERONET (black *), PROG (blue line) and CLIM (red line) 550 nm AOD at different locations. The correlation coefficients between AERONET and models are shown in parenthesis.
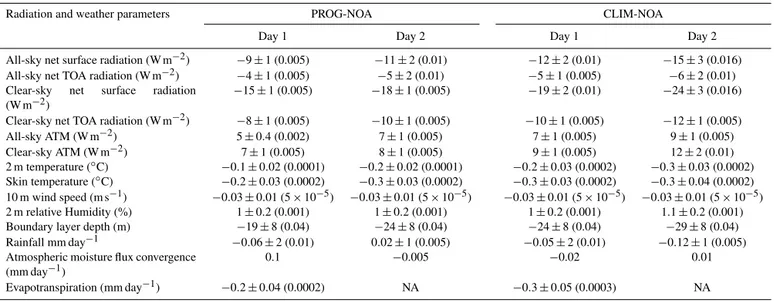
Table 2.Mean modelled short-range weather changes with standard deviations (and standard error in brackets) due to BBA in box A (Fig. 1) over day 1 and day 2 of simulations. The net atmospheric divergence is denoted as ATM. NA denotes that data are not available.
Radiation and weather parameters PROG-NOA CLIM-NOA
Day 1 Day 2 Day 1 Day 2
All-sky net surface radiation (W m−2) −9±1 (0.005) −11±2 (0.01) −12±2 (0.01) −15±3 (0.016) All-sky net TOA radiation (W m−2)
−4±1 (0.005) −5±2 (0.01) −5±1 (0.005) −6±2 (0.01) Clear-sky net surface radiation
(W m−2)
−15±1 (0.005) −18±1 (0.005) −19±2 (0.01) −24±3 (0.016) Clear-sky net TOA radiation (W m−2) −8±1 (0.005) −10±1 (0.005) −10±1 (0.005) −12±1 (0.005)
All-sky ATM (W m−2) 5
±0.4 (0.002) 7±1 (0.005) 7±1 (0.005) 9±1 (0.005)
Clear-sky ATM (W m−2) 7±1 (0.005) 8±1 (0.005) 9±1 (0.005) 12±2 (0.01)
2 m temperature (◦C) −0.1±0.02 (0.0001) −0.2±0.02 (0.0001) −0.2±0.03 (0.0002) −0.3±0.03 (0.0002) Skin temperature (◦C) −0.2±0.03 (0.0002) −0.3±0.03 (0.0002) −0.3±0.03 (0.0002) −0.3±0.04 (0.0002) 10 m wind speed (m s−1) −0.03±0.01 (5×10⁻⁵) −0.03±0.01 (5×10⁻⁵) −0.03±0.01 (5×10⁻⁵) −0.03±0.01 (5×10⁻⁵) 2 m relative Humidity (%) 1±0.2 (0.001) 1±0.2 (0.001) 1±0.2 (0.001) 1.1±0.2 (0.001)
Boundary layer depth (m) −19±8 (0.04) −24±8 (0.04) −24±8 (0.04) −29±8 (0.04)
Rainfall mm day−1
−0.06±2 (0.01) 0.02±1 (0.005) −0.05±2 (0.01) −0.12±1 (0.005) Atmospheric moisture flux convergence
(mm day−1)
0.1 −0.005 −0.02 0.01
Evapotranspiration (mm day−1) −0.2±0.04 (0.0002) NA −0.3±0.05 (0.0003) NA
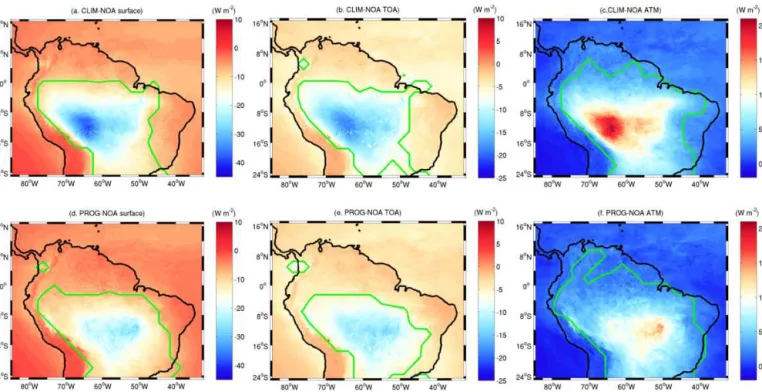
the net surface radiation in CLIM and PROG compared with NOA (see Fig. 4a and d) i.e. the BBA cools the surface. The radiative impacts are larger in magnitude in the CLIM sim-ulation than in the PROG simsim-ulation (see Table 2) due to its larger AODs, particularly in western Brazil. In PROG and CLIM the radiative effects are larger on day 2 than the day 1.
S. R. Kolusu et al.: Impacts of aerosols on short-range weather forecasts 12257
Figure 4.Impact of (top row) CLIM and (bottom row) PROG aerosol representations on(a, d)the net surface radiation,(b, e)net TOA radiation and(c, f)net atmospheric divergence averaged over the whole SAMBBA period for clear skies. Green contour shows where BBA impacts are greater than the standard error.
impact on net radiation at TOA ranges from 0 to−25 W m−2 for CLIM and 0 to−15 W m−2for PROG (again with larger impacts found in day 2 in PROG as well as in CLIM, Ta-ble 2). The negative change in net TOA radiation (consis-tent with Haywood and Boucher, 2000; Procopio et al., 2004; Sena et al., 2013) does not agree with results from Ten Ho-eve et al. (2012) which showed a positive change for higher AODs (i.e. Earth–atmosphere warming) and included both direct and indirect aerosols impacts, and the magnitude of the change in surface radiation is consistent with other stud-ies (Procopio et al., 2004; Kaufman and Koren, 2006; Rosen-feld et al., 2008; Sena et al., 2013). The increase in radia-tive absorption across the atmosphere (ATM) is between 10 and 20 W m−2(slightly greater in CLIM than PROG due to greater AODs) (Fig. 4c and f). The radiative absorption range by aerosols in the atmosphere found for the whole period is in good agreement with the value of 18.7 W m−2 found in a case study from the same period using the WRF-Chem model (which includes prognostic BBA with both direct and indirect effects from Archer-Nicholls et al., 2015).
More subtle impacts on model cloud fields are found in PROG and CLIM on horizontal scales of 1◦and a systematic
decrease in high and medium cloud fraction of around 0.1 is found in areas of highest AODs (cloud changes are described later in Sect. 3.3). This may be a result of BBA stabilising the atmosphere, as discussed in Sects. 1 and 3.3. Changes in all-sky net radiation, which include the impacts of changes in the cloud fields resulting from BBA’s direct effects, are lower in
magnitude by around a factor of two compared with clear-sky values (Table 2), but the overall patterns are similar (not shown), i.e. the reduced cloud in PROG and CLIM compared with NOA decreases the magnitude of the surface and TOA cooling induced by the BBA.
3.3 Impacts of BBA on atmospheric thermodynamics
Over the whole SAMBBA period, the decrease in net surface radiation from BBA decreases the mean 2 m air temperatures by up to 1.4◦C, but with local increases of up to about 0.5◦C due to changes in cloud (Fig. 5). In PROG, the mean impact over Box A is a 0.1◦C decrease on day 1, reaching 0.2◦C de-crease on day 2 (Table 2; effect is 0.03◦C larger in CLIM). The largest changes are found, as expected, close to regions of maximum BBA. The differences are largely restricted to the land, where air temperatures respond to the modelled sur-face energy balance. Tosca et al. (2010) showed that BBA can affect SSTs (Sea Surface Temperatures) around Indone-sia, but in all simulations here the SSTs are prescribed from reanalysis. Over land, the BBA cools the surface skin temper-ature by approximately 0.2◦C on day 1 and 0.3◦C on day 2. Over Box A 10 m wind speeds are reduced (Table 2), likely due to decreased surface sensible heat fluxes reducing down-ward mixing of momentum to the surface.
Figure 5.Impact of BBA on 2 m air temperature for day 1(a, b)and day 2(c, d). Green contour shows where BBA impacts are greater than the standard error.
2
2
4
4
6
6
8
8
8
10
10
10
12 14
14
16 16 16
18
20
longitude
Pressure (hPa)
(a. PROG−NOA)
2
2
2
4
4
4
6
6
8
8
8
10 10
10
12
12
14
14
16 16
16
18
20
−80 −70 −60 −50 −40
100
200
300
400
500
600
700
800
900
1000
80oW 70oW 60oW 50oW 40oW 24oS
16oS 8oS 0o 8oN 16oN
80oW 70oW 60oW 50oW 40oW 24oS
16oS 8oS 0o 8oN 16oN
(b. PROG−NOA)
(° C)
−0.4 −0.3 −0.2 −0.1 0 0.1 0.2 0.3 0.4
(m)
−200 −150 −100 −50 0 50 100 150 200
S. R. Kolusu et al.: Impacts of aerosols on short-range weather forecasts 12259
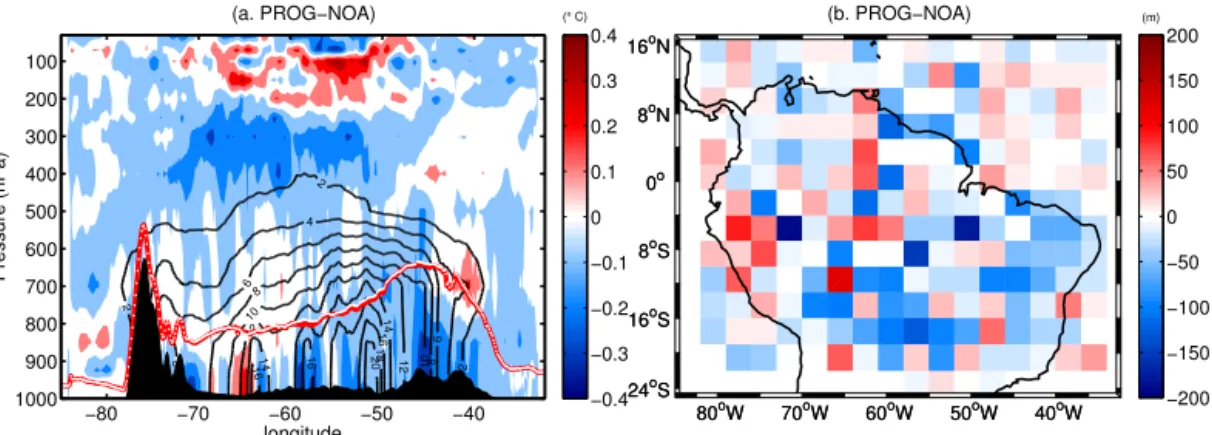
temperature cross sections averaged over the 10 to 13◦S
lat-itude belt, chosen as it is the region where surface impacts of BBA are largest in Figs. 4 and 5. Figure 6a and b are plotted for 18:00 UTC (14:00 local time) in order to show a well-developed afternoon BL, with BL depth shown for NOA (white line) and PROG (red line). BBA mass concentrations (contoured) are well mixed within the BL and extend higher in the east where the BL is deeper (around 400 hPa, compared with 500 hPa in the west). Figure 6a shows that BBA cools the lower atmosphere over land (blue colours in Fig. 6a), con-sistent with the reduced net surface radiation. This cooling is deeper in the east where the BL is deeper (reaching around 700 hPa). BBA warms the atmosphere above this (red colours in Fig. 6a) with this warming centred around the top of the BL or just above it. This warming is consistent with the di-rect radiative effects of the BBA, extending higher in the east where the BBA extends higher. The reduced net surface ra-diation from BBA reduces surface fluxes and this, combined with the increased atmospheric heating from BBA, reduces entrainment into the BL, and so BL depth reduces by up to 150 m (Fig. 6b) with a daily mean impact of 19 m over Box A (Table 2). Differences in BL height in Fig. 6b are not statistically significant but are consistent with radiative flux changes.
Figure 6 shows that the effects of BBA on temperatures above the surface layer are between−0.2 and+0.2◦C when averaged over the entire SAMBBA period (∼ ±0.4◦C in the first sub-period, with similar patterns, not shown). The ef-fect of the BBA on temperature extend well above the BBA, with effects between 100 and 400 hPa as large as those lower in the atmosphere. Overall, there is a weak cooling at the surface and above the aerosol layer at 500 hPa and warming at 150 hPa (corresponding to approximately 15 km altitude). These changes are consistent with Chen et al. (2014) who simulated radiative effects during a wild fire event over the United States using the WRF-Chem model. These are also consistent with changes in vertical motion induced by the BBA, as discussed below.
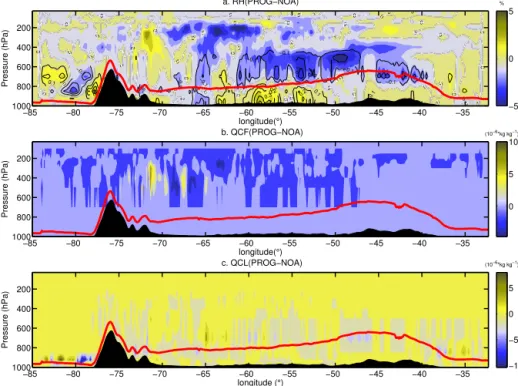
Cross sections of relative humidity (RH), ice cloud water (QCF) and liquid cloud water (QCL) are presented in Fig. 7 at 18:00 UTC in a similar manner to Fig. 6a for potential tem-perature. Differences in the RH profiles are consistent with changes in the potential temperature profile within the BL. BBA tends to decrease RH above the BL (Fig. 7a), consis-tent with the warming induced there (Fig. 6a), although dif-ferences in the patterns shown in Figs. 6a and 7 show that changes in water vapour mixing ratio are also important for RH. Consistent with the decrease in RH from BBA above the BL, BBA decreases both QCF and QCL (Fig. 7b, and c); i.e. BBA suppresses middle- and high-level clouds, consis-tent with aerosol semi-direct effects from other studies (Ja-cobson, 2002; Korontzi et al., 2004; Wu et al., 2011; Chen et al., 2014).
Figure 8a shows changes in geopotential and horizontal and vertical winds for the same cross section as Fig. 6a. The
surface cooling with heating above, induced by the BBA, which has a vertical extent that depends on the BL depth and height of the BBA and an intensity that depends on the BBA loading, induces a weak surface high pressure around 50◦W and a weak low pressure at 65◦W (Fig. 8a). Low-level wind changes are consistent with this but only reach 0.5 m s−1. The effects are stronger at 700 hPa, where the horizontal gradient in BL depth and BBA heating gives a low pressure relative to NOA at around 50◦W and a relative high pressure at 65◦W. This gives a weak anti-cyclonic circulation at this level in the runs with BBA compared with NOA (Fig. 8b), with differ-ences in winds reaching 0.6 m s−1.
Changes in winds above 400 hPa are again consistent with the changes in geopotential there and are larger than below due to the strong winds at this level in the atmosphere. Fig-ure 8a shows that BBA generates ascent and so cooling cen-tred at around 350 hPa and 65◦W and descent above,
consis-tent with the cooling and warming shown at these levels in Fig. 6a. Small changes in vertical winds (Fig. 8a white lines) cause relatively large changes in temperature at these heights in the atmosphere, which are very stable. The fact that the temperature changes at these levels are consistent with ver-tical motion induced by BBA suggests an upper-level wave response to the direct effects and heating from the BBA be-low. Similar patterns are found in the CLIM but the impacts are larger where the AOD is higher.
3.4 Evaluation of BBA impacts on the short-range forecasts
−0.2 −0.2 −0.1 −0.1 −0.1 −0.1 −0.1 −0.1 −0.1 −0.1 −0.1 −0.1 0 0 0 0 0 0 0 0 0 0 0 0 0 0 0 0 0 00 0 0 0 0 0 0 0 0 0 0 0 0 00
0 0 0 0 0 0 0 0 0 0 0 0 0 0 0 0 0 0 0 0 0 0 0 00 0
0.1 0.1 0.1
0.1 0.1
0.1 0.2 0.2
0.2
0.3
longitude(°)
Pressure (hPa)
a. RH(PROG−NOA)
−85 −80 −75 −70 −65 −60 −55 −50 −45 −40 −35
200 400 600 800 1000 % −5 0 5
longitude(°)
Pressure (hPa)
b. QCF(PROG−NOA)
−85 −80 −75 −70 −65 −60 −55 −50 −45 −40 −35
200
400
600
800
1000
(10−6*kg kg−1)
0 5 10 longitude (°) Pressure (hPa) c. QCL(PROG−NOA)
−85 −80 −75 −70 −65 −60 −55 −50 −45 −40 −35
200
400
600
800
1000
(10−6*kg kg−1)
−10 −5 0 5
Figure 7.As in Fig. 6 but differences are for(a)relative humidity (coloured), black contours are specific humidity (g kg−1),(b)ice cloud water (QCF) and(c)liquid cloud water (QCL). The red line is boundary layer depth of PROG. Topography is masked in black.
longitude (°)
Pressure (hPa)
(a. PROG−NOA)
−80 −70 −60 −50 −40
100 200 300 400 500 600 700 800 900 1000 (m) −2.5 −2 −1.5 −1 −0.5 0 0.5 1 1.5 2 2.5
80oW 70oW 60oW 50oW 40oW
24oS
16oS
8oS
0o
8oN
16oN
(b. PROG−NOA) (ms−1)
−2 −1.5 −1 −0.5 0 0.5 1 1.5 2
Figure 8. (a)Differences in geopotential height (coloured) andu,vwinds (arrows) averaged over 10–13◦S for the SAMBBA whole period for PROG-NOA; red contours show differences in vertical wind (dashed lines show negative values and solid lines positive values). Black masked area is the topography.(b)Circulation and wind speed changes at 700 hPa for PROG-NOA. White contour shows where BBA impacts are greater than the standard error.
greater differences might reveal more benefits of PROG com-pared with CLIM.
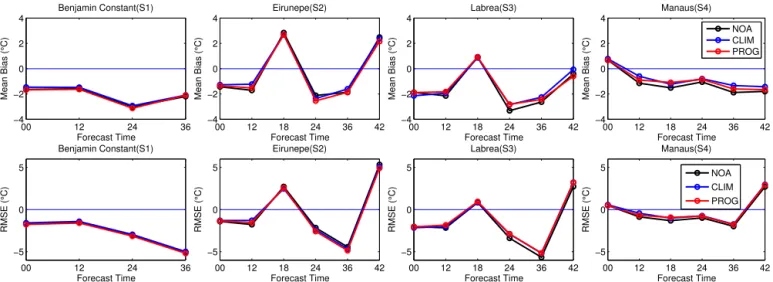
Figure 10 presents the mean bias in simulated tempera-ture and relative humidity profiles at Porto Velho and Boa Vista for the entire SAMBBA period compared to radioson-des at 00:00 and 12:00 UTC. Mean temperature errors are less than 1◦C above 850 hPa but reach 5◦C at the surface in Porto Velho. Relative humidity errors reach ±20 % and are again largest closest to the surface. These large biases at 00:00 UTC in the model near the surface are due to the model failing to accurately capture the nocturnal stable layer, a com-mon problem in regional NWP models. For temperature and
humidity, differences between the aerosol simulations are generally small apart from at Boa Vista where PROG leads to an increase in relative humidity above 850 hPa. The model biases in temperature will affect vertical mixing of aerosol, but we do not anticipate that they substantially affect mod-elled sensitivities to BBA.
3.5 Impacts of BBA on precipitation and the water budget
S. R. Kolusu et al.: Impacts of aerosols on short-range weather forecasts 12261
00 12 24 36
−4 −2 0 2 4 Forecast Time
Mean Bias (
°
C)
Benjamin Constant(S1)
00 12 18 24 36 42
−4 −2 0 2 4 Forecast Time
Mean Bias (
°
C)
Eirunepe(S2)
00 12 18 24 36 42
−4 −2 0 2 4 Forecast Time
Mean Bias (
°
C)
Labrea(S3)
00 12 18 24 36 42
−4 −2 0 2 4 Forecast Time
Mean Bias (
° C) Manaus(S4) NOA CLIM PROG
00 12 24 36
−5 0 5 Forecast Time RMSE ( ° C) Benjamin Constant(S1)
00 12 18 24 36 42
−5 0 5 Forecast Time RMSE ( ° C) Eirunepe(S2)
00 12 18 24 36 42
−5 0 5 Forecast Time RMSE ( ° C) Labrea(S3)
00 12 18 24 36 42
−5 0 5 Forecast Time RMSE ( ° C) Manaus(S4) NOA CLIM PROG
Figure 9.Mean bias and RMS error of modelled temperature at S1, S2, S3 and S4 locations (Fig. 1), averaged over the whole period.
−2 0 2 4 6
500 600 700 800 900 1000
Temperature (°C)
Pressure (hPa)
Porto Velho 00UTC (P1)
−30 −20 −10 0 10
500 600 700 800 900 1000 RH (%) Pressure (hPa)
Porto Velho 00UTC (P1)
−1 0 1 2 3
500 600 700 800 900 1000
Temperature (°C)
Pressure (hPa)
Porto Velho 12UTC (P1)
NOA−Obs CLIM−Obs PROG−Obs
−20 0 20 40
500 600 700 800 900 1000 RH (%) Pressure (hPa)
Porto Velho 12UTC (P1)
NOA−Obs CLIM−Obs PROG−Obs
−1.5 −1 −0.5 0 0.5
500 600 700 800 900 1000
Temperature (°C)
Pressure (hPa)
Boa Vista 00UTC (P2)
−10 −5 0 5 10
500 600 700 800 900 1000 RH (%) Pressure (hPa)
Boa Vista 00UTC (P2)
−1 0 1 2
500 600 700 800 900 1000 Temperature (°C) Pressure (hPa)
Boa Vista 12UTC (P2)
−20 −10 0 10
500 600 700 800 900 1000 RH (%) Pressure (hPa)
Boa Vista 12UTC (P2)
Figure 10.Profiles of modelled minus observed temperature and relative humidities from radiosondes at P1 and P2 (locations shown in Fig. 1).
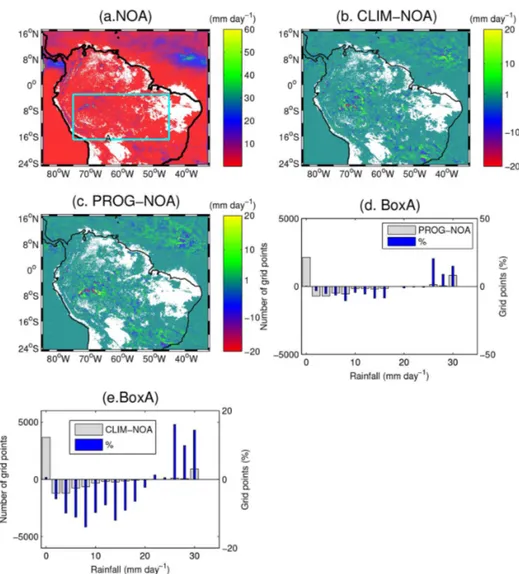
impact on clouds and convection. Figure 11a shows the mean precipitation rate averaged over the whole campaign for the NOA simulation. There are large local differences in mean rainfall between the three simulations (NOA, PROG, CLIM) (Fig. 11b and c) mainly due to changes in the location of pre-cipitation events. When smoothed over a 150 km grid these changes are still around 4 mm day−1, although the change in the regional mean is small: for Box A (Fig. 11a), BBA in PROG or CLIM reduces rain by around 0.055 mm day−1 compared with NOA (mean rainfall is 1.2 mm day−1).
Pre-cipitation reductions of∼5 % found in this study are there-fore slightly greater than the Tosca et al. (2013) study which shows a (2 %) decrease over Amazonia.
Figure 11.The whole SAMBBA period mean rainfall(a)and differences in rainfall(b, c); white region shows masked 0 values(a, b, c)
and changes to frequency distributions of precipitation(d–e)from BBA to NOA for box A. Blue bars are in percentage with respect to differences.
results are statistically significant at 98 % confidence level. This effect on rain rates may be linked to BBA increasing stability in the lower atmosphere due to reduced net surface flux and increased radiative warming of the atmosphere.
To further explore the mechanisms for simulated changes in rainfall we calculated the water budget over Box A for all model simulations on day 1 and day 2. BBA reduces the net radiation, which causes a decrease in surface evapotranspi-ration (0.2 and 0.3 mm day−1in PROG and CLIM, a 5 and 6 % decrease respectively; Table 2). The radiative heating from the BBA enhances the stability of the atmosphere gen-erally reduces precipitation by 0.05 to 0.12 mm day−1except in day 2 of PROG, which shows a small (0.02 mm day−1) increase. The change in water vapour convergence into box A is unclear, with small increases and decreases in PROG and CLIM for days 1 and 2 (−0.02 to+0.1 mm day−1). The overall consequence is that the change in water budget of box A from BBA is dominated by the reduction in surface
evapotranspiration resulting from the decreased net surface radiation. Therefore, the overall net effect of BBA is a dry-ing of the atmosphere in the Amazonian region largely due to reduced latent heat fluxes. The drying of the atmosphere due to BBA will be further investigated in future studies using the UKCA model, including indirect radiative effects.
4 Summary and conclusions
S. R. Kolusu et al.: Impacts of aerosols on short-range weather forecasts 12263
from the first 2 days of forecasts initialised from meteoro-logical analyses.
The modelled BBA reduced clear-sky net radiation at the TOA by 8 W m−2over the region studied and reduced clear-sky net radiation at the surface by on average of 15 W m−2, with direct warming of the atmosphere due to absorption of solar radiation of 7 W m−2. BBA reduced cloud cover and all-sky radiative effects were lower than clear-sky effects:
−4 and −9 W m−2 for the TOA and surface net radiative effects respectively. The reduced net surface radiation from BBA cooled the mean 2 m air temperature by on average 0.1◦C. The temperature changes found here are less than the
∼ −0.3◦C changes found by Wu et al. (2011) using WRF-Chem model over the South America during the dry period of September 2011. This difference in results is consistent with the higher AODs in the Wu et al. (2011) study. We also expect BBA impacts to be greater in a more representative biomass burning year as the 2012 biomass burning season had lower than average AOD values.
The BBA cools the lower BL by around 0.2◦C but heats the atmosphere above by up to 0.2◦C in the elevated BBA layer that extends to between 600 and 400 hPa. The cool-ing of the BL is consistent with the BBA reduccool-ing surface sensible heat fluxes. This reduces BL growth and results in a decrease in the mean BL depth by around 19 m. The BBA induces a weak (0.2 m s−1) cyclonic circulation in the lower BL, with a weak anticyclonic circulation above (up to 0.6 m s−1) due to the horizontal gradients in BBA heating. Effects of BBA are communicated to the upper troposphere due to changes in uplift and subsidence affecting mean upper tropospheric temperatures by up to+0.2◦C.
The evaluation against observations shows that the model simulations that included aerosols gave a better representa-tion of near-surface air temperature and relative humidity than models without aerosols (mean correlation of 0.79 and 0.72 in NOA compared to 0.83 and 0.79 in PROG for near-surface air temperature and RH respectively with 99 % sig-nificant confidence level). However, the improvements were small compared with model error. The difference in results between simulations with a climatological and prognostic representation of aerosols were even smaller and statistically insignificant. Similarly, comparisons with radiosondes show negligible differences from including BBA compared with model error. These results suggest that while inclusion of a realistic representation of BBA has impacts on the model radiation fields, improvements on the mean forecast skill are small at the 2-day forecast lead times analysed in this study. This is most likely due to the strong constraint of the 3D-VAR data assimilation at short forecast lead times. In-deed impacts on the meteorology on day 2 of the forecast were larger than on day 1 (Table 2), indicating that prog-nostic BBA might have larger impacts on longer medium-to-seasonal-range weather forecast and on climate simulations. Future studies within SAMBBA will investigate this using individual case studies from the SAMBBA period.
The inclusion of a prognostic BBA scheme gives a supe-rior aerosol forecast compared to an aerosol climatology but in this study did not improve the mean model skill for tem-perature and relative humidity significantly over that of the BBA climatology. This reiterates the findings of Mulcahy et al. (2014) that the inclusion of realistic aerosol–radiative interactions are of key importance in operational NWP fore-casting systems but that in many cases a monthly varying speciated aerosol climatology can provide sufficient skill. However, given the highly variable nature of BB emissions the more advanced fully prognostic treatment of BBA is re-quired in order to provide an accurate aerosol prediction ca-pability.
In this study PROG and CLIM BBA tended to reduce mean precipitation by around 5 % (0.06 mm day−1; Ta-ble 2), although PROG gave a small increase on day 2 (0.02 mm day−1). It can be speculated that such reductions may lead to more biomass burning over Amazonia (Ara-gao et al., 2014). However, it should be noted that aerosol– cloud feedbacks on cloud brightness, lifetime and precipi-tation efficiency, which may alter the sensitivity of precip-itation to BBA, were not modelled in this study. The BBA also led to changes in the location of convection, resulting in localised changes in precipitation of around 4 mm day−1, when smoothed on a 150 km scale. Furthermore, the BBA decreased the frequency of moderate rain rates and increased the frequency of both no rain and high rain rates. These changes in the distribution of rainfall intensity may be linked to the stabilisation of the lower atmosphere by BBA through the direct radiative effects.
The water vapour budget analysis over the Amazonian re-gion reveals that by reducing the net surface radiation, the BBA reduces surface latent heat fluxes by 0.2 mm day−1. There is a drying of the atmosphere as this reduction in latent heat fluxes is not compensated by the reduced precipitation (around−0.06 mm day−1) or increased water vapour conver-gence (−0.02 to+0.1 mm day−1). Such impacts of BBA on the water budget of Amazonia will be investigated in future SAMBBA modelling studies using longer simulations that are more free to evolve away from their initial state.
Acknowledgements. The MODIS data used in this study were
Technology for making the SAMBBA measurement campaign possible. We thank Joel Brito from the University of Sao Paulo for providing surface observation over Amazonas. The SAMBBA project was funded by the Met Office and NERC with grant number NE/J009822/1. We acknowledge use of the MONSooN system, a collaborative facility supplied under the Joint Weather and Climate Research Programme, which is a strategic partnership between the Met Office and NERC. We thank the three anonymous reviewers and editor for their comments on our manuscript.
Edited by: G. Myhre
References
Andreae, M. and Rosenfeld, D.: Aerosol–cloud–precipitation inter-actions. Part 1. The nature and sources of cloud-active aerosols, Earth-Sci. Rev., 89, 13–41, 2008.
Aragao, L. E., Poulter, B., Barlow, J. B., Anderson, L. O., Malhi, Y., Saatchi, S., Phillips, O. L., and Gloor, E.: Environmental change and the carbon balance of Amazonian forests, Biol. Rev., 89, 913–931, 2014.
Archer-Nicholls, S., Lowe, D., Schultz, D. M., and McFiggans, G.: Aerosol–radiation–cloud interactions in a regional cou-pled model: the effects of convective parameterisation and resolution, Atmos. Chem. Phys. Discuss., 15, 27449–27499, doi:10.5194/acpd-15-27449-2015, 2015.
Artaxo, P., Rizzo, L. V., Brito, J. F., Barbosa, H. M., Arana, A., Sena, E. T., Cirino, G. G., Bastos, W., Martin, S. T., and An-dreae, M. O.: Atmospheric aerosols in Amazonia and land use change: from natural biogenic to biomass burning conditions, Faraday Discuss., 165, 203–235, 2013.
Bellouin, N., Rae, J., Jones, A., Johnson, C., Haywood, J., and Boucher, O.: Aerosol forcing in the Climate Model Intercompar-ison Project (CMIP5) simulations by HadGEM2-ES and the role of ammonium nitrate, J. Geophys. Res.-Atmos., 116, D20206, doi:10.1029/2011JD016074, 2011.
Bence, J. R.: Analysis of short time series: correcting for autocorre-lation, Ecology, 76, 628–639, doi:10.2307/1941218, 1995. Bowman, D. M. J. S., Balch, J. K., Artaxo, P., Bond, W. J., Carlson,
J. M., Cochrane, M. A., D’Antonio, C. M., DeFries, R. S., Doyle, J. C., Harrison, S. P., Johnston, F. H., Keeley, J. E., Krawchuk, M. A., Kull, C. A., Marston, J. B., Moritz, M. A., Prentice, I. C., Roos, C. I., Scott, A. C., Swetnam, T. W., van der Werf, G. R., and Pyne, S. J.: Fire in the Earth system, Science, 324, 481–484, 2009.
Brito, J., Rizzo, L. V., Morgan, W. T., Coe, H., Johnson, B., Hay-wood, J., Longo, K., Freitas, S., Andreae, M. O., and Artaxo, P.: Ground-based aerosol characterization during the South Amer-ican Biomass Burning Analysis (SAMBBA) field experiment, Atmos. Chem. Phys., 14, 12069–12083, doi:10.5194/acp-14-12069-2014, 2014.
Brown, A., Beare, R., Edwards, J., Lock, A., Keogh, S., Milton, S., and Walters, D.: Upgrades to the boundary-layer scheme in the Met Office numerical weather prediction model, Bound.-Lay. Meteorol., 128, 117–132, 2008.
Chen, D., Liu, Z., Schwartz, C. S., Lin, H.-C., Cetola, J. D., Gu, Y., and Xue, L.: The impact of aerosol optical depth assimila-tion on aerosol forecasts and radiative effects during a wild fire
event over the United States, Geosci. Model Dev., 7, 2709–2715, doi:10.5194/gmd-7-2709-2014, 2014.
Collins, W. J., Bellouin, N., Doutriaux-Boucher, M., Gedney, N., Halloran, P., Hinton, T., Hughes, J., Jones, C. D., Joshi, M., Lid-dicoat, S., Martin, G., O’Connor, F., Rae, J., Senior, C., Sitch, S., Totterdell, I., Wiltshire, A., and Woodward, S.: Develop-ment and evaluation of an Earth-System model – HadGEM2, Geosci. Model Dev., 4, 1051–1075, doi:10.5194/gmd-4-1051-2011, 2011.
Cook, J. and Highwood, E.: Climate response to tropospheric ab-sorbing aerosols in an intermediate general-circulation model, Q. J. Roy. Meteorol. Soc., 130, 175–191, 2004.
Crutzen, P. J. and Andreae, M. O.: Biomass burning in the trop-ics: Impact on atmospheric chemistry and biogeochemical cy-cles, Science, 250, 1669–1678, 1990.
Crutzen, P. J. and Zimmermann, P. H.: The changing photochem-istry of the troposphere, Tellus B, 43, 136–151, 1991.
Darbyshire, E. and Johnson, B.: The South American Biomass Burning Analysis (SAMBBA) Field Experiment, September– October 2012, Brazil: Summary of Research Flights, The Uni-versity of Manchester and the Met Office, available on request from the authors, 1–180, 2013.
Davies, T., Cullen, M., Malcolm, A., Mawson, M., Staniforth, A., White, A., and Wood, N.: A new dynamical core for the Met Office’s global and regional modelling of the atmosphere, Q. J. Roy. Meteorol. Soc., 131, 1759–1782, 2005.
Edwards, J. and Slingo, A.: Studies with a flexible new radiation code. I: Choosing a configuration for a large-scale model, Q. J. Roy. Meteorol. Soc., 122, 689–719, 1996.
Gregory, D. and Rowntree, P.: A mass flux convection scheme with representation of cloud ensemble characteristics and stability-dependent closure, Mon. Weather Rev., 118, 1483–1506, 1990. Haywood, J. and Boucher, O.: Estimates of the direct and
indi-rect radiative forcing due to tropospheric aerosols: a review, Rev. Geophys.-Richmond Virginia then Washington, 38, 513– 543, 2000.
Hoerger, M.: ZH: an updated version of Steiger’s Z and web-based calculator for testing the statistical significance of the difference between dependent correlations, retrieved 1 March 2014, 2013. Holben, B. N., Eck, T. F., Slutsker, I., Tanré, D., Buis, J. P.,
Set-zer, A., Vermote, E., Reagan, J. A., Kaufman, Y. J., Nakajima, T., Lavenu, F., Jankowiak, I., and Smirnov, A.: AERONET – a federated instrument network and data archive for aerosol char-acterization, Remote Sens. Environ., 66, 1–16, 1998.
Ichoku, C., Remer, L. A., Kaufman, Y. J., Levy, R., Chu, D. A., Tanré, D., and Holben, B. N.: MODIS observation of aerosols and estimation of aerosol radiative forcing over southern Africa during SAFARI 2000, J. Geophys. Res.-Atmos., 108, 8499, doi:10.1029/2002JD002366, 2003.
Ichoku, C., Remer, L. A., and Eck, T. F.: Quantitative evaluation and intercomparison of morning and afternoon Moderate Resolu-tion Imaging Spectroradiometer (MODIS) aerosol measurements from Terra and Aqua, J. Geophys. Res.-Atmos., 110, D10S03, doi:10.1029/2004JD004987, 2005.
S. R. Kolusu et al.: Impacts of aerosols on short-range weather forecasts 12265
Kaiser, J. W., Heil, A., Andreae, M. O., Benedetti, A., Chubarova, N., Jones, L., Morcrette, J.-J., Razinger, M., Schultz, M. G., Suttie, M., and van der Werf, G. R.: Biomass burning emis-sions estimated with a global fire assimilation system based on observed fire radiative power, Biogeosciences, 9, 527–554, doi:10.5194/bg-9-527-2012, 2012.
Kaufman, Y. J. and Koren, I.: Smoke and pollution aerosol effect on cloud cover, Science, 313, 655–658, 2006.
King, M. D., Menzel, W. P., Kaufman, Y. J., Tanré, D., Gao, B.-C., Platnick, S., Ackerman, S. A., Remer, L. A., Pincus, R., and Hubanks, P. A.: Cloud and aerosol properties, precipitable water, and profiles of temperature and water vapor from MODIS, IEEE T. Geosci. Remote, 41, 442–458, 2003.
Korontzi, S., Roy, D. P., Justice, C. O., and Ward, D. E.: Modeling and sensitivity analysis of fire emissions in southern Africa dur-ing SAFARI 2000, Remote Sens. Environ., 92, 376–396, 2004. Lamarque, J.-F., Bond, T. C., Eyring, V., Granier, C., Heil, A.,
Klimont, Z., Lee, D., Liousse, C., Mieville, A., Owen, B., Schultz, M. G., Shindell, D., Smith, S. J., Stehfest, E., Van Aar-denne, J., Cooper, O. R., Kainuma, M., Mahowald, N., Mc-Connell, J. R., Naik, V., Riahi, K., and van Vuuren, D. P.: His-torical (1850–2000) gridded anthropogenic and biomass burning emissions of reactive gases and aerosols: methodology and ap-plication, Atmos. Chem. Phys., 10, 7017–7039, doi:10.5194/acp-10-7017-2010, 2010.
Lorenc, A. C., Ballard, S. P., Bell, R. S., Ingleby, N. B., Andrews, P. L. F., Barker, D. M., Bray, J. R., Clayton, A. M., Dalby, T., Li, D., Payne, T. J., and Saunders, F. W.: The Met. Office global three-dimensional variational data assimilation scheme, Q. J. Roy. Me-teorol. Soc., 126, 2991–3012, 2000.
Marlier, M. E., DeFries, R. S., Voulgarakis, A., Kinney, P. L., Ran-derson, J. T., Shindell, D. T., Chen, Y., and Faluvegi, G.: El Nino and health risks from landscape fire emissions in southeast Asia, Nat. Clim. Change, 3, 131–136, 2013.
Martin, S. T., Andreae, M. O., Artaxo, P., Baumgardner, D., Chen, Q., Goldstein, A. H., Guenther, A., Heald, C. L., Mayol-Bracero, O. L., McMurry, P. H., Pauliquevis, T., Pöschl, U., Prather, K. A., Roberts, G. C., Saleska, S. R., Silva-Dias, M. A., Spracklen, D. V., Swietlicki, E., and Trebs, I.: Sources and properties of Amazonian aerosol particles, Rev. Geophys., 48, RG2002, doi:10.1029/2008RG000280, 2010.
Mulcahy, J. P., Walters, D. N., Bellouin, N., and Milton, S. F.: Impacts of increasing the aerosol complexity in the Met Of-fice global numerical weather prediction model, Atmos. Chem. Phys., 14, 4749–4778, doi:10.5194/acp-14-4749-2014, 2014. Procopio, A., Artaxo, P., Kaufman, Y., Remer, L., Schafer, J., and
Holben, B.: Multiyear analysis of Amazonian biomass burn-ing smoke radiative forcburn-ing of climate, Geophys. Res. Lett., 31, L03108, doi:10.1029/2003GL018646, 2004.
Ramanathan, V., Crutzen, P., Kiehl, J., and Rosenfeld, D.: Aerosols, climate, and the hydrological cycle, Science, 294, 2119–2124, 2001.
Rawlins, F., Ballard, S. P., Bovis, K. J., Clayton, A. M., Li, D., In-verarity, G. W., and Payne, T. J.: The Met Office global four-dimensional variational data assimilation scheme, Q. J. Roy. Me-teorol. Soc., 133, 347–362, 2007.
Reid, J. S., Eck, T. F., Christopher, S. A., Koppmann, R., Dubovik, O., Eleuterio, D. P., Holben, B. N., Reid, E. A., and Zhang, J.: A review of biomass burning emissions part III: intensive optical
properties of biomass burning particles, Atmos. Chem. Phys., 5, 827–849, doi:10.5194/acp-5-827-2005, 2005.
Rosário, N. E., Longo, K. M., Freitas, S. R., Yamasoe, M. A., and Fonseca, R. M.: Modeling the South American regional smoke plume: aerosol optical depth variability and surface short-wave flux perturbation, Atmos. Chem. Phys., 13, 2923–2938, doi:10.5194/acp-13-2923-2013, 2013.
Rosenfeld, D., Lohmann, U., Raga, G. B., O’Dowd, C. D., Kul-mala, M., Fuzzi, S., Reissell, A., and Andreae, M. O.: Flood or drought: how do aerosols affect precipitation?, Science, 321, 1309–1313, 2008.
Sena, E. T., Artaxo, P., and Correia, A. L.: Spatial variability of the direct radiative forcing of biomass burning aerosols and the effects of land use change in Amazonia, Atmos. Chem. Phys., 13, 1261–1275, doi:10.5194/acp-13-1261-2013, 2013.
Simmons, A., Uppala, S., Dee, D., and Kobayashi, S.: ERA-interim: new ECMWF reanalysis products from 1989 onwards, ECMWF Newsletter, 110, 25–35, 2007.
Smith, R.: A scheme for predicting layer clouds and their water content in a general circulation model, Q. J. Roy. Meteorol. Soc., 116, 435–460, 1990.
Ten Hoeve, J. E., Jacobson, M. Z., and Remer, L. A.: Comparing results from a physical model with satellite and in situ obser-vations to determine whether biomass burning aerosols over the Amazon brighten or burn off clouds, J. Geophys. Res.-Atmos., 117, D08203, doi:10.1029/2011JD016856, 2012.
Tosca, M. G., Randerson, J. T., Zender, C. S., Flanner, M. G., and Rasch, P. J.: Do biomass burning aerosols intensify drought in equatorial Asia during El Niño?, Atmos. Chem. Phys., 10, 3515– 3528, doi:10.5194/acp-10-3515-2010, 2010.
Tosca, M. G., Randerson, J. T., and Zender, C. S.: Global im-pact of smoke aerosols from landscape fires on climate and the Hadley circulation, Atmos. Chem. Phys., 13, 5227–5241, doi:10.5194/acp-13-5227-2013, 2013.
van der Werf, G. R., Randerson, J. T., Giglio, L., Collatz, G. J., Mu, M., Kasibhatla, P. S., Morton, D. C., DeFries, R. S., Jin, Y., and van Leeuwen, T. T.: Global fire emissions and the contribution of deforestation, savanna, forest, agricultural, and peat fires (1997– 2009), Atmos. Chem. Phys., 10, 11707–11735, doi:10.5194/acp-10-11707-2010, 2010.
Walters, D. N., Best, M. J., Bushell, A. C., Copsey, D., Edwards, J. M., Falloon, P. D., Harris, C. M., Lock, A. P., Manners, J. C., Morcrette, C. J., Roberts, M. J., Stratton, R. A., Webster, S., Wilkinson, J. M., Willett, M. R., Boutle, I. A., Earnshaw, P. D., Hill, P. G., MacLachlan, C., Martin, G. M., Moufouma-Okia, W., Palmer, M. D., Petch, J. C., Rooney, G. G., Scaife, A. A., and Williams, K. D.: The Met Office Unified Model Global Atmo-sphere 3.0/3.1 and JULES Global Land 3.0/3.1 configurations, Geosci. Model Dev., 4, 919–941, doi:10.5194/gmd-4-919-2011, 2011.
Ward, D. S., Kloster, S., Mahowald, N. M., Rogers, B. M., Ran-derson, J. T., and Hess, P. G.: The changing radiative forc-ing of fires: global model estimates for past, present and fu-ture, Atmos. Chem. Phys., 12, 10857–10886, doi:10.5194/acp-12-10857-2012, 2012.
Wu, L., Su, H., and Jiang, J. H.: Regional simulations of deep con-vection andbiomass burning over South America: 2. Biomass burning aerosol effects on clouds and precipitation, J. Geophys. Res.-Atmos., 116, D17209, doi:10.1029/2011JD016106, 2011. Yu, H., Liu, S., and Dickinson, R.: Radiative effects of aerosols
on the evolution of the atmospheric boundary layer, J. Geophys. Res.-Atmos., 107, 4142, doi:10.1029/2001JD000754, 2002. Zhang, Y., Fu, R., Yu, H., Dickinson, R. E., Juarez, R. N.,
Chin, M., and Wang, H.: A regional climate model study of how biomass burning aerosol impacts land-atmosphere interac-tions over the Amazon, J. Geophys. Res.-Atmos., 113, D14S15, doi:10.1029/2007JD009449, 2008.
Zhang, Y., Fu, R., Yu, H., Qian, Y., Dickinson, R.,