ISSN 1546-9239
© 2007 Science Publications
Corresponding Author: Mohammad A.K.Alia, College of Engineering Technology, Al-Balqa' Applied University
Investigation of An Acoustic Temperature Transducer and its
Application for Heater Temperature Measurement
Mohammad A.K. Alia and Tariq Al Mograbi
College of Engineering Technology, Al-Balqa' Applied University, Jordan
Abstract: Recent developments in temperature measurement have encouraged researchers to develop low-cost, simple structure, computerized generic transducers for environmental monitoring and industrial process control. The research presents a computerized technique which allows to measure temperature according to the variation of acoustic velocity (frequency) in a closed waveguide. Signal conditioning and processing was carried out using labVIEW (G Language) VIs. In order to evaluate the time characteristic of the transducer its response was compared with that of a reference detector (PT 100) for the same step input. Static characteristics of the transducer show a quasi-linear relationship between the measured temperature and the resonance frequency. Results of practical experiments show that in order to improve the response curve of the transducer and decrease the rising time interval it is advisable to implement thin-wall glass tubes or another material with lower thermal impedance.
Key words: Acoustic temperature transducer, LabVIEW VIs, static characteristic, dynamic characteristic, standing wave
INTRODUCTION
Measurement and control of temperature is still considered as one of the most common engineering activities. That is because the temperature of technological mechanisms, machines and systems has a direct impact on their efficiency and performance. This explains why research and development in the field of temperature measurement and control is a viable continuous process. For temperature measurement and control different types of transducers are utilized. Every transducer type has its temperature measurement range and specifications and also it has a relatively complex circuitry which is normally used for signal conditioning and processing. So the need for a generic transducer with a wide range of temperature measurement and simple conditioning circuit is still an existing target. This unifies the grade and type of utilized temperature transducers and decreases the cost of measurement and control circuit and equipment. The work described in this paper investigates the possibility of using an acoustic temperature transducer (ATT) in order to meet the above-mentioned criteria.
The ATT is a device based on the characteristics of sound waves in a wave- guided media, in which sound wave is guided physically. The basic principle of the ATT is that speed of sound is proportional to the absolute temperature, which is also related to the
frequency of the sound wave, assuming existence of a constant wavelength. A constant wavelength could be obtained if the wave is standing (Standstill). The standing wave may be generated by utilizing the principle of acoustic resonance, which is characterized by the use of a speaker- microphone combination. The measured signal from the microphone is filtered and the signal frequency is measured using computer software. Taking in consideration the advantages of using LabVIEW[1], this software was utilized in order to measure and plot temperature. Utilizing such transducer setup, one can measure temperature, log data to computer and make use of measured variable for further display and control purposes. Concerning the measurement range it is only limited by the tube material type, which implies the possibility of transducer applications for high range temperature measurements. The suggested ATT was tested to measure the temperature of a heater in a training kit[2] made by De-Lorenzo, in which the temperature was also measured by using PT 100 transducer and then compared with the output of ATT.
The sound wave is a longitudinal wave in which the wave oscillates along the direction of propagation. For a traveling wave of speed (C), frequency (f) and wavelength ( λ ), the following equation holds:
The speed varies depending on the medium through which the sound wave passes. If the medium is air, the speed varies depending on atmospheric conditions; the most important factor is temperature. The humidity has very little effect on the speed of sound, while the static sound pressure (air pressure) has none.
For an ideal gas, the speed of sound could be given by the relation[3]:
.
M T R
C= γ (2)
Where:
M- Molecular weight of gas C- Speed of sound [m/s]
γ- Specific heat ratio R- Specific gas constant
T- Atmospheric temperature [k°]
With an ideal gas, the speed of sound (C) depends on temperature only, not on the pressure. Air is almost an ideal gas. For air:
γ = 1.402 and R/M = 287 J/(Kg.k)
For a standing wave in an air column the following equation applies:
n L n= 2
λ
Considering
n n
c f
λ
= , we find
L c n fn
2
= (3)
Where n = 1, 2, 3, 4
L = the length of an air column (tube).
We shall consider the basic resonance circuit shown in Fig. 1.
The resonance of the tube of air is related to the length of the tube (L) and whether it has closed or open ends. An open end tube will reflect the wave with no inversion. This means that a compression wave will be reflected as a compression wave. But a closed end tube will invert the reflected wave. In other words a compression wave will be reflected as a rarefaction wave. Tubes with both ends closed resonate at the frequency given in equation (3). After substituting equation (1) in equation (3), we find:
M RT L n
fres γ
2
= (4)
Where n- is the order of the harmonic.
This equation gives direct dependency between the out put frequency of the signal coming from the microphone and the temperature of the air filled tube. Consequently, this air filled tube could be used as a temperature transducer.
Fig. 1: Speaker-Mic resonance circuit
Fig. 2: Block diagram of the ATT
Fig. 3: Typical modern sound card parts
Overview of the acoustic temperature transducer: The block diagram of the ATT is shown in Fig. 2 the detector consist of a U-shaped glass tube, a microphone, a speaker, sound card and PC software.
The air filled tube was fixed inside the heater so that the center of the curved part of it is located in the most effective area in the heater. The U-shaped tube is made of glass because glass can easily be formed in various dimensions and that the inner diameter of the tube can be maintained constant, which has a high influence on the response of the transducer. It is important to note that glass is not the best material for the purpose because it has relatively high thermal impedance, which slows down that dynamic response of the transducer. A better material would be copper ar other metal which has a lower thermal impedance. Shaping the copper tubes in our laboratory with a high degree of accuracy was not possible.
* Model A: length = 20 Cm, inner diameter=2.0 mm * Model B: length = 20 Cm, inner diameter= 2.5 mm * Model C: length = 26 Cm, inner diameter= 1.5 mm * Model D: length = 10 Cm, inner diameter= 2.5 mm The variation of the length of the tube (L) has an inverse effect on the transducer sensitivity. This is obvious from equation (4). The static characteristics of these models were found experimentally, as shown later.
Concerning the speaker, it is an electrodynamics type, which involves good linearity and good frequency response. The used microphone is a capacitive type. This also has excellent frequency response, large dynamic pressure range and good linearity.
The sound card is a computer expansion card that can input and output sound under program control. It is used as an interface unit between microphone and speaker signals. The main components of the sound card are shown in Fig. 3, where:
* ROM includes the present wave-table synthesizer samples
* RAM-is for down loadable wave-table instruments. Wave table synthesizer makes sounds out of the samples in ROM and RAM.
* Codec- performs the A/D and D/A conversion of the audio signals
* FM synthesizer-plays FM sounds (for original sound blaster / Adlib compatibility)
* Mixer-is an analog mixer IC. It mixes together the sound from various inputs to (microphone, aux input, wave-table synthesizer, FM synthesizer, CD-RM audio) and then sends the mix to line level and speaker outputs.
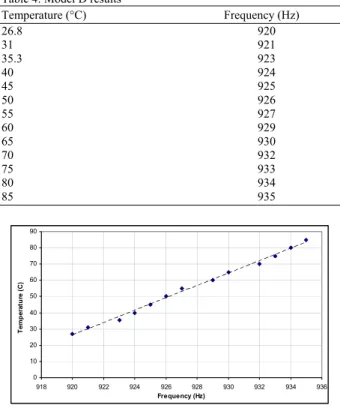
The designed VI: LabVIEW was used to perform signal filtering and manipulation. The signal from the microphone is acquired and filtered by taking the first harmonic of the signal and then the frequency is measured and presented in a graph as a function of time. The VI includes a panel board and a block diagram. The panel board contains two graphs. The upper one is for plotting the temperature (°C) with respect to time. This temperature is measured using PT 100 detector, then acquired using NI interface card (PC1-MIO-16E-1). The lower graph plots the acquired frequency from ATT with respect to time also. The block diagram is shown in Fig. 4. The elements of the block diagram are:
* Acquire signal from sound card-with a sampling rate of 44100 Hz, 16 bit mono signal.
* Band pass filter- to remove higher order harmonics of the signal and keeping only the first harmonic.
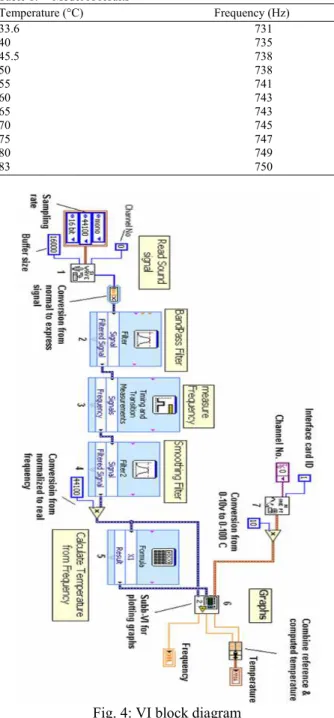
Table 1: Model A results
Temperature (°C) Frequency (Hz)
33.6 731 40 735 45.5 738
50 738 55 741 60 743 65 743 70 745 75 747 80 749 83 750
Fig. 4: VI block diagram
* Measure frequency- to measure the signal frequency
* Smoothing filter- to smooth and reduce disturbance in the measured frequency.
Fig. 5: Sub VI block diagram
0 10 20 30 40 50 60 70 80 90
730 735 740 745 750 755
Frequency (Hz)
T
e
m
p
er
at
u
re
(
C
)
Fig. 6: Model A static characteristics
T = 2.1192 f - 1590.3 [°C] (5) * Graphs plot – a sub- VI used to plot the signals of
the actual temperature, calculated temperature and frequency with respect to time. The sub-VI is given in Fig. 5.
* Acquire actual temperature – to acquire the temperature from the PT 100 detector by using NI interface card.
Static and dynamic characteristics of ATT: After assembling the ATT at the laboratory of instrumentation and process control, testing of static and dynamic characteristics took place. The static characteristics demonstrate the relation ship between the temperature and the frequency of the sound wave. Linear fitting of the results, accuracy calculation and comparison between different models was carried out also.
Static characteristic of Model (A)
The results of experiment are given in Table 1. Variation of the frequency ∆f = 750-731= 19Hz Variation of the temperature ∆T = 83-33.6= 49.4 °C Sensitivity
] / [ 384 . 0 4 . 49
19
C Hz T
f
S = = °
∆ ∆ =
Figure 6 represents a linear fitting approximation. The result was:
Table 2: Model B results
Temperature (°C) Frequency (Hz)
27 765 35 768
40 770 45 772 50 774 55 776 60 777 65 779 70 781 75 785 80 788 85 792 90 795
0 10 20 30 40 50 60 70 80 90 100
760 765 770 775 780 785 790 795 800
Frequency (Hz)
T
emp
er
at
u
re
Fig. 7: Model B static characteristics
Table 3: Model C results
Temperature (°C) Frequency (Hz)
29.4 733
35 735
40 736
45 738
50 739
55 741
60 742
65 743
70 744
75 745
80 746
0 10 20 30 40 50 60 70 80 90
732 734 736 738 740 742 744 746 748
Frequency (Hz)
Temperature
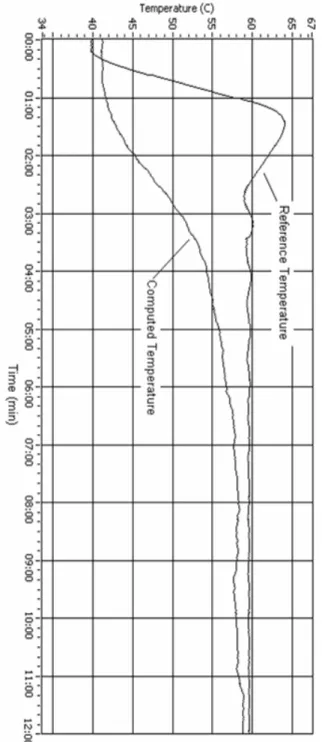
Table 4: Model D results
Temperature (°C) Frequency (Hz)
26.8 920
31 921
35.3 923 40 924 45 925 50 926 55 927 60 929 65 930 70 932 75 933 80 934 85 935
0 10 20 30 40 50 60 70 80 90
918 920 922 924 926 928 930 932 934 936 Frequency (Hz)
T
em
p
er
a
tu
re (
C
)
Fig. 9: Model D static characteristics T = 2.749 f -1980 (°C), Where R2
= 0.9809
Static characteristic of model (B): The results of experiment are given in Table 2.
Variation of the frequency ∆f = 795-765 = 30 Hz Variation of the temperature ∆T = 90 -27 = 63 °C
Sensitivity 0.476 [ / ]
63 30
C Hz T
f
S = = °
∆ ∆ =
Model (B) static characteristic is shown in Fig. 7 the linear interpolation of the data results in the following relation:
T = 2.1192 f -1590.3 (°C), Where R2
= 0.9754
Static characteristic of model (C): The results of experiment are given in Table 3 and Fig. 8.
Variation of the frequency ∆f = 746-733 = 13Hz Variation of the temperature ∆T = 80-29.4 = 50.6 °C
Sensitivity 0.256 [ / ]
6 . 50
13
C Hz T
f
S = = °
∆ ∆ =
Linearzing these results lead to the relation: T = 3.8479 f -2793.2 (°C), Where R2
= 0.9886
Static characteristic of model (D): The experimental results are given in Table 4 and Fig. 9.
Variation of the frequency ∆f = 935 – 820 = 15Hz Variation of the temperature ∆T = 85 -26.8 = 58.2 °C
Fig. 10: Response for an input step (46-55) °C
Sensitivity 0.257 [ / ]
2 . 58
15
C Hz T
f
S = = °
∆ ∆ =
Linear interpolation results to the relation: T = 3.8316 f -3499.1 (°C), Where R2
Fig. 11: Response for an input step (40-60) °C From the past results important notes could be made on the static behavior of ATT:
* The relationship between the temperature and frequency is almost linear, within the temperature range of study.
* An increase of the length results is a decrease in the resonance frequency.
* An increase of the inner diameter of the bore results in an increase in the sensitivity of ATT. In order to evaluate dynamic behavior of the ATT a step change in the temperature was applied and the response of the ATT and the PT 100 was plotted. For the dynamic study model B was used because it has a better sensitivity and accuracy. Figure 10 shows the step response, where the step is from T = 46°C to T = 55 °C. Figure 11 shows the response for a temperature step change from T = 40°C to T = 60°C. In fact the system was tested for many different step changes and the responses where analogous. From the plotted time characteristics it is noticed that ATT response is slower than the response of the reference detector. The ATT output is not with damping oscillations and has an overdamped response. This is due to the use of glass as a tube material.
CONCLUSION AND RECOMMENDATIONS
* A wide range of temperature could be measured by using ATT. The limiting factor is the durability of the tube which depends on the tube material. * Temperature measurement is realized with out use
of any hardwired conditioning circuits, where all the needed operations are made by computer software (LabVIEW VI). This facilitates much flexibility for data logging and process temperature control.
* The measured variable is frequency. This means that the attenuation in the signal has no effect on the measured variable.
* The designed ATT has a slow response. This is due to the use of glass as a resonance tube. Using other materials with low thermal resistance could eliminate this problem.
* Air may be replaced by another gas with lower molecular weight (M) and higher specific heat ratio (γ) in order to obtain higher resonance frequency, this leads to an increase of transducer sensitivity.
REFERENCES
1. Johnson, G.W., LabVIEW Graphical Programming. Practical Applications in Instrumentation and Control
MC Graw- Hill, Inc, 1994. U.S.A
2. Dellrenzo, Viale Romagna, 20-20089 Romzzano Electronic Laboratory Board, for the Study of Temperature Control. Milano-Italy