Original Article
Study of heat transfer on front– and back-vented brake discs
Supachai Lakkam
1*, Kullayot Suwantaroj
1, Phupoom Puangcharoenchai
1,
Songwut Mongkonlerdmanee
1, and Saiprasit Koetniyom
21 Department of Mechanical Engineering, Faculty of Engineering,
Rajamangala University of Technology Phra Nakhon, Bang Sue, Bangkok, 10800 Thailand.
2 The Sirindhorn International Thai-German Graduate School of Engineering,
King Mongkut’s University of Technology North Bangkok, Bang Sue, Bangkok, 10800 Thailand.
Received 22 August 2012; Accepted 10 September 2013
Abstract
A brake disc plays an important role in the automotive industry since it concerns directly with safety. In order to develop proper heat ventilation a wide range of brake discs have been designed. Different types of physical brake disc geometries, as front- and back-vented brake discs, affect the heat ventilation directly. This is a vital factor of the brake’s capability. We recognized the importance of this circumstance and therefore attempted to create a test to investigate the temperature gradient of the brake disc in order to evaluate the coefficients of heat convection. The coefficients were modified by the change of temperature distribution in both brake discs under the forced heat convection in steady state conditions. However, the heat radiation value does not take into account that the heat convection is dominated by the physical geometry of the brake disc. To set up the experimental test for investigating the heat transfer by convection the JASO C406 standard is adopted. The experimental results in terms of heat convection coefficients are used in the numerical simulation via the finite element method in order to study the temperature diffusion and heat ventilation of front and back-vented brake discs. Conse-quently, the experimental results reveal that the overall heat convection coefficients of the front-vented brake disc are higher than these of the back-vented one. In other words the simulation yields that the front-vented brake disc allows stronger heat ventilation than its compared object, leading to larger temperature differences between outboard and inboard rotors, resulting in more thermal stress. This makes it more susceptible to be damaged during operation.
Keywords: brake disc temperature, front-vented brake disc, back-vented brake disc, heat conduction, heat convection
1. Introduction
As the automotive industry plays a major role in Thailand, a brake disc is one of the automotive products that are crucial for the safety of vehicles. Normally, the brake discs are imported or locally produced in a competitive market. The local competition concerns the design and the efficient development of physical aspects, including the usage of local materials in production. Although brake discs are considered
as safety parts in vehicles, some of Thailand’s manufacturers only duplicate parts of the original equipment manufacturers (OEM) or change their designs. These manufacturers omit the evaluation of their products due to the reduction of production costs. In addition, the unclear process of specific testing methods and high costs of test equipment cause a shortage of full size test equipment in the local auto part industry. This results in insufficient development of auto part products in Thailand. Therefore, it is necessary to conduct research to investigate the effect of products that have been designed and manufactured from local materials. In the future, full size test equipment can be used to design and to evaluate the new design of brake discs.
* Corresponding author.
Email address: [email protected]
In basic principle, a breaking system has to retard or reduce speed when a driver desires (vehicle deceleration). The kinetic energy of a vehicle in terms of wheel speed is transduced into heat energy due to the brake application. The friction force between pad and brake disc applies friction torque to the wheel contrary to the car’s direction of move-ment. As a consequence the vehicle speed is reduced and heat energy occurring in the brake disc causes a temperature increment of the brake disc during the brake application. This physical action of the brake disc causes heat conduction to the adjacent braking system components. If there is an in-consistent dissipation of heat inside the brake disc, deforma-tion of the brake disc can occur (Lee, 2004). This problem is normally being found during operation. In addition to such problem, the friction loss by brake disc deformation causes the brake to fade (Cueva et al., 2003). The wearing of these components is increased, which results in a shorter life time (Hunter et al., 1998). The transition of brake fluid from liquid to vapor due to high temperatures in the brake disc results in decreasing brake efficiency. Such high temperatures of the brake disc affect the occurring damage, and cause cracking in the brake disc material due to high thermal stresses. During normal operation a cycle is perpetually repeated, brake appli-cation and subsequent cooling period. The recurring tem-perature differences lead to thermal fatigue which can subject the break disc to cracks as shown in Figure 1 (Bagnoli et al., 2009). Furthermore, these factors also cause vibration (Bergman et al., 1999 and Papinniemia et al., 2002). Accord-ingly, a characteristic of a brake disc should be that it can absorb and dissipate the heat effectively in any repeated cycle of operating conditions. The effects described above are all undesired performance outcomes in a braking system. However, these problems are unavoidable in daily life. Mean-while, studies of heat collection characteristics of brake discs are necessary to solve this problem and as a guideline to design suitable disc brakes for each condition.
This research project aims to study heat dissipation characteristics of different types of brake discs during their operation. The braking efficiency is affected by a number of factors that are directly related to the safety, which is the main objective to study the brake disc characteristics. In order to determine their convection coefficients, front- and back-vented brake discs, which are modified by using materials available in Thailand, are used in these experimental tests. These experimental results are used as thermal properties in a computer simulation in order to determine the temperature responses and temperature distribution of such brake discs. Furthermore the brake disc distortion due to various tem-perature gradients is taken into account for the simulation.
2. Literature Survey
Finite element analysis is a method that is normally used to study heat characteristics of brake discs. There is temperature analysis (Koetniyom, 2003) on brake discs made from cast iron under heavy operating conditions using finite
element method with two different attachments, front and back attachments to the finned disc neck. The results from the temperature test indicated that the physical shape of automotive brake discs play a role in determining the tem-perature characteristics of brake discs including the overall efficiency of brake discs. Thus, the maximum temperatures of both brake disc types were at approximately 380°C.
Besides, the temperature dissipation of automotive brake discs by adapting kinetic energy was analyzed by finite element method (Kamnerdtong et al., 2005). Its purpose was to determine the interaction of mechanical and thermal effects with disc movements and heat caused by frictions. From this study, they ascertained that temperatures on the rotor surface changed at each point over the period, which implies in-consistent dissipation and temperature differences in each side of the rotor. The temperature differences are tended to increase with the amount of brake applications, due to the heat accumulation caused by friction energy. Furthermore, an inconsistent contact between disc pad and brake disc affects material deformation caused by an imbalance of tem-peratures. Beyond that, inconsistent contact is a factor that causes vibration during the brake application.
In addition, heat convection coefficient is of key interest. It was studied by the invention of the dynamometer for brake discs with an electric heater on the brake disc surface (Koetniyom, 2006). The test results showed that the heat convection coefficient was high on the inboard surface of the rotor because its surface had poorer ventilation than the outboard rotor. The characteristic of this result was also studied with regard to the dependence of the vehicle speed, which was related to the wind speed in the tuner of the dynamometer.
Furthermore, thermal stress on brake discs dependent on the shape of their drill holes, which was studied using finite element method (Wonchai, 2008). Different shapes of holes were designed in order to protect the brake disc from squeezing due to thermal expansion. As a disadvantage, the drilled holes affect the increment of stress on the brake disc. Within the scope of this analysis, a motorcycle brake disc
with ventilation (drill) holes in form of spirals was investi-gated. The number of curls and circles as well as the rotating speeds and constraints on the brake disc were modified. It was found that the maxima of stress were unstable since they varied with the number of curls and drill holes.
Likewise, the influence of the thermodynamic burden on the mechanism of the brake disc’s damage was examined. Heat transfer phenomena, including heat transmission- and transformation- equations were taken into account to solve the problem (Dufrénoy et al., 2012). By using numerical calcu-lations, it was found that the dissipation of grinding pressure and the temperature of the disc’s and pad’s surface are subjected to the material characteristics. The investigations revealed that carbon is the best durable material to withstand the heat transformation.
To investigate the heat dissipation, the electrically controlled brake modulator was studied (Qi et al., 2007). A proposed process, which allows using brake pad tempera-tures for controlling the operation, was introduced. Data was used to adjust specific parameters of the calculation to modu-late the pad’s contact force during the brake application. The installation of two temperature sensors turned out to be sufficient for the electric control of the brake system.
Moreover, studying the temperatures (Saric et al., 2009) at the contact points between pad and brake disc during the brake application revealed that maintaining the temperature is important for an efficient brake systems, since it is an influencing variable of safety, measurement and the forecast of dissipation. The research was carried out using a thermo-couple drilled into the brake pad at the contact point in order to examine the temperature dissipation. The dissipation depends on many parameters, such as brake frequency, flow speed, brake burden, and material. Later, it was found that the most important factor is the brake frequency, while the actual contact area between pad and brake disc is related to the kinetic energy dissipated by friction, which affected the contact surface temperatures. While the effect of the actual surface area on specific contact temperatures and coeffi-cients of friction were analyzed by finite element method, it was found that the maximum temperatures at the contact point have not increased linearly during the decrease of the contact area ratio. Investigations of the surface temperatures on the brake disc were carried out by Thevenet et al. (2010) where the radiation was measured with a two-color pyro-meter, which was developed by using pyrometer technique to transmit two light colors that can measure at the brake disc at temperatures between 200 to 800°C with a sensitivity response at 8 µs per round; calibration of the temperature was done using black surface material. The results of tem-perature measurement with this technique provided very accurate data. By testing with this equipment, it was found that radiation varied with the quality of the brake disc’s surface materials.
In addition, an optimization study for brake squeals aims to minimize the strain energy of vibrating pads with constrained layer damping (Lakkam et al., 2012). The finite
element method was used and the experiments were re-presented to specify the position of the constrained layer damping patch under the condition of pressure.
3. Conceptual Study
3.1 Test kit for brake disc temperature
To examine the heat dissipation on brake discs, tools and test kits are proposed and implemented. For simulating heat transfer on the tested brake disc under the condition of wind flow, it is necessary to make a single dynamometer test kit that complies to the JASO C406:2000 standard. The test kit has four components as shown in Figure 2 and 3:
Wind Tunnel (Number 1): To achieve the actual co-efficient of heat convection, the air flow is forced by the wind tunnel with 11 m/s of constant speed according to JASO C406: 2000.
Disc Drive (Number 2): To simulate the virtual rota-tion of the wheel, there are two major parts: A motor and a variable speed controller (inverter), both of which are related to this work as shown in Figure 2. The motor is used to drive the brake disc from 90 to 140 km/hr of car speeds depending on the inverter.
Disc Heater (Number 3): Under temperature control, a set of initial temperature conditions of 100, 200 and 300°C are generated by the disc heater installation in the middle of the disc. However, its operation is restrained by the surface temperature of the disc.
Data Collector (Number 4): In the experiment, the temperatures are measured at three points: The neck as well as the inboard and outboard side of the disc surface. These data will be sent to the data acquisition via cable and slip ring as shown in Figure 3.
3.2 Experimental determination of heat convection coeffi-cient
There are two methods to verify the heat convection coefficient of front- and back-vented discs using experi-mental and numerical analysis. Same test conditions were set by the heat input application to both discs from where a set of initial temperature conditions on the disc surface were obtained at 100, 200, and 300°C. In addition the rotation of the disc is set at the same speed as the vehicle, 90, 110, and 140 km/hr, under the constant wind speed of 11 m/s. Condi-tions and test patterns are shown in Table 1.
For the case shown in Figure 4, it is only necessary to deal with the phenomena on the surface of the brake disk. Accordingly, for the surface energy balance only the control surface is considered. Thus, for this temperature range the heat generation and storage terms are neglected as well as radiation. Therefore, under forced heat convection in the steady state condition the heat quantity Q is
conduction convection
perature. Consequently, the aforementioned heat quantity
Q is based on the forced heat convection in the steady state condition. Average temperatures of disc surface (
T
ave) and room temperature (T
) were used to calculated the heatconvection coefficient.
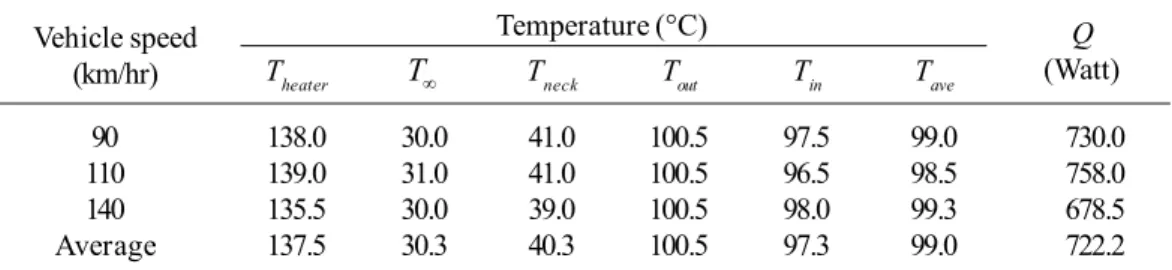
From Table 2, 3, and 4, it was found that there is no remarkable difference of the temperatures at each sensor position when the initial disc surface temperature is applied at 100, 200 and 300°C under different vehicle speeds. These results reveal that the disc speeds have a small effect on the heat transfer of the disc. However, the average temperature data from each position at different speeds will be used to determine the heat convection coefficient.
Figure 2. Single dynamometer test kit.
Figure 3. Assembly of disc heater.
Table 1. Test patterns.
Types of brake disc Temperature Vehicle speed Wind speed (C) (km/hr) (m/s)
100 90, 110, 140 11 200
300 Front-vented disc /
Back-vented disc
As mentioned, the heat convection coefficient can be calculated by
( )
dT
kA hA Tout T
dx x l (2)
3.2.1 Front-vented disc
The verification of the heat convection coefficient of the front-vented disc requires temperature values from each point, such as heater temperature (
T
heater), room temperature (T
), disc neck temperature (T
neck), inboard side of discsurface temperature (
T
in), and outboard side of disc surface temperature (T
out), as well as their average temperatures, as shown in Figure 5. Therefore, heat quantity (Q
) in terms of conduction can be determined by the difference between the average temperatures of disc surface (T
ave) and heatertem-Figure 4. Surface energy balance.
3.2.2 Back-vented disc
To verify the heat convection coefficient of the back-vented disc, the requirements for temperature values from each point, such as heater temperature (
T
heater), room tem-perature (T
), disc neck temperature (T
neck ), inboard side of disc surface temperature (T
in) and outboard side of disc surface temperature (T
out), as well as the average tempera-ture of disc surface (T
ave) are shown in Figure 6. Therefore, heat quantity (Q
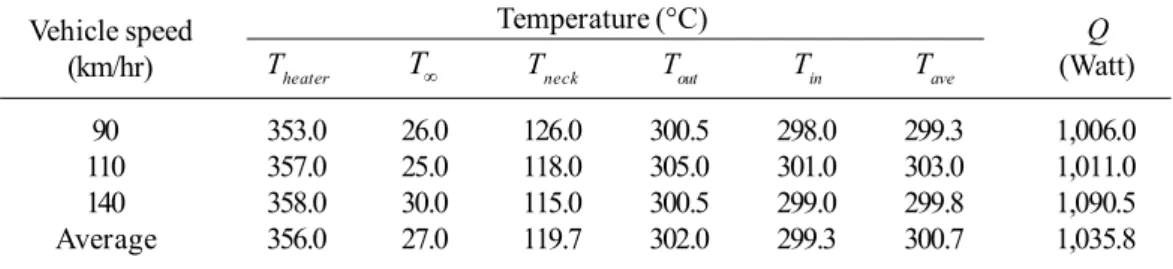
) and heat convection coefficient value can be calculated by a uniform technique shown in Section 3.2.1. From Table 5, 6, and 7, it was found that the tempera-ture at each sensor position does not show a remarkable difference, as long as the disc surface temperature initiates toTable 3. Application of heat input to initial surface temperature at 200°C for the front-vented disc
Temperature (°C)
Theater T Tneck Tout Tin Tave
90 248.5 32.0 88.0 201.0 193.0 197.0 964.0 110 249.0 33.0 89.0 201.5 193.5 197.5 964.0 140 249.0 32.0 78.0 199.5 193.0 196.3 964.0 Average 248.8 32.3 85.0 200.6 193.3 197.2 946.0 Vehicle speed
(km/hr) (Watt)Q
Table 4. Application of heat input to initial surface temperature at 300°C for the front-vented disc
Temperature (°C)
Theater T Tneck Tout Tin Tave
90 357.0 31.0 144.0 302.0 300.0 301.0 1048.0 110 354.0 32.0 134.0 300.0 296.0 298.0 1,048.0 140 359.0 31.0 117.0 301.0 299.0 300.0 1,104.5 Average 356.6 31.3 131.6 301.0 298.3 299.7 1,066.6 Vehicle speed
(km/hr) (Watt)Q
Table 2. Application of heat input to initial surface temperature at 100°C for the front-vented disc
Temperature (°C)
Theater T Tneck Tout Tin Tave
90 138.0 30.0 41.0 100.5 97.5 99.0 730.0 110 139.0 31.0 41.0 100.5 96.5 98.5 758.0 140 135.5 30.0 39.0 100.5 98.0 99.3 678.5 Average 137.5 30.3 40.3 100.5 97.3 99.0 722.2 Vehicle speed
(km/hr) (Watt)Q
Table 5. Application of heat input to initial surface temperature at 100°C for the back-vented disc
Temperature (°C)
Theater T Tneck Tout Tin Tave
90 140.5 27.0 41.0 100.5 100.5 100.5 749.0 110 142.0 25.0 40.0 104.5 100.5 102.5 739.5 140 138.0 30.0 42.0 99.5 101.0 100.3 706.5 Average 140.2 27.3 41.0 101.5 100.6 101.0 735.0 Vehicle speed
(km/hr) (Watt)Q
transfer heat at 100, 200 and 300°C under different vehicle speeds. This outcome reveals that disc speeds have a small effect on the heat transfer of the disc. Therefore, average temperature data from each position at different speeds are used to determine the heat convection coefficient.
4. Result and Discussion
4.1 Heat convection coefficient
Heat quantity (Q) is used to calculate heat convection coefficients at each position, such as heat convection
coeffi-cient at the inboard and outboard of the disc surface (
h
in), (h
out) and the average heat convection coefficient at both sides of the disc (h
ave). However, since disc speed or vehicle speed have no effect on the heat transfer, average values of these three data (h
ave total, ) represent heat convectioncoeffi-cient as illustrated in Table 8 and 9.
From Figure 7, heat convection coefficients of two disc types have similar values, while the heat convection coefficient of the front-vented disc is 825 W/m2.K at 300°C.
At the same time the heat convection coefficient of the back-vented disc is 789 W/m2.K, which is a difference of 4.4%. In
conclusion, the heat convection coefficients of both discs Table 7. Application of heat input to initial surface temperature at 300°C for the back-vented disc
Temperature (°C)
Theater T Tneck Tout Tin Tave
90 353.0 26.0 126.0 300.5 298.0 299.3 1,006.0 110 357.0 25.0 118.0 305.0 301.0 303.0 1,011.0 140 358.0 30.0 115.0 300.5 299.0 299.8 1,090.5 Average 356.0 27.0 119.7 302.0 299.3 300.7 1,035.8 Vehicle speed
(km/hr) (Watt)Q
Table 6. Application of heat input to initial surface temperature at 200°C for the back-vented disc
Temperature (°C)
Theater T Tneck Tout Tin Tave
90 251.0 26.0 81.0 202.5 201.0 201.8 931.0 110 254.5 25.0 81.0 210.5 200.0 205.3 921.0 140 256.0 31.0 80.0 209.5 197.5 203.5 982.0 Average 254.0 27.3 80.6 207.5 199.5 203.5 944.6 Vehicle speed
(km/hr) (Watt)Q
Table 8. Heat convection coefficient of the front-vented disc.
h (W/m2.K)
90 (km/hr) 110 (km/hr) 140 (km/hr) Tave,total Tin Tout Tave Tin Tout Tave Tin Tout Tave
100 2,220 2,127 2,173 2,340 2,209 2,274 2,019 1,950 1,984 2,143 200 1,247 1,188 1,217 1,251 1,191 1,221 1,241 1,193 1,217 1,218 300 811 805 808 827 814 821 858 852 855 828 Initial temperature
of disc (°C)
Table 9. Heat convection coefficient of the back-vented disc
h (W/m2.K)
90 (km/hr) 110 (km/hr) 140 (km/hr) Tave,total Tin Tout Tave Tin Tout Tave Tin Tout Tave
100 2,066 2,066 2,066 2,040 1,937 1,989 2,044 2,088 2,066 2,040 200 1,108 1,099 1,104 1,097 1,035 1,066 1,229 1,147 1,188 1,119 300 770 763 767 763 752 757 844 839 842 789 Initial temperature
tend to have the same orientation and are inversely propor-tional to the brake disc temperature. In other words, the heat convection coefficient increases simultaneously with the decrease of temperature.
4.2 Two–brake disc models
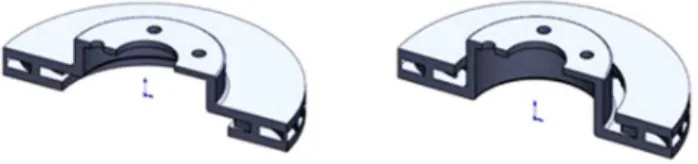
Two brake disc models with different physical looks, namely front-vented disc model and back-vented disc model are created by SolidWorks software and exported to Abaqus software. These models are created as actual work pieces in order to get an almost identical size of the brake discs, as shown in Figure 8.
4.3 Simulate with finite element method
To analyze brake disc problems with finite element method using commercial software is very convenient and of low cost. Therefore, it is popular and widely used, whereas accurate data is needed. To obtain accurate results, the exact values of conditions such as models, brake disc materials, environment etc. should be identified. The process is as follows:
4.3.1 Identification of conditions and scope
Before starting a simulation by finite element method using Abaqus software it is necessary to identify conditions and scope under realistic circumstances. Important factors for the finite element method are material characteristics of the brake discs, such as heat conduction coefficient, specific heat, and density. The standard values of disc metals are shown in Table 10. On the other hand the heat convection coefficient should be obtained from an actual test or an ex-perimental test under different temperatures.
To analyze the temperature behavior of the front-vented disc and back-front-vented disc, sizes and dimensions of brake discs are unmodified. While the whole disc with 360 degrees consists of 728,469 nodes and 346,890 elements, one disc sector of 12 degrees consists of 33,879 nodes and 14,730 elements. To reduce the calculation process, the model is built by only one sector of 12 degrees of the full size disc, as shown in Figure 9. Simulation sequences of this finite element method are as follows: Verification of the test environment reliability, simulation of the heat transfer behavior and
com-Figure 7. Comparison of heat convection coefficient between two disc types.
Figure 8. Front-vented brake disc (left) and back-vented brake disc (right).
Table 10. Material characteristics to simulate with Finite Element Method (Koetniyom, 2006)
Material properties
Temperature Heat conduction Specific heat Density Heat convection (°C) (W/mm·°C) (J/kg·°C) (kg/m3) (W/m2·K)
100 0.0525 247 6,950 from actually test 200 0.0515 427 6,950 from actually test 300 0.0505 607 6,950 from actually test
Figure 9. Simulated 12–degree brake disc with mesh.
parison of the heat transfer behavior of front- and back-vented discs. The heat transfer temperatures start from 100, 200, and 300°C and are imposed for 120 seconds.
4.3.2 Verify test environment reliability
with the same heat convection coefficients, scope and condi-tion is shown in Figure 10 and determine the temperature responses after 120 seconds as shown in Figure 11. Subse-quently, temperature responses from test and simulation due to the heat transfer are compared based on initial (
T
Initial) and final temperature responses (T
Final), as shown in Table 11.After verifying the reliability under unchanged condi-tions and scope, it was instituted that the temperature response in the test case varied from the response in the simulation case. In the test the temperature was reduced from 203.5°C to 134.0°C after 120 seconds, which is a decrease of 34.0%. In the simulation it was reduced from 201.5°C to 146.0°C, which is a decrease of 27.5%. Hence, the difference between test and simulation case is 7% as shown in Table 11.
This deviation is acceptable. It is not only caused by the in-efficiency of the test equipment but also by the conditions and scope because of heat conduction via the connected solid shaft and the uncontrollability of the air temperature.
4.3.3 Heat transfer simulation
Heat transfer simulation for both types of disc was carried out at three temperature points of 100, 200 and 300°C, also for a particular time of 120 seconds, as shown in Table 12.
There are three points on both front-vented and back-vented discs that are used to measure temperatures in order to examine the heat transfer characteristics as follows: Inboard disc surface (A), outboard disc surface (B), and disc
Figure 10. Heating of brake disc.
Figure 11. Cooling of brake disc.
Table 11. Temperature response between experimental and simulation results in back-vented disc
Heating Cooling
neck (C), as shown in Figure 12.
The process starts with heating up both surface sides of both discs until they reach a stable temperature of 300°C. At this state the process is stopped and the heat transfer period is awaited for 120 seconds. Afterwards, the heat transfer coefficient can be determined as shown in Figure 13. The method of simulation at heat transfer temperatures of 200°C and 100°C is similar. The temperature at each point and the percentage of heat transfer for each case are shown in Table 13.
4.4 Comparison of temperature difference at disc surfaces
A comparison of the temperature responses at both sides of both discs collected from simulation results is shown in Table 14. Significant differences of temperature responses imply higher thermal stresses of materials.
From Table 14 it was found that the inside and outside temperature of front-vented and back-vented discs vary
Table 12. Finite Element simulation
Types of brake disc Temperature (°C) Heat transfer time (s) 100
Front-vented disc / Back-vented disc 200 120 300
Figure 12. Temperature points on front-vented and back-vented disc.
around 3.9°C and 1.5°C, respectively. This outcome represents that the temperature change of the front-vented disc is higher than of the back-vented disc. Therefore, the front-vented brake disc sustains more thermal stresses and eventually tends to be deformed.
4.5 Comparison of heat transfer performance
The heat transfer performance of both types of discs is compared at the initiate temperature of 100, 200 and 300°C in order to examine the heat transfer performance, as shown in Table 15.
From Table 15 it was found that the temperature responses started at 100, 200 and 300°C, while the heat transfer performance at the different temperatures was res-pectively 25.8%, 31.2%, and 33%. As a result, the heat transfer
Table 13. Temperatures at each point and percent of heat transfer
Temperature (°C)
Types of brake disc Heat transfer (%)
TA TB TC Taver,A-B
@100°C
Front-vented disc 73.7 72.2 56.3 73.0 27.1 Back-vented disc 75.0 76.0 60.8 75.5 24.5
@200°C
Front-vented disc 136.5 132.5 97 134.5 33.0 Back-vented disc 140.0 141.5 102.2 141.0 29.6
@300°C
Front-vented disc 198.9 192.7 131.8 195.8 34.7 Back-vented disc 204.7 207.2 144.7 205.9 31.4
performance increases at higher temperatures and decreases at lower temperatures.
5. Conclusions
5.1 Experimental analysis
According to the experimental works, the heat con-vection coefficient tests of front- and back-vented brake discs with reference to JASO C406:2000 – a passenger car, braking device, dynamometer test procedure to identify heat transfer efficiently – can only be performed at a maximum tempera-ture of 200°C due to the limitation of test equipment. In fact, the tested brake discs cannot be heated up to more than 200°C surface temperature under the test’s speed conditions. Furthermore, it was found that the heat transfer performances of both disc types have the same orientation. As a result, the heat convection coefficient of the front-vented disc at a temperature of 100, 200 and 300 °C is 2,143, 1,218, and 828 W/m2.K respectively, while the coefficient of the back-vented
disc is 2,040, 1,119, and 789 W/m2.K respectively. It was found
that the heat convection coefficient is low when the brake disc is operated under high temperatures and vice versa the front-vented disc has a higher heat convection coefficient than the back-vented disc, namely around 4.4%.
5.2 Simulation analysis
Amongst others, the simulation using finite element method with initial temperatures at 100, 200 and 300°C within 120 seconds yielded the following results: The front-vented brake disc has better heat transfer performance than the back-vented brake disc, with respective heat transfer differ-ences of 2.55, 3.15, and 3.37% at the particular temperatures.
Hence, at an average initiate temperature the heat perfor-mance of the front vented disc exceeds the perforperfor-mance of the back-vented disc of around 3.02%. In addition, both brake discs have different heat transfer behaviors. It reads as the inboard surface of the front-vented brake disc provides a higher temperature response than the outboard surface. This occurs because the heat from the outboard surface can be transferred to the brake neck and dissipated into the air, while the heat from the inboard surface can only be dissipated into the air. Therefore, the inboard and outboard surfaces have a temperature difference of around 3.9°C. For the back-vented brake disc, the temperature on the outboard surface is higher than on the inboard surface. The reason is that the heat from the inboard surface can be transferred to the brake neck and dissipated into the air, while the heat from the outboard surface can only be dissipated into the air. Therefore, the inboard and outboard surfaces have a temperature difference of around 1.5°C.
On the whole, the experimental method was utilized to find the actual thermal properties of discs with only small differences. For temperatures between 100 and 300°C, the front-vented discs have an average heat transfer of 722.2 to 1,066.6 Watt, while the average heat transfer in back-vented discs varies from 735.0 to 1,035.8 Watt. However, in some of the areas no heat transfer was indicated. This is why the simulation method was applied to elucidate the context of heat transfer. Thereby, the result shows that the front-vented brake disc has a larger temperature difference than the back-vented brake disc due to the difference in temperature dissi-pation. Therefore, the front-vented brake disc is more likely subjected to potential stresses than the back-vented brake disc. Finally the front-vented brake disc has a higher potential to deform during the operation than the back-vented brake disc.
Table 14. Temperature differences at disc surfaces.
Front-vented disc (°C) Back-vented disc (°C) Temperature (°C)
Tin Tout T Tin Tout T
100 73.7 72.2 1.5 75.0 76.0 1.0 200 136.5 132.5 4.0 140.0 141.0 1.0 300 198.9 192.7 6.2 204.7 207.2 2.5 Average 136.4 132.5 3.9 139.9 141.4 1.5
Table 15. Heat transfer performance at different temperatures.
Heat transfer performance (%)
Temperature100 (°C) Temperature200 (°C) Temperature300 (°C)
Front-vented Back-vented Average Front-vented Back-vented Average Front-vented Back-vented Average
Acknowledgments
The authors are grateful for the financial support for the experimental work from Rajamangala University of Tech-nology Phra Nakhon and appreciate instrument support from King Mongkut’s University of Technology North Bangkok.
References
Bagnoli, F., Dolce, F. and Bernabei, M. 2009. Thermal Fatigue Cracks of Fire Fighting Vehicles Gray Iron Brake Discs. Engineering Failure Analysis. 16, 152-163.
Bergman, F., Eriksson, M. and Jacobson, S. 1999. Influence of Disc Topography on Generation of Brake Squeal. Wear. 225–229, 621–628.
Cueva, G., Sinatora, A., Guesser, W.L. and Tschiptschin, A.P. 2003. Wear Resistance of Cast Irons Used in Brake Disc rotors. Wear. 255, 1256–1260.
Dufrénoy, P., Bodovillé, G. and Degallaix, G. 2002. Damage Mechanisms and Thermomechanical Loading of Brake Discs. European Structural Integrity Society. 29, 167– 176.
Hunter, J.E., Cartier, S.S., Temple, D.J. and Mason, R.C. 1998. Brake Fluid Vaporization as a Contributing Factor in Motor Vehicle Collisions. The Soceity of Automotive Engineer Technical Paper. 980371, 277-296.
Kamnerdtong, T., Chutima, S. and Siriwattanpolkul, A. 2005 Analysis of Temperature Distribution on Brake Disc. Proceeding of the 19th ME-NETT, Phuket, Thailand.
October 19-21, 2005.
Koetniyom, S. 2003. Temperature Analysis of Automotive Brake Discs. The Journal of King Mongkut’s Univer-sity of Technology North Bangkok. 13, 36-42. Koetniyom, S. 2006. Study of Heat Convection Coefficient
in Automotive Brake Disc. Proceeding of the 20th ME-NETT, Nakhonratchasima, Thailand, October 18-20, 2006.
Lakkam S. and Koetniyom S. 2012. Optimization of Constrained Layer Damping for Strain Energy Minimization of Vibrating Pads. Songklanakarin Journal of Science and Technology. 34(2), 179-187.
Lee, K. 1999. Numerical Prediction of Brake Fluid Tempera-ture Rise During Braking and Heat Soaking. The Soceity of Automotive Engineer Technical Paper. 1999-01-0483, 1-9.
Papinniemia, A., Laia Joseph, C.S., Zhaob, J. and Loader, L. 2002. Brake squeal: a literature review. Applied Acous-tics. 63, 391–400.
Qi H.S. and Day A.J., 2007. Investigation of Disc/Pad Inter-face Temperatures in Friction Braking. Wear. 262, 505– 513.
Saric, S., Bab-Hadiashar A. and Van Der Walt, J. 2009. Esti-mating clamp force for brake-by-wire systems: Thermal considerations. Mechatronics. 19, 886–895. Thevenet, J., Siroux, M. and Desmet, B., 2010. Measurements
of brake disc surface temperature and emissivity by two-color pyrometry. Applied Thermal Engineering. 30, 753–759.