Emission Properties Related to Distinct Phases of Sol-Gel Dip-Coating Titanium Dioxide,
and Carrier Photo-Excitation in Diferent Energy Ranges
Roberto de Aguiar Ramos Jr a, Miguel Henrique Borattoa, Maximo Siu Lib, Luis Vicente de Andrade Scalvia*
Received: September 16, 2016; Revised: December 19, 2016; Accepted: February 12, 2017
Titanium dioxide (TiO2) in the form of pellets (pressed powder) and thin ilms are investigated,
revealing the presence of distinct phases: mainly anatase and rutile. Characterization of optical, structural and electrical properties were carried out on samples submitted to diferent sort of thermal annealing (TA), at distinct temperatures, 500 and 1000oC, due to their inluence on the obtained
phases. TA temperature along with pressure application for sample conformation, determine the bands present in the photoluminescence (PL) spectra, being about 550nm, characteristic of anatase phase and 800nm, related to the presence of rutile phase. The bandgap of thin ilms is determined from optical absorbance data, yielding 3.4eV for anatase phase (indirect transition), and 2.9eV for rutile phase (direct transition). Besides, irradiation with monochromatic light strongly afects the thin ilm conductivity, but the energy range (above or below the bandgap energy) does not seem to afect the behavior, which is associated with the excitation of intrabandgap states or crystallites belonging to phases with distinct bandgaps.
Keywords: titanium dioxide, photoluminescence, phase transition, conductivity decay
* e-mail: [email protected]
1. Introduction
Titanium dioxide (TiO2) is an oxide semiconductor material
with wide bandgap of the order of 3.3 eV1,2. The bandgap may
have direct or indirect electronic transition1,3 depending on the crystal structure: anatase, rutile and brookite4. Its n-type
semiconducting nature comes from the non stoichiometric
TiO2-x composition, which originates oxygen vacancies (x ≅
0.01), leading the Ti3+ ions to behave as a donor impurity5.
This material is largely investigated due to a wide range of applications, such as solar cells, water puriication6, or gas
sensor7, etc8. High refraction index of the anatase phase
allows its use as a thin ilm relective coating on Si solar
cells4. The rutile phase has a lower Gibbs free energy in the
bulk than the anatase phase, however, the surface Gibbs free energy of the rutile phase is higher than the anatase phase,
therefore, TiO2 begins its nucleation in the anatase phase9 at
low temperatures, range where it presents higher stability. However, the rutile phase is more stable but initiates its nucleation at higher temperatures10. The phase transition
depends on several factors such as particle size, sol-gel pH, surface energy, synthetic route11, and doping impurities 2.
A simple method for obtaining the rutile phase is through
the heat treatment of the anatase phase, for the reason that
the thermal energy facilitates the rearrangement of atoms2,
leading to the phase transition from 400°C to 1200°C 2,12,13.
TiO2 can be synthesized by several diferent methods,
including liquid phase processing techniques, which have
the advantage of stoichiometry control, in order to produce homogeneous materials. Among these methods, the sol-gel process has been widely used because it provides an appropriate level of purity and high lexibility for doping
introduction4. There are two sorts of known sol-gel method:
the alkoxide route and non-alkoxide route. The non-alkoxide route uses inorganic salts (such as nitrates, chlorides, acetates, carbonates, acetylacetonates, etc.)4,14, which requires an
additional removal of the inorganic anion, whereas the
alkoxide route (the most employed) uses metal alkoxides as
precursor reagents4,15. In general, this latter method involves
the formation of sol or gel or precipitates by hydrolysis and
condensation of titanium alkoxides4. TiO2 thin ilms also are
frequently obtained by chemical vapor deposition (CVD)16
and spray pyrolysis deposition (SPD)17. More recently, TiO 2
have been produced in the form of nanotubes18, and there
have been reports on the growth of nanotube ilms ordered by anodization19, because with this highly ordered arrangement
the electron mobility can be improved20.
Electrical properties such as resistivity, are changed
considerably due to the thermal oxidation or reduction of the
ilms, which shows that the concentration of charge carriers in the thin ilm is dependent on non-stoichiometry21. Optical
properties such as photoluminescence (PL) and the nature of
the electronic transition depend on the atomic structure. For
better implementation and use of the optical and electrical properties of this material in devices, the determination of the emission bands characteristic of each phase, and its
identiication as well as the stoichiometry properties are
a Physics Department and POSMAT, São Paulo State University – UNESP, Bauru, SP, Brazil
fundamental. The PL of the anatase phase is related to two main bands: emission from self trapped excitons (440-510 nm) and deep levels formed by oxygen vacancies (515-560
nm)22. The self trapped excitons decrease the total energy
of excitons through lattice relaxation, leading to emission energy lower than the bandgap21. On the other hand, the
PL emission of the rutile structure comes from deep levels related to the excited states of Ti3+ (800-880 nm)23.
In this paper, we report results of X-ray difraction (XRD), Thermogravimetry / Diferential Thermal Analysis (TG / DTA), Photoluminescence (PL) and decay of photo-induced electrical current, which allowed identifying the
emission bands characteristic of each phase and the transition
anatase/rutile. Properties of photo-induced conductivity, related to the time response of titanium dioxide thin ilms for excitation with diferent wavelengths are also obtained. This material exhibits a high sensitivity when excited, and a fast decay to the ground state when the excitation is removed, showing suitable properties for applications in opto-electronic speedy devices.
2. Experimental
The titanium dioxide solution was obtained through
reactions of hydrolysis and condensation of titanium
isopropoxide alkoxide (IV) using a high molar ratio of water:alkoxide (200:1), isopropanol as co-solvent, HNO3 as a catalyst and Triton X-100 as surfactant. This solution allows obtaining TiO2 thin ilms by dip-coating technique
on soda-lime glass substrates, with immersion/emersion rate of 10cm/min. Four TiO2 layers were deposited, being
thermally heated after each deposited layer at 80°C for 10 minutes. A inal thermal annealing is provided at 500°C for 2 hours. Thin ilms were also deposited on quartz, but in this case the inal thermal annealing was at 1000oC. The
powders were obtained from heating the solution at 85°C
for 2 hours in order to provide evaporation of the whole
dispersant. Evaporation leads to formation of tiny crystals, which were mashed, generating the TiO2 powder. These
powders were compressed with 7x10³ Kg/cm² to form pellets,
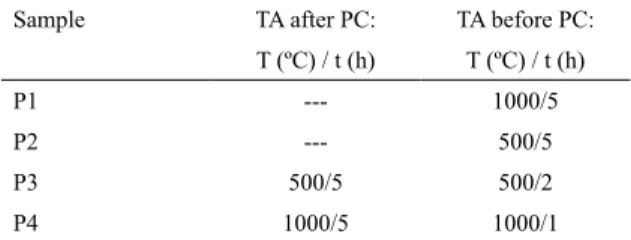
being submitted to a distinct sequence of thermal annealing to originate 4 distinct samples. Table 1 shows the order and temperature of thermal annealing of these samples.
Analysis of X-ray Difraction (XRD) was performed on a Rigaku difractometer (Model D / Max - 2100 / PC) operating with Cu Kα radiation (1.5405 Å) and Ni ilter for reducing unwanted Kβ radiation. The measurement range was from 20 to 80o with a scanning rate of 2o/min, in
the 2θ mode for ilms (ixed incident angle of 1.5o). Data
were analyzed with the aid of the Match software (Crystal Impact), using PDF iles #01-089-4921 and #01-089-4920 for anatase and rutile phases, respectively. The average crystallite size was estimated using the Scherrer equation
24.Transmittance and absorbance were performed in a Perkin
Table 1. Thermal annealing of the samples, before and after pellet compression (PC), as function of Temperature (T) and time (t).
Sample TA after PC: TA before PC:
T (ºC) / t (h) T (ºC) / t (h)
P1 --- 1000/5
P2 --- 500/5
P3 500/5 500/2
P4 1000/5 1000/1
Elmer spectrophotometer (Lambda Model 1050 UV / VIS / NIR) in the range of 200 to 3300nm. Evaluation of the optical bandgap was performed by using Tauc method 25.
For photoluminescence (PL) measurements, the line 350.7
nm of a Kr+ laser was used (Innova model 200), with output
power of about 500mW, being the power that reaches the sample of about 14mW, after the beam travel through several optical components (a prism, four mirrors, two lenses, 138Hz chopper and iris). The data acquisition is performed using a PC interfaced to control the monochromator step motor (Thermo Jarrell-Ash) and receives signal from a lock-in (SR530 model 16 Stanford Research Systems).
To perform electrical measurements on the thin ilms, Indium (In) electrodes were deposited at low pressure (10-5
mbarr) in a BOC Edwards evaporation system (model 500 Auto system). Current decay measurements were performed in a Janis closed-He cryostat coupled to a He compressor (HC-2 model, Intermagnetic General Corp. - ODA) 26, and a
temperature controller (model 330, Lake Shore Cryotronics).
Optical excitation of samples were provided with distinct
light sources: deuterium lamp coupled to an interference ilter with peak at 270 nm (above TiO2 bandgap energy), and
also InGaN LED with wavelength in the range 440-460nm, and central peak of 450 nm (energy below bandgap of TiO2
anatase phase). Analysis of TG / DTA (STA 409 cell, Netzsch)
was carried out for TiO2 powder from 40 to 1000° C with
rate of 10°C/min in a controlled N2 atmosphere.
3. Results and discussion
It must be recalled that Table 1, described in the experimental section, deines the history of each pellet sample. The pellets P1 and P2 were thermally annealed (TA) only after pressing, whereas pellets P3 and P4 were annealed before and after applying pressure. Figure 1 shows X-rays difractograms for these pellet samples. The difraction peaks related to P1 and P4 samples with TA at 1000°C, refer to
the rutile phase of TiO2 with superior intensity on the (110)
plane. Sample P1, predominantly rutile phase, still presents a less intense peak related to (200) plane of anatase phase. Samples P2 and P3, thermally annealed at 500oC, present
Figure 1. XRD of TiO2 pellets. The main difraction peaks of
samples P1 to P4 are displayed. Samples P1 and P4 have rutile phase (catalog JCPDS-ICDD 2003 ile number 89-4920) after TT 1000oC,
but some anatase peaks (*) still appear in the P1 difractogram. Samples P2 and P3 have the anatase phase (catalog JCPDS-ICDD 2003 ile number 78-2486), after TT 500oC, but also show peaks
of rutile phase (#) .
structures presented in these samples show an incomplete phase transition, which is supposed to take place between
400oC and 1200oC 13,22, involving TA temperatures used for
all samples. This presence of two phases may be generated also by encapsulating of a structure over the other 2, such
as the rutile formation on anatase particles 27 or rutile phase
formation in the bulk of anatase phase grains 28. The average
crystallite size, calculated based on the 5 more intense peaks of the difractograms of the samples, showed a signiicant increase from 5.1 nm for P2 to 9.4 nm for P3 sample. This crystallite size is higher for sample with two TA compared
to samples with only one TA at the same temperature (after
pressing). P2 and P3 samples, which were treated at the same temperature (500oC), present a signiicant increase in
the crystallite size when the sample gets a second thermal annealing. The same behavior holds for samples P1 and P4 (TA 1000oC) with 38.5 nm of crystallite size for sample
P1 and 39.9 nm for sample P4. In both cases the samples with two TA are submitted to a longer time of annealing, leading to this expected increase in the crystallite size. It is also interesting to notice the large increase in the crystallite size when the dominant phase changes from anatase to rutile. It can be clearly observed in the difractograms (ig. 1) by the shape of the main peaks, which are rather larger for anatase-dominant samples.
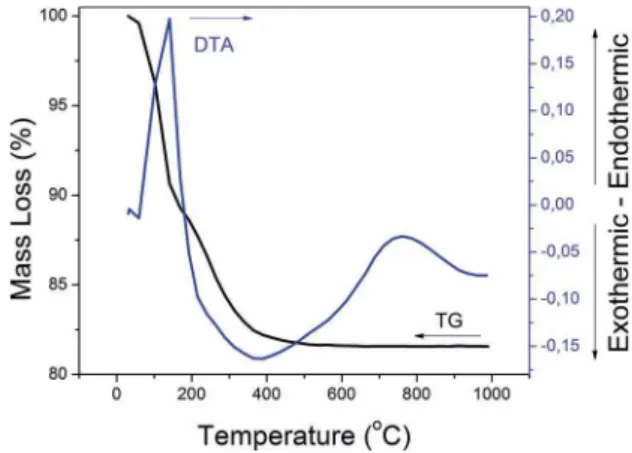
For further investigation of the crystallization processes and phase transition temperatures a thermogravimetry/ diferential thermal analysis (TG/DTA) measurement was carried out on the P4 sample, before any thermal annealing or pressing. This result is shown in Figure 2. There is an abrupt weight loss in the TG data, which occurs between 50 and 150°C, associated with the endothermic peak centered
Figure 2. TG and DTA for Titanium dioxide powder previous to any
thermal annealing. This powder became P4 sample after complete annealing as described in Table 1. The endothermic peak shown in the DTA, from 400oC to 1000° C is not accompanied by mass
loss in TG, which characterizes the phase transition anatase / rutile.
at 150oC in DTA curve. This weight loss can be related with
water desorption of the powder and solvent evaporation from the precursor solution 29. The weight loss between 150°C
and 400°C, accompanied by an exothermic peak centered at 380oC in the DTA curve, may be due to transformation
of peroxides into oxides, or by the evaporation of organic parts from the sample, coming from the Triton X-100, as
well as solvents 22,29. From 400ºC no mass loss is recorded
in TG, but there is the appearance of an endothermic region that starts at 650oC and goes until 800ºC in DTA, being
centered at 750oC, which shall represent the phase transition
anatase / rutile, characterized by a free mass loss process. This phase transition anatase / rutile is conirmed by the XRD difractograms shown in Figure 1, which shows rutile
dominant peaks for samples submitted to TA temperature of 1000oC, in good agreement with literature 2,13,30.
Figure 3 shows photoluminescence (PL) data for
measurement performed on TiO2 pellets with diferent TA.
The data are in very good agreement with difraction peaks
found in all samples related to incomplete phase transition,
shown in Figure 1. The observed band at 550 nm for P2 and P3 samples is probably related to the deepest levels of oxygen
vacancies of the anatase phase 22 and the band found around
800 nm is related to rutile phase of TiO223, 31. Concerning the
samples treated at 500oC, it is observed a higher intensity at
550 nm for P2 sample, which was thermally annealed only once, while P3, which has been treated two hours more than P2 has a higher relative intensity of the band at 800 nm,
which can be associated with a more developed transition of anatase to rutile phase, and also related to a decrease
in oxygen vacancy concentration 22. This more developed
excitons for bandgap energy excitation, which takes place due to a strong exciton-phonon interaction. Besides, in some
anatase nanostructures, the room temperature PL band was
attributed to oxygen vacancies33. However, the most striking
found result is that the large anatase band about 550nm was found even for single crystals 34, being attributed to
the recombination of self-trapped excitons. Then, it seems
fair to relate the observed bands in our case to intrinsic
defects such as oxygen vacancies and interstitial Ti3+ ions,
and exciton recombination. However, the band width may probably be related to crystallite size, as already discussed,
since the narrower band takes place for the sample with
larger crystallites, which means that the neighborhood in the case of smaller crystallites are more random, due to grain boundary depletion layer, which afects the defects energy distribution, leading to a larger PL band, in the case of anatase. It is also in good agreement with the XRD difratograms,
because when the anatase is the dominant phase the peak
width is larger (smaller crystallites) whereas for dominant rutile phase the XRD peaks are much more well deined (much larger crystallites).
TiO2 thin ilms were deposited on soda-lime glass
substrate and thermally annealed at 500oC, similar to the
treatment carried out for pellets, in order to investigate the anatase phase, and other thin ilm was deposited on quartz,
and thermally annealed at 1000oC, to investigate rutile phase,
also similar to thermal treatment carried out for pellets. Structural data of XRD for ilms are shown in igure 4 and reveals anatase and rutile phase for ilms deposited on glass and quartz, respectively. Similar to the results shown in igure 1, for pellets, the thermal annealing temperature determines the dominant phase present in the ilm. The crystallite size for the anatase phase is 2.5 nm for ilms deposited on glass substrates (anatase phase) and 11.7 nm for ilms deposited on quartz (rutile phase). Both crystallites are smaller than powder’s, probably due to intermediate TA at 80°C, between
Figure 3. Photoluminescence of pellets P1 to P4. The curves are
normalized with respect to intensity. Bands centered at 550 and 800 nm refer to anatase and rutile structures, respectively. Anatase structure is found in three samples with two phases present. Sample P4, with two thermal annealing (before and after pressing) presents only rutile structure.
the pressing to obtain pellets, because the pressure applied on the particles may promote the rearrangement of atoms in the crystal lattice, accelerating the phase transition. Although typically anatase / rutile transition is studied in terms of time
and temperature 2, the activation of anatase-rutile conversion
can also be initiated by pressure increase 4. On the other hand, samples treated at 1000oC (P1 and P4) present dominant
rutile structure, also veriied by XRD data, shown in Figure 1. These samples show the band in the 800 nm on the PL spectra. In the P4 sample, which had TA before and after pressing, only the rutile band is observed, which means that the second TA favored the complete phase transition. However
in the P1 sample, an incomplete transition is observed in the PL spectra, with comparable intensity of the anatase and
rutile bands. Again, conirmed with difractograms shown in Figure 1, which also reveals the presence of anatase structure. Samples such as P1 and P4, formed mainly by rutile phase have larger crystallites, which are larger for this phase, as conirmed by the XRD peak width shown in igure 1. The same behavior is observed for the sample P3, which features larger crystallites than P2, due to the higher
proportion of rutile phase in its structure 2. It is interesting
to notice that bands centered about 550 nm are wider than the band centered at 800nm. Plugaru and coworkers32 have
investigated policrystalline TiO2 thermally treated in the
range of 1100 to 1500oC, under distinct atmospheres, and
found results of cathode-luminescence very similar to our
PL data. In that case, the transitions in the range 820 and 850 nm are associated with the formation of Ti3+ interstitial
ions in rutile structure, and with its associated defect states,
during the sintering process. On the other hand, the band about 550nm has been reported in the literature either for anatase single crystals as well as nanostructures, and has been
commonly attributed to the recombination of self-trapped
Figure 4. XRD of TiO2 thin ilm deposited on glass substrates. Red
lines refer to Anatase (catalog JCPDS-ICDD 2003 ile number 78-2486). Inset: XRD difractogram for TiO2 ilm deposited on quartz
each of the four ilm layers. It facilitates nucleation of small crystallites which do not increase with the inal TA.
Figure 5 shows transmittance data and the evaluation of the indirect bandgap 2 for the anatase phase ilm (ig. 5(a)),
and the same sort of results for the rutile phase ilm (ig. 5(b)), in this case the bandgap is direct. The bandgap is about 3.4 eV for anatase phase ilm, and the high transmittance in the UV-Vis, allowed calculation of the ilm thickness from the oscillations of the interference fringes 35, of about 300
nm. The rutile phase ilm, with direct transition, present bandgap of about 2.9 eV, in fair agreement with literature 4.
Figure 6 shows the photo-induced current decay for
a TiO2 thin ilm deposited on soda-lime glass substrate, which is held in a pressure of 10-3 mbarr, after being excited
by irradiation with a deuterium lamp (UV), during 5 min, through interference ilter with peak at 270 nm (4.58eV).
The sample layout and the electrical measurement setup are
shown in the inset of ig. 6. In this measurement, after the light
excitation removal, the sample is taken to dark conditions,
when the current is measured, under an applied voltage of 20V. The same sort of measurement, where excitation is done with a InGaN LED is also provided, where the light source device has an average wavelength of 450 nm (2.75eV). Both measurements show excitation to similar current magnitudes, with a large increase in conductivity due to exposure to light. Besides, in both cases there is a quick return to steady state, with percentage decay of 98% and 99% to excitations with wavelengths of 270 and 450 nm, respectively, 20 min after removing the excitation. Surprisingly, either the excitation
as well the decay show similar results, which means that two
distinct sort of phenomena may be taking place: 1) excitation of intrabangap states, dominating over the electron-hole pairs, 2) the presence of particles belonging to diferent phases in the material, which have distinct bandgaps, and are more eiciently excited by distinct energy ranges. It is
Figure 5. (a) Evaluation of bandgap for anatase structure of TiO2 thin ilm, obtained from absorbance data. Anatase has indirect transition.
Inset: Transmittance spectra for TiO2 thin ilm deposited on soda-lime glass substrate. (b) Evaluation of bandgap for rutile structure of
TiO2 thin ilm. Rutile has direct transition. Inset: Transmittance for TiO2 thin ilm deposited on quartz substrate.
in good agreement with igure 3, which shows PL bands
characteristics of distinct phases in the same sample, and
with igure 5, which show distinct bandgaps for each phase, anatase (3.4eV) and rutile (2.9 eV). Electrical resistivity was evaluated for this ilm, before and after the excitation, from resistance data and using the following coniguration: L = 25 mm, d = 5 mm, and τ = 300 nm (these dimensions are also shown in the inset of igure 6). Before the excitation, in the dark, the sample electrical conductivity was 8.3x10⁻⁴
(Ω.m)-1, and after excitation for 5 min with the light of
wavelength 270 and 450 nm became 5.3x10⁻² and 4x10⁻²
(Ω.m)-1, respectively, an increase of the conductivity of up
to 64 times due to sample illumination.
The conductivity decay as function of time shown in
igure 6 can be modeled for both sort of structures (anatase and rutile). The monochromatic light source is either below bandgap energy or above, considering that the anatase phase is supposed to be dominant in this thin ilm sample (deposited on soda-lime glass substrate and thermally annealed at 500oC). Surprisingly the same sort or excitation and decay
are recorded, assuring that the generation and recombination are either more than only electron-hole pairs, coming also from intrabandgap states with lower ionization energy, or that there are crystallites of phases with bandgap about 2.75eV (450nm), in good agreement with results of XRD difraction
as well as PL data, which shows that samples are actually a
combination of crystallites belonging to both phases. In the modeling of this sort of experiment, it is fundamental to provide temperature dependent data. It has been carried
out for SnO2 thin ilms with several sort of doping such as Er-doped and Eu-doped26,36 or Sb-doped SnO237. However
the scope here is not to model it but only to report the efect of monochromatic light excitation and current decay, and besides, to show the much faster efect of carrier capture
paper, it is enough to relate that although capture belonging to distinct energy levels takes place, the excitation of this sample can be similar, independent of excitation energy,
due to the presence of distinct phases in the material, which
have distinct bandgap energies. A modeling to a room-temperature approach has been recently used for GaAs/SnO2
heterojunctions40, where it was proposed that the current decay comes from a combination of two factors: a variation in the
concentration of scattering centers as the electron capture takes place as well as distinct trapping centers at diferent time intervals, such as doping centers and oxygen vacancies,
which are also widely present in the TiO2 samples.
4. Conclusion
Although thermal annealing is responsible for phase transition anatase/rutile in TiO2, the thermal annealing
procedures used in this work showed incomplete phase
transformation, even with applying pressure for pellet sample conformation. Characterization of optical, structural and electrical properties by photoluminescence, X-ray difraction
and transient decay of photoinduced current reveal that the presence of a combination of these two phases may
be responsible for the observed properties of the sample. In general, a thermal annealing at 500oC leads to a sample
with dominant anatase phase properties whereas a thermal
annealing at 1000oC lead to a rutile dominant phase properties.
Irradiation with monochromatic light strongly afects the thin ilm conductivity, but the energy range (above or below the bandgap energy) does not seem to afect the excitation behavior, which is associated either with the ionization of intrabandgap states or to crystallites belonging to phases with distinct bandgaps.
The observed properties of this material indicates a high sensitivity for excitation with monochromatic light, which can
be tuned, in order to choose the convenient phase properties,
Besides, a fast decay to the ground state indicates a suitable property for applications in opto-electronic speedy devices.
5. Acknowledgements
We thank the inancial support of Capes and FAPESP. We also thank Prof. P. L. Noronha and L. D. Trino for help
in the synthesis of TiO2 solution. We also thank Prof. J. H.
D. da Silva and N. F. Azevedo for help in transmittance measurement in the UV -Vis region, and Prof D. I. dos Santos for help in measurements of TG / DTA and XRD, which were performed at Multiuser Lab. at UNESP/DF Campus Bauru.
6. References
1. Park YR, Kim KJ. Structural and optical properties of rutile and
anatase TiO2 thin ilms: Efects of Co doping. Thin Solid Films.
2005;84(1-2):34-38. DOI: 10.1016/j.tsf.2005.01.039.
Figure 6. Decay of photoinduced current in TiO2 thin ilms, with
ixed potential of 20V and excitation with distinct light sources for 5 minutes. LED source: 15W, deuterium source: 30 W (previous to the interference ilter). A very quick response was obtained, which sharply increases sample conductivity at the end of the excitation. Inset
shows sample layout, with electrical connections and dimensions:
ilm thickness (τ), distance (d) and width (L) of the contacts. (PPC) phenomena observed at low temperature for SnO2
(mainly at 70 K), is not expected for TiO2. However, the decay can be modeled, because the sample conductance is
a function of time, for a ixed temperature, being given by:
( )
G t
Q
V
=
"
K n t
s$
Q
V
$
n
Q
t
V
$
q
%
1
where Ks is a constant, n(t) is the time dependent free carrier concentration, µ(t) is the time dependent electronic mobility, and q is the electron charge.
The observed decay of conductivity as function of time
means that the resistance of the ilm increases with time. The
decay of photo-induced electrons (n) from the conduction
band to the trapping defect is given by a simple diferential equation 38, whose solution was previously published 36,37.
Considering that in this sort of oxides, the mobility (µ) is dominated by the grain boundary scattering, we may neglect bulk scattering mechanisms (phonon and ionized impurity). Then, electrical transport, dominated by grain boundary scattering, is an adequate hypothesis, since the grain size is very small. The mobility due to grain boundary scattering
is proportional to T-1/2exp(-φk-1T-1)39, where φ is the grain
boundary potential barrier. The evaluation of current decay
for a complete set of temperatures lead to 36:
( )
exp
R
o
=
Tan
=
K
D$
T
$
"
-
Q
E
cap-
z
V
$
Q
kT
V
-1%
2
where •
R is the tangent of the time-dependent resistance,
KD is a constant and Ecap is the capture energy for trapping by the dominant defect. Therefore a plot of ln (Tan.T-1) as function of T-1 yields the quantity (E
cap-φ) directly from the
curve inclination. Figure 6 allows identifying that each curve
2. Hanaor DAH, Sorrel CC. Review of the anatase to rutile phase transformation. Journal of Materials Science.
2011;46(4):855-874. DOI: 10.1007/s10853-010-5113-0.
3. Mikami M, Nakamura S, Kitao O, Arakawa H, Gonze X. First-Principles Study of Titanium Dioxide: Rutile and Anatase.
Japanese Journal of Applied Physics. 2000;39(Pt 2 8B):L847.
DOI: 10.1143/JJAP.39.L847.
4. Carp O, Huisman CL, Reller A. Photoinduced reactivity of titanium dioxide. Progress in Solid State Chemistry.
2004;32(1-2):33-177. DOI: 10.1016/j.progsolidstchem.2004.08.001.
5. Kalyanasundaram K, ed. Dye-Sensitized Solar Cells. Lausanne:
EPFL Press; 2010.
6. Fujishima A. Electrochemical Photolysis of Water at a Semiconductor Electrode. Nature. 1972;238:37-38. DOI: 10.1038/238037a0.
7. Zeng W, Liu T, Wang Z. Impact of Nb doping on gas-sensing
performance of TiO2 thick-ilm sensors. Sensors and Actuators B: Chemical. 2012;166-167:141-149. DOI: 10.1016/j.
snb.2012.02.016.
8. Garzella C, Comini E, Tempesti E, Frigeri C, Sberveglieri G.
TiO2 thin ilms by a novel sol–gel processing for gas sensor
applications. Sensors and Actuators B: Chemical.
2000;68(1-3):189-196. DOI: 10.1016/S0925-4005(00)00428-7.
9. Ding K, Miao Z, Hu B, An G, Sun Z, Han B, et al. Study on the Anatase to Rutile Phase Transformation and Controlled Synthesis of Rutile Nanocrystals with the Assistance of Ionic Liquid. Langmuir. 2010;26(12):10294-10302. DOI: 10.1021/
la100468e.
10. Choudhury B, Choudhury A. Local structure modiication and
phase transformation of TiO2 nanoparticles initiated by oxygen
defects, grain size, and annealing temperature. International Nano Letters. 2013;3(1):55. DOI: 10.1186/2228-5326-3-55.
11. Kandiel TA, Robben L, Alkaim A, Bahnemann D. Brookite
versus anatase TiO2 photocatalysts: phase transformations and
photocatalytic activities. Photochemical & Photobiological Sciences, 2013;12(4):602-609. DOI: 10.1039/C2PP25217A.
12. Su C, Hong BY, Tseng CM. Sol–gel preparation and photocatalysis of titanium dioxide. Catalysis Today. 2004;96(3):119-126. DOI:
10.1016/j.cattod.2004.06.132.
13. Sun Y, Egawa T, Zhang L, Yao X. High Anatase-Rutile Transformation Temperature of Anatase Titania Nanoparticles Prepared by Metalorganic Chemical Vapor Deposition. Japanese Journal of Applied Physics. 2002;41(Pt 2 8B):L945. DOI:
10.1143/JJAP.41.l945.
14. Sivakumar S, Pillai PK, Mukundan P, Warrier KGK. Sol–gel synthesis of nanosized anatase from titanyl sulfate. Material Letters. 2002;57(2):330-335. DOI: PII: S0167-577X(02)00786-3.
15. Watson SS, Beydoun D, Scott JA, Amal R. The efect of
preparation method on the photoactivity of crystalline titanium
dioxide particles. Chemical Engineering Journal.
2003;95(1-3):213-220. DOI:10.1016/S1385-8947(03)00107-4.
16. Guo G, Ito A, Goto T, Tu R, Wang, Shien Q, et al. Preparation
of rutile TiO2 thin ilms by laser chemical vapor deposition
method. Journal of Advanced Ceramics. 2013;2(2):162-166.
DOI: 10.1007/s40145-013-0056-y.
17. Okuya M, Nakade K, Kaneko S. Porous TiO2 thin ilms
synthesized by a spray pyrolysis deposition (SPD) technique and their application to dye-sensitized solar cells. Solar Energy Materials and Solar Cells. 2002;70(4):425-435. DOI: 10.1016/
S0927-0248(01)00033-2.
18. Cho IS, Choi J, Zhang K, Kim SJ, Jeong MJ, Cai L, et al. Highly Eicient Solar Water Splitting from Transferred TiO2
Nanotube Arrays. Nano Letters. 2015;15:5709-5715. DOI:
10.1021/acsnanolett.5b01406.
19. Mor GK, Varghese OK, Paulose M, Grimes CA. Transparent Highly Ordered TiO2 Nanotube Arrays via Anodization of Titanium
Thin Films. Advanced Functional Materials.
2005;15(8):1291-1296. DOI: 10.1002/adfm.200500096.
20. Mor GK, Shankar K, Paulose M, Varghese OK, Grimes CA. Use of Highly-Ordered TiO2 Nanotube Arrays in Dye-Sensitized
Solar Cells. Nano Letters. 2006;6(2):215-218. DOI: 10.1021/
nl052099j.
21. Tang H, Prasad K, Sanjinès R, Schmid PE, Lévy F. Electrical
and optical properties of TiO2 anatase thin ilms. Journal of Applied Physics. 1993;75(4):2042-2047. DOI: 10.1063/1.356306.
22. Nasr M, Chaaya AA, Abboud N, Bechelany M, Viter R, Eid C, et al. Photoluminescence: A very sensitive tool to detect the
presence of anatase in rutile phase electrospun TiO2 nanoibers.
Superlattices and Microstructures. 2015;77:18-24. DOI:
10.1016/j.spmi.2014.10.034.
23. Wang X, Feng Z, Shi J, Guoqing J, Shen S, Zhou J, et al. Trap
states and carrier dynamics of TiO2 studied by photoluminescence
spectroscopy under weak excitation condition. Physical Chemistry Chemical Physics. 2010;12(26):7083-7090. DOI:
10.1039/B925277K.
24. Cullity BD, Stock R. Elements of X-Ray Difraction. 3rd Ed.
New Jersey: Prentice Hall; 2001.
25. Boratto MH, Scalvi LVA, Goncharova LV, Fanchini G. Efects of Solution History on Sol-Gel Processed Tin-Oxide Thin-Film Transistors. Journal of the American Ceramic Society.
2016;92(12):4000-4006. DOI: 10.1111/jace.14459.
26. Ravaro LP, Scalvi LVA, Boratto MH. Improved electrical transport in lightly Er-doped sol–gel spin-coating SnO2 thin
ilms, processed by photolithography. Applied Physics A.
2015;118(4):1419-1427. DOI: 10.1007/s00339-014-8900-7.
27. Bickley RI, Gonzalez-Carreno T, Lees JS, Palmisano, L, Tilley RJD. A structural investigation of titanium dioxide photocatalysts.
Journal of Solid State Chemistry. 1991;92(1):178-190. DOI:
10.1016/0022-4596(91)90255-G.
28. Zhang J, Xu Q, Li M, Feng Z, Li C. UV Raman Spectroscopic
Study on TiO2. II. Efect of Nanoparticle Size on the Outer/Inner
Phase Transformations. The Journal of Physical Chemistry C.
2009;113(5):1698-1704. DOI: 10.1021/jp808013k.
29. Madarász J, Okuya M, Varga PP, Kaneko S, Pokol G. TG/ DTA-EGA-MS studies on titania precursors with low content of organics for porous thin ilms of TiO2. Journal of Analytical and Applied Pyrolysis. 2007;79(1-2):479-483. DOI: 10.1016/j.
30. Satoh N, Nakashima, Yamamoto K. Metastability of anatase: size dependent and irreversible anatase-rutile phase transition in atomic-level precise titania. Scientiic Reports. 2013;3:1959. DOI: 10.1038/srep01959.
31. Sonawane RS, Hegde SG, Dongare MK. Preparation of titanium(IV) oxide thin ilm photocatalyst by sol–gel dip coating. Materials Chemistry and Physics. 2003;77(3):744-750. DOI: 10.1016/
S0254-0584(02)00138-4.
32. Plugaru R, Cremades A, Piqueras J. The efect of annealing in diferent atmospheres on the luminescence of polycrystalline TiO2. Journal of Physics: Condensed Matter.2004;16(2):S261-S268.
DOI: 10.1088/0953-8984/16/2/031.
33. Nemashkalo AB, Busko TO, Peters RM, Dmytrenko OP, Kulish MP, Vityuk NV, et al. Electronic band structure studies of anatase
TiO2 thin ilms modiied with Ag, Au, or ZrO2 nanophases.
Physica Status Solidi B. 2016;253(9):1754-1764. DOI: 10.1002/
pssb.201600042.
34. Tang H, Berger H, Schmid PE, Levy F. Optical Properties of
Anatase (TiO2). Solid State Communications. 1994;92(3):267-271.
35. Cardoso WS, Longo C, De Paoli MA. Preparação de eletrodos opticamente transparentes. Química Nova. 2005;28(2):345-349.
DOI: 10.1590/S0100-40422005000200030.
36. Morais EA, Scalvi LVA, Cavalheiro AA, Tabata A, Oliveira JBB. Rare earth centers properties and electron trapping in SnO2 thin
ilms produced by sol–gel route. Journal of Non-Crystalline Solids.
2008;354(42-44):4840-4845. DOI: 10.1016/j.jnoncrysol.2008.04.029.
37. Floriano EA, Scalvi LVA, Sambrano JR, de Andrade A. Decay of
photo-induced conductivity in Sb-doped SnO2 thin ilms, using
monochromatic light of about bandgap energy. Applied Surface Science. 2013;267:164-168. DOI: 10.1016/j.apsusc.2012.09.003.
38. Dobson TW, Scalvi LVA, Wager JF. Transient decay of persistent
photoconductivity in Al0.3Ga0.7As. Journal of Applied Physics.
1990;68(2):601-605. DOI: 10.1063/1.346785.
39. Zhang DH, Ma HL. Scattering mechanisms of charge carriers in transparent conducting oxide ilms. Applied Physics A.
1996;62(5):487-492. DOI: 10.1007/BF01567122.
40. Bueno CF, Scalvi LVA. On the electrical properties of distinct